Lots Happening, What Does It Mean?
Monthly Market and Economic Update – May 2022

Peter Flannery Financial Adviser CFP
“If you have one economist on your team,
it’s likely that you have one more than you’ll need.”
Warren Buffett
Key Points:
-
Inflation is spiking, will it peak anytime soon?
-
China’s lock down, impacting on economic growth which we need to watch closely.
-
Ukraine, no end in sight.
-
Rising interest rates, the US Fed is looking at several more rate hikes.
-
Property and share prices volatile, good.
THE MARKETS
Markets, having rediscovered uncertainty and volatility, are starting to get ‘wound up’ so to speak. Sharp rises and falls across markets suggest we are making progress and likely moving to even greater levels of volatility soon. The traders are active too, amplifying the volatility. Good.
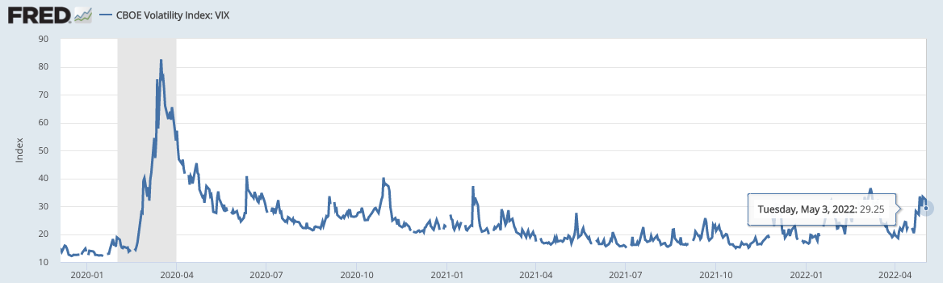
The above graph tracks the share market volatility index known as the VIX.
This is about how much volatility is going on at any point in time.
We all know that markets are volatile, although interestingly, those who don’t follow markets much, are probably oblivious to it and are actually fine about it.
Others follow the markets and interestingly, have different responses to it. Those that are more advanced quite like volatility because they know it means better buy prices, whereas those that perhaps are more defensive tolerate it, or indeed have anxiety about it.
As always, it’s interesting to see how different people and markets respond to the same thing.
Markets are volatile at the moment, but as you can see from the (VIX) chart above, the level of volatility, whilst up a bit from where it was in the middle of 2021, is slightly less than it was in mid-2020 and certainly around March 2020 which is the spike in the VIX graph above.
So, volatility is somewhat elevated but not significantly so. The cash up value of your portfolio, by the way, to some degree, will track this graph, especially in the short term.
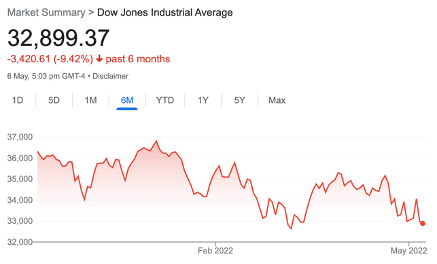
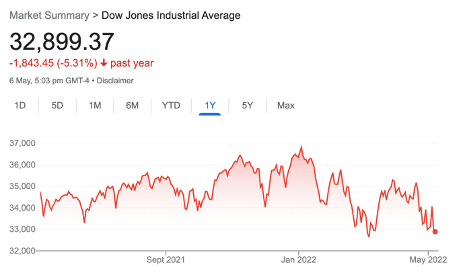
The chart on the left shows the US share market (the Dow Jones) over the last six months. The chart on the right shows the US share market (the Dow Jones) over the last year.
As I’ve mentioned previously, inflation spiking has driven the US Federal Reserve and other central banks around the world to raise interest rates. This is a theme that we may see continue, possibly over much of 2022 and possibly beyond. Therefore, I believe markets will be volatile along the way for much of that time.
Key point
Perhaps the key point though, is that markets won’t wait until inflation is tamed and interest rates are at the peak before they start to feel happy again, moving in an upward direction (‘up and to the right’, as they say, if you’re looking at a graph).
Somewhere along the way, perhaps when markets sense that inflation is looking like being tamed, the markets may decide to start feeling less unhappy. I suspect that once the market believes that the inflation problem has been resolved, it may then look through inflation data. At that point, we could see markets develop a trend in an upward direction. It could be an uneven process of market volatility, but in an upward direction. Unfortunately, it’s difficult to pick in advance exactly when that might be.
The good news though, is that we don’t need to. We can take our time, allowing prices to come to us, rather than feeling the need to chase rising prices or second-guess market direction (patience grasshopper 😉 )
Some US share market history
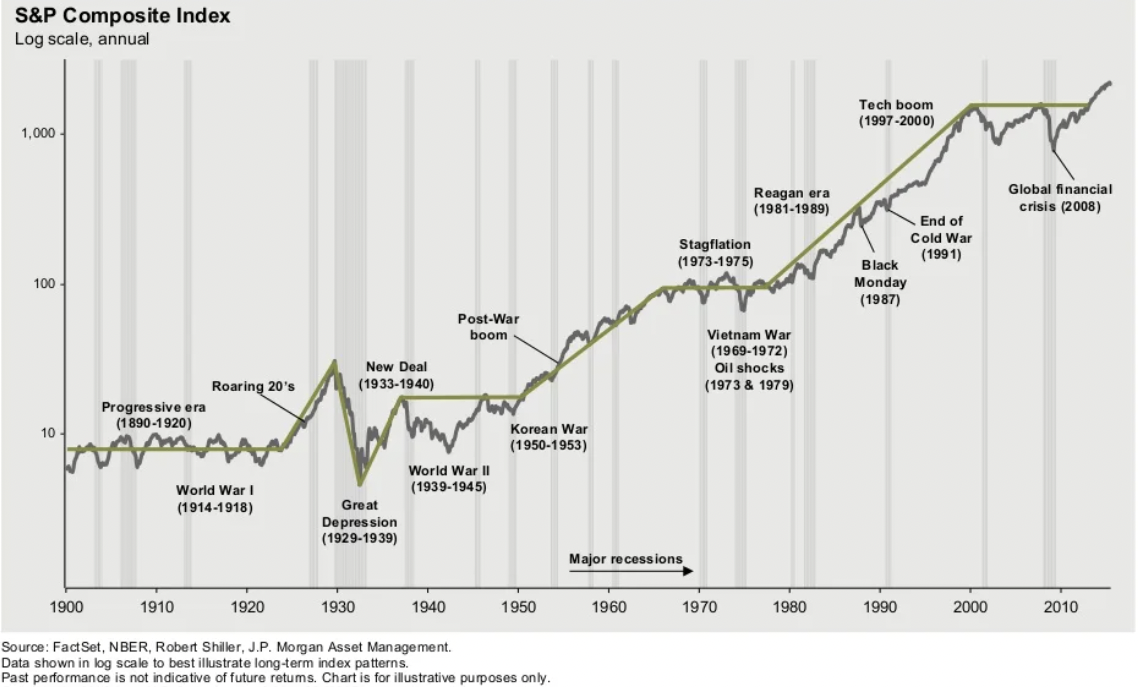
The above graph offers a simple view of the American share market since 1900 up to around 2020. The grey-shaded bars represent recessions.
Whilst none of us have a 100 or even an 80-year timeline ahead of us, our runway though could easily be 15, 20 years or much more.
Even if I am 65, the runway ahead could be 25 or 30 years potentially. In other words, there’s plenty of time for markets to bob up and down or, in the words of those that are somewhat more fatalistic, time for their portfolio to recover from big losses!
Anyway, an overfocus on this quarter or this year’s company report or last year’s cash up value of your portfolio, whether it be higher or lower than its current level now, is interesting information but can miss the point though.
I call it ‘score card’ information. It helps keep score but is hardly the overarching strategy or framework for investing success. Scorecard data deserves only a small amount of time and minimal emotional investment / expense.
The reality is your portfolio cash up value will fluctuate in tune with the market in the short term. However it will rise in line with the quality of the businesses in which you invest, particularly in the long run. In the short term though, there are lots of variables, and it’s quite right to expect random volatility across your portfolio.
Ukraine
Perhaps the Ukraine situation is worth a mention with regards to markets. I’ve mentioned previously that markets generally tend to finish higher when a war finishes than when it began. It looks as though there is a degree of determination from Russia, or perhaps more specifically Vladimir Putin, to do what it takes and to get what he wants. As much as we would like to see the end of this war, wars don’t always finish on time or early.
The markets are aware of the situation and occasionally become a bit anxious. However, in general terms, the market tends to look through it and focus on other items such as inflation and interest rates.
For us as investors, volatility is the order of the day, and we’ll see this continue for some time yet. This means that opportunities will be opening up along the way. Inflation is talked about in negative terms and of course, it’s not a good thing when it becomes excessive.
Inflation though, does mean growth, and that’s what is happening with regard to the US economy and the global economy.
Further, we know that the latest round of company reports in the US show that over 80% beat market expectations. That’s a healthy market ( even though trading prices are volatile).
The Global Economy

The above infographic shows the approximate level of interest rates in a number of countries around the world.
Interest rates are a key driver of both markets and the economy. They’re not the only driver, but they do have a significant impact, particularly when they move swiftly and significantly.
Whilst the interest rates showing in the diagram above for the United States and New Zealand have now increased a bit, it’s interesting to see the current level of interest rates around the world. The bottom line is that in more developed countries, interest rates are not far from all-time lows. That’s very accommodative and supportive of economic activity.
With the coronavirus creating supply-chain disruption and spiking inflation, central banks around the world are moving to head off inflation before it gets out of control. Who knows whether they are too late or not? Whatever the case, they’ll simply continue lifting rates until inflation is strangled, even if it means putting their economy into a recession. We could be heading in that direction.
Because America is a sizeable economy, then whatever it does flows on to the rest of the world. From an interest rate point of view though, there is some evidence that New Zealand is leading the way with regard to interest rate rises. America has just initiated a 50 basis point rate hike (half of a percent).
Expect interest rates to rise, possibly over much of 2022 and possibly into 2023 (not that I’m one for predicting the future!).
Although it’s difficult to know how high rates will climb, it’s still difficult to see rampant inflation as we saw in the 1980s and the 1990s.
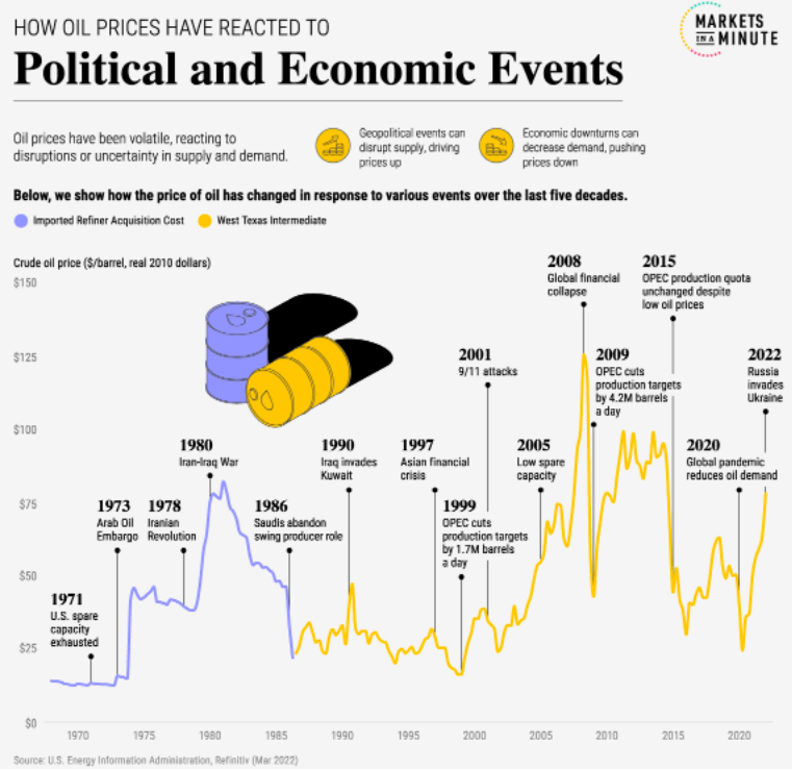
The above graph tracks the movement in oil prices from 1970 through 2022.
Demand for oil and liquified natural gas (LNG) has spiked for a number of reasons.
There has been the impact of the Ukraine situation, but in addition, Asian markets over 2021 were strong users of LNG and interestingly, a less windy European season meant a greater need for LNG.
There have been some operational challenges that different companies faced as well. However, what we now see is the spike in pricing, which will impact consumers in the not-too-distant future.
At the extreme end of things, additional costs for heating and transportation may mean that consumers have less discretionary money, and of course, this is a potential headwind for economies such as Europe and the US. Here in New Zealand, we’ve seen petrol prices at the pump rise significantly, which is starting to impact everyday Kiwis.
At this stage though, there appears to be sufficient supply globally, although it will be interesting to see the impact of Russian embargos and Vladimir Putin’s response in terms of turning off the tap and restricting supply. Although this situation could create real difficulty, we don’t appear to be in that space for now.
ANZ Global Commodity Price Index
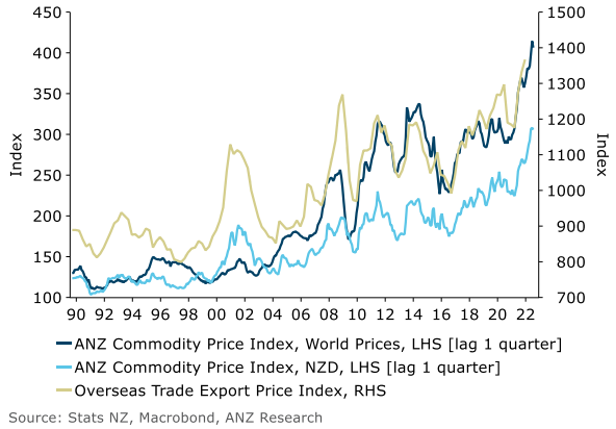
The above graph tracks global commodity prices.
As the graph above highlights, global commodity prices have been in an upward trend for some time and more recently, have spiked. The ANZ global commodity price index though, eased back 1.9% in April after trending in an upward direction since the beginning of 2022.
On another note, shipping prices also have spiked in recent times, although we are starting to see some reduction in those massive price increases for the last 12 to 18 months or so.
Still, with China battling against the spread of the coronavirus, lockdowns of their two largest cities have created a further backlog at shipping ports in China. That means goods ordered by consumers in other parts of the world, to some degree, remain stuck in China.
The point here is that it will be interesting to see how this impacts general inflation over the next few months. That is important because, if it creates further spiking or indeed, sticky inflation, then that means that the US Federal Reserve and other central banks have a tougher job, and will need to continue driving interest rates up.
In general terms, the global economy is coping with the Ukraine situation and whilst it is a horrible event, markets are keeping an eye on it but basically taking it in their stride.
Commodity prices have spiked, inflation is also spiking, and interest rates are on their way up.
Share markets are volatile and will likely remain so for the foreseeable future. It’s good news, of course, because volatility opens up opportunities.
The United States of America
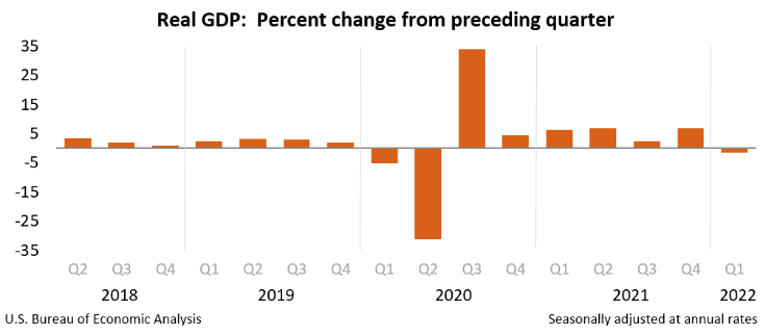
The above graph tracks economic growth in America as measured by Gross Domestic Product (GDP).
The surprise announcement recently was the shrinking US economy in the first quarter of 2022.
This has been labelled as a 1.4% GDP miss, but of course, it’s important to be aware that this is the annualised figure. In other words, the economy did not shrink by 1.4% in the first quarter of 2022. It shrunk by much less than that (25% of 1.4%, in fact) but was reported as an annual percentage number.
Although still unexpected, it was a result of imports being greater than exports in general terms, which is partly why the markets shrugged it off.
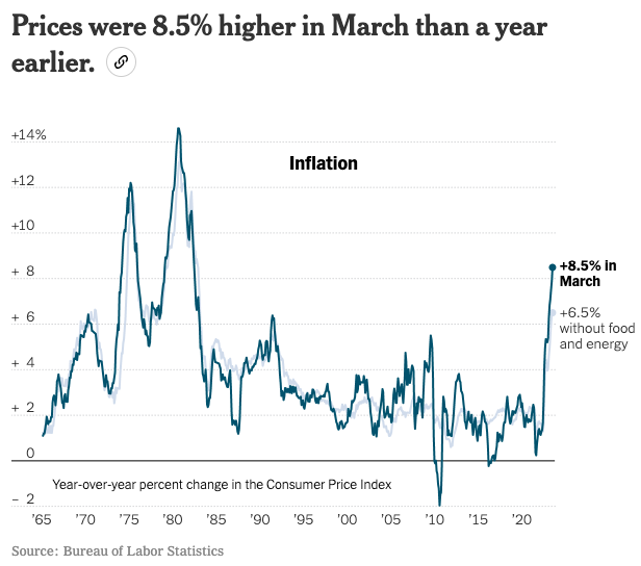
The above graph tracks inflation in America from 1965 through 2022.
So, inflation hit 8.5% in the United States recently, which is the fastest 12-month increase since 1981.
Petrol prices accounted for over half of the monthly increase in inflation, but also food prices increased as well. Americans apparently believe that Joe Biden is to blame.
The chart above then shows inflation spiking is one of the big reasons for interest rate rises in America, here in New Zealand and soon in other parts of the world too.
The Fed dot plot
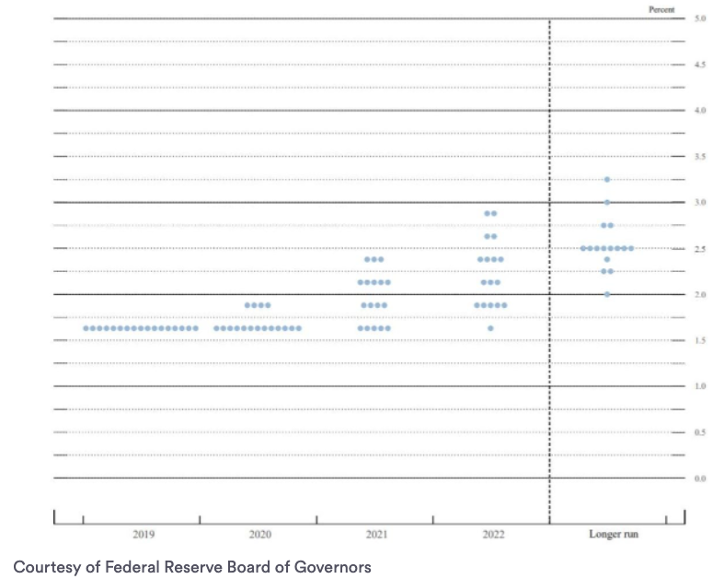
The above table plots the thinking of the board of governors in the Federal Reserve Bank of America. Simply, it’s their collective thinking about where they see interest rates in the future.
The above graph is somewhat anecdotal. However, it does give some clues as to what the US Fed is thinking. In particular, look for clusters of dots that can indicate where any Fed bias may exist. The bigger the clusters of dots shows that a number of Fed governors are thinking the same way.
Although time will tell, we can’t see much in the way of spiking interest rates like we saw in the 1980s and the 1990s (at least not yet anyway).
The US economy, whilst it did slow down surprisingly in the first quarter of this year, nonetheless remains in growth mode and overall is tracking reasonably well.
There is strength in economic growth along with low unemployment and interest rates remaining accommodative.
For us as investors, this indicates that the latest round of company profit announcements potentially look sustainable into the future.
China
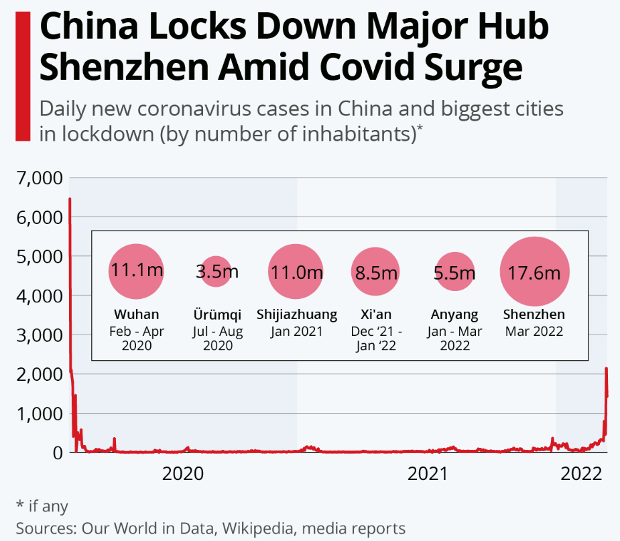
The above graph tracks the spread of the coronavirus from 2020 through 2022.
China continues to follow the coronavirus elimination strategy.
This has led to almost a total shutdown of Shenzhen and other major cities in China, leading to slowing economic activity.
The battle between the Chinese government and now the Omicron variant continues.
GDP – China
The above graph tracks economic growth in China as measured by Gross Domestic Product (GDP).
The Chinese economy continues to grow at a solid pace, all things considered. I would expect to see some slowing of the Chinese economy, even if it is in the shorter term as a result of the lockdowns that are currently underway. As we know, when people are locked up at home, they don’t spend much money in certain areas of the economy, which basically slows down economic growth. Not a major problem longer-term but a factor that may impact Chinese economic growth in the short term.
New Zealand
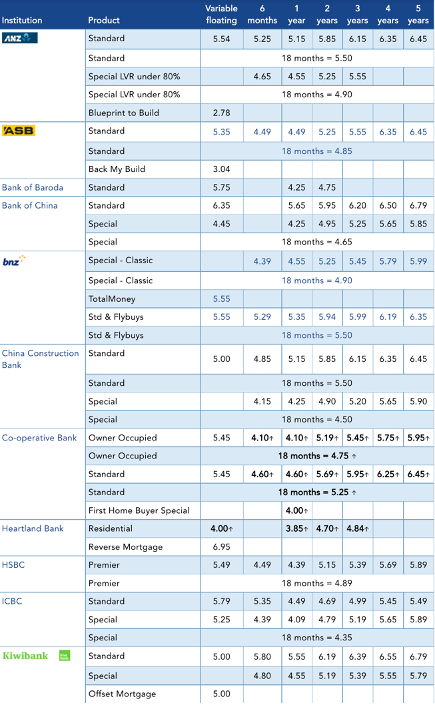
Mortgage interest rates
Term deposit interest rates
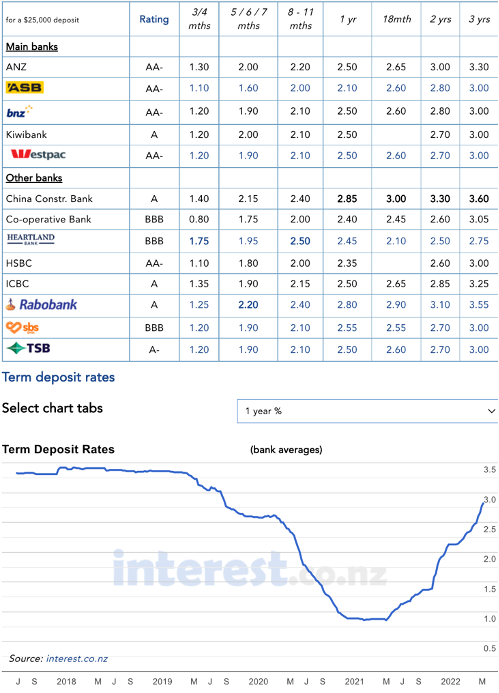
The table on the left shows recent mortgage interest rates. The table on the right outlines recent term deposit rates.
So, interest rates are on the rise. This is true, particularly for America and New Zealand. Other economies will follow.
Although we’ll need to wait and see, I would expect higher interest rates to further impact residential property prices. I don’t see a collapse in residential property prices, but I do see slowing growth, flattening out in some areas and declines of circa 5-10% in other areas.
Official cash rate (OCR) decisions and current rate
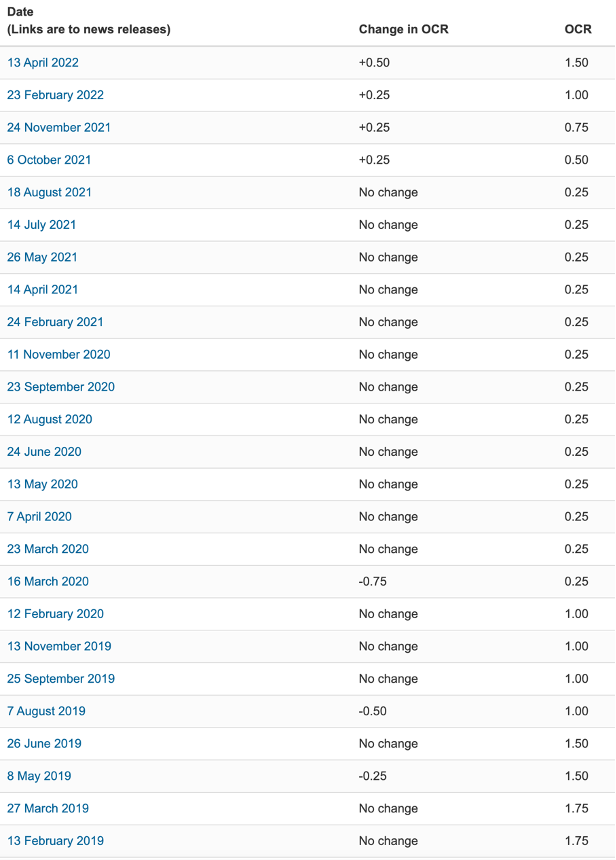
The above table shows the changes in the official cash rate from 2019 to date.
Just so you know, there is a change in the name of the Official Cash Rate (OCR) announcements to Monetary Policy Review (MPR) announcements. The reason for the name change is that, they say the change in the official cash rate is only one of their tools. They also use other tools that are used for forward guidance to achieve the mandate of low and stable inflation and full employment.
Unemployment rate – New Zealand
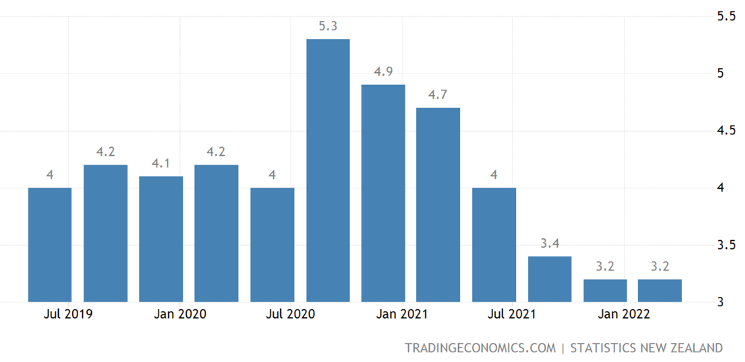
The above bar graph tracks the unemployment rate in New Zealand.
Unemployment in New Zealand remains pretty much unchanged from the previous report, at an all-time low of 3.2% in the first quarter of 2022. The labour participation rate was 70.9%, down slightly from 71.1% previously. Meanwhile, the under-utilization rate (those who want and are available to work but not currently looking) is at 9.3%, up slightly from 9.2% previously.
It’s become newsworthy that many employers are looking out for employees and struggling to get new people on board. This will likely lead to increased wage demands in some areas, which of course, pushes up inflation, which is already at a lofty level. Still though, businesses will need to be able to fund those increased wages.
There is now cause for the Labour party (the New Zealand government) to open up the gates a bit more and let more people into New Zealand in order to provide skilled workers. In short, this will need to happen soon. Otherwise, the current pace of economic growth may slow down and start to create other problems.
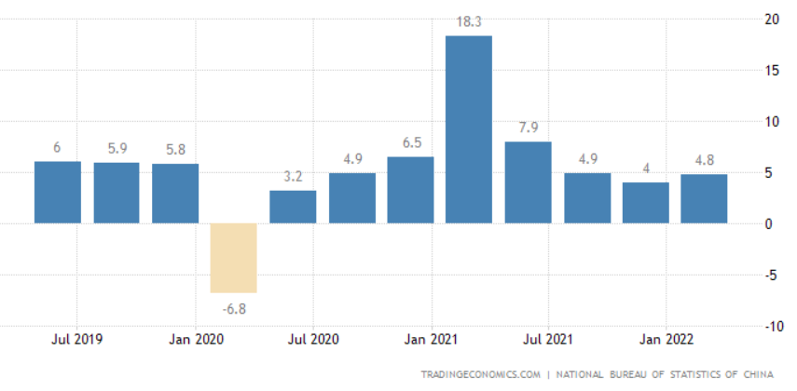
Economic Growth (GDP) – New Zealand
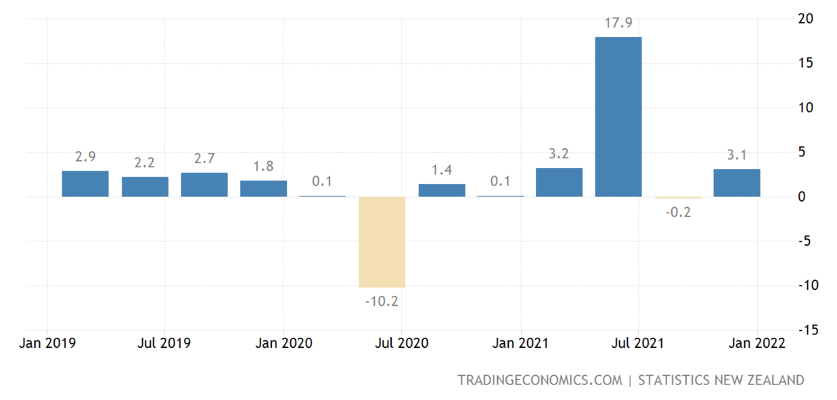
The above graph tracks economic activity and growth in New Zealand as measured by Gross Domestic Product (GDP).
Although a bit up and down, as you can see from the above graph, economic growth is currently tracking at around 3%, which is good. As I mentioned earlier though, it becomes more interesting if the current shortage of workers continues for a lengthy period of time.
To Summarise …
At the moment, it’s all about interest rates everywhere you look. New Zealand and America are leading the way, and some are starting to argue that here in New Zealand, we are getting near the peak of interest rate rises. I’m not so sure about that because interest rate rises in the US may have much further to go yet.
The coronavirus continues to impact, although now with developing herd immunity and vaccinated populations, governments are opening up for business. Things are getting back on track to some degree. The coronavirus though continues to mutate, creating problems in the likes of China as they continue to focus on their elimination mandate. It will be interesting to see how that plays out.
In the meantime, supply chain constraints are amplified because of the situation in China. Their economic growth will likely slow down should their lockdown measures not work and take time to play out. I imagine if they can hang tough and stay with those lockdowns, they have the chance of getting some control. Whether they’ll eliminate the virus is another question.
The horror of the Ukraine war continues, and some commentators suggest there is no end in sight. Markets currently are looking through the situation and are focused primarily on inflation and rising interest rates.
The credit cycle has shifted, and we are now in a phase of tight money conditions and rising interest rates. We now have inflation, and whilst the media makes it sound as though everything is bad and everyone is to blame, the reality is that the US and New Zealand, for example, along with a number of other countries, continue to see economic growth and stability. Unemployment rates in New Zealand and the US are low, as they are in many other economies.
Rising interest rates indeed is a symptom of that underlying growth.
The profit announcements from companies across the American markets over the last couple of weeks were good, with over 80% of reports to date beating expectations. Again, that signifies sound economic growth.
If you’ve been investing for decades, then you know that what we’re seeing now is nothing new.
If you’re a bit new to the game, then you might be wondering what’s going on with all this volatility?! At the risk of sounding boring, it is nothing new and the same old. Just remember, at WISEplanning we invest in the business, not the stock.
The intrinsic value of that business is a function of how well that business uses capital, not the trading price rising or falling. They are two different things.
Smart investors focus on their goals and objectives and investing requirements. They align their portfolios with the appropriate strategy to drive investing success and the achievement of their goals.
Markets, economies, interest rates, and changes in credit cycles, are simply part of the game and ‘noise’ along the way. What matters is that you invest in quality businesses that grow long-term. That is my job.
To be even more boring, how are you going with regard to volatility? (I’m now becoming part of that noise by even mentioning it again!).
I’m sure if you’ve been around for many years, it’s nothing new, but even so, if you have the slightest bit of anxiety about volatility, get in touch and let’s talk. Just email invest@wiseplanning.co.nz or call 0800 11 90 80.
In the meantime, the greater the volatility and the lower prices go, the better I like it… what about you?
“Peter, I’ll have the returns on my portfolio, thank you. You can have the volatility!”
John M. Christchurch