Inflation, Interest Rates!
Monthly Market and Economic Update – June 2022

Peter Flannery Financial Adviser CFP
“If you have one economist on your team,
it’s likely that you have one more than you’ll need.”
Warren Buffett
Key Points:
-
Inflation is not slowing down.
-
Interest rates will need to go higher.
-
Then there is oil prices, spiking up.
-
Is it all doom and gloom, is there anything good happening?
THE MARKETS
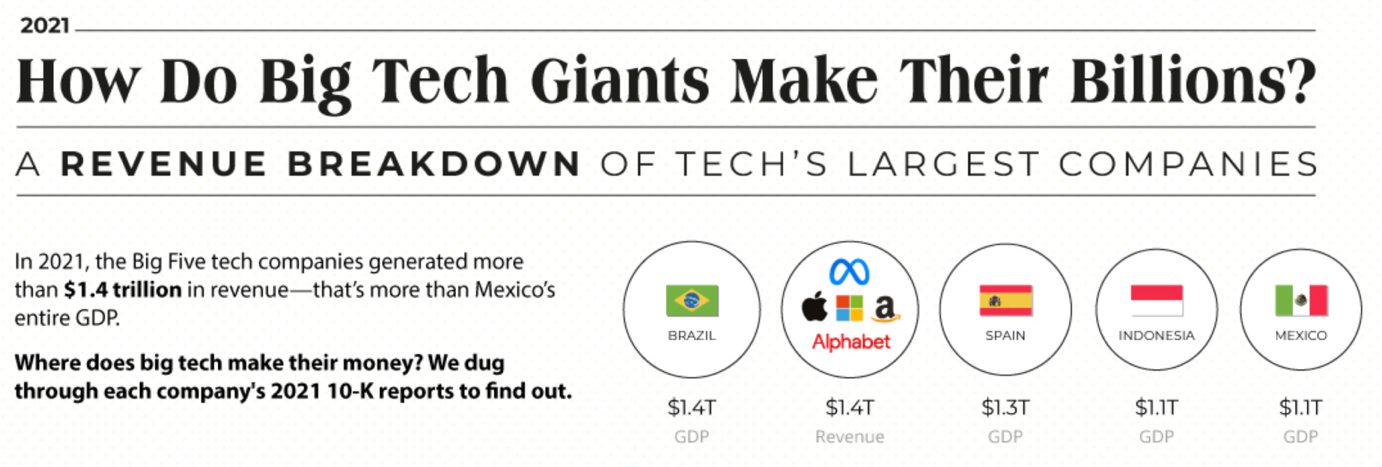
Big Tech
The news around big tech is that it’s out of favour, and the market has been rotating away from big tech into commodities, health care, and other sectors.
Big tech however, has a place in the world that is not going away anytime soon.
We’ve seen the trading prices of big tech companies decline as part of this rotation process. Their trading prices were expensive by a number of measures.
We should separate big tech though, from high flying tech. High flying tech are those businesses that, although a great idea and very popular, gaining new customers in significant numbers daily but have not been profitable. They are a totally different proposition to big tech (as per those outlined above) that consistently generate reliable operational profits.
So how do they make their money?
Basically, there are two main ways that large tech companies generate revenue:
- They either sell you a product,
- or sell you as a product to advertisers
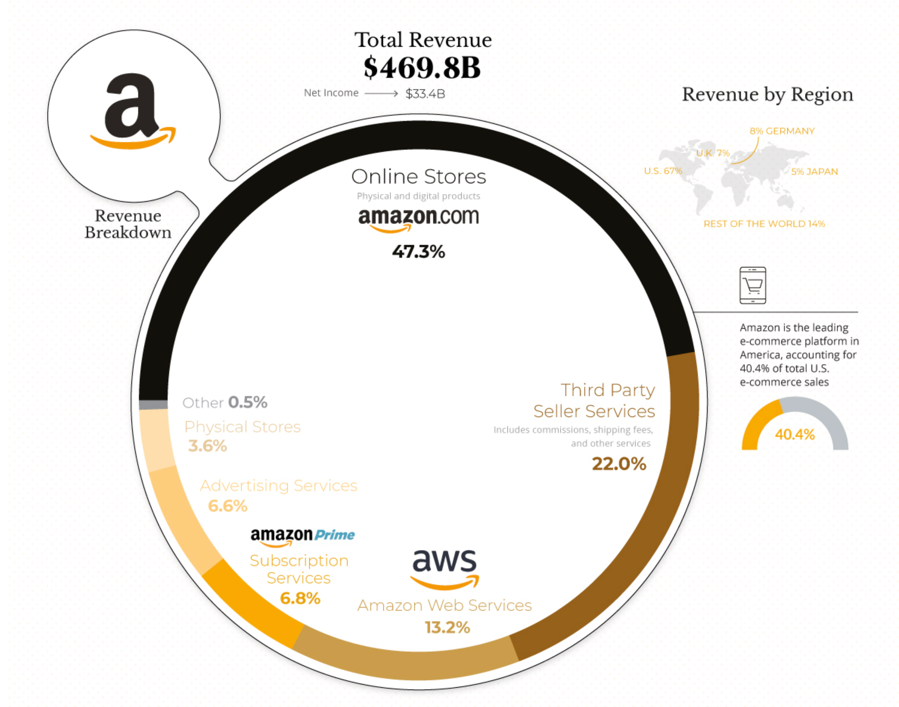
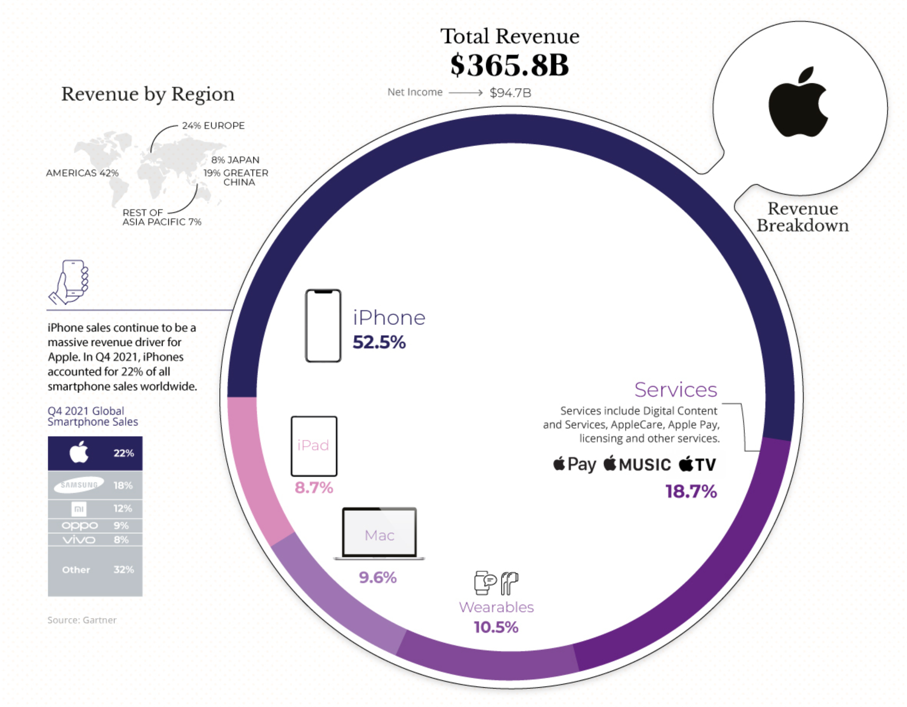
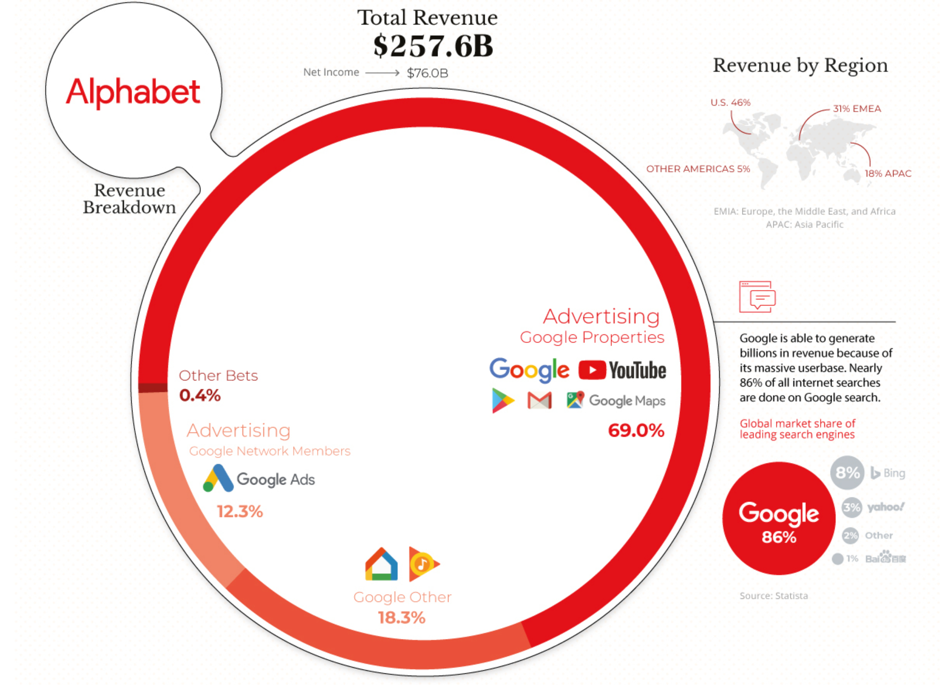
Apple, Microsoft, and Amazon are good examples of the first category. The likes of Meta (Facebook) and Alphabet align more closely with the second category.
Is growth here to stay though?
A number of large tech and other companies have benefitted from the coronavirus pandemic.
However, does that mean the best days of growth are over?
Arguably, the world is slowly returning to the so-called “normal”. However, that doesn’t mean these large tech companies are going away anytime soon. The market still wants and needs what they offer.
Indeed, some of the changes that have taken place over the last couple of years will likely stay with us. For example, the hybrid working situation with some businesses allowing staff to float between the office and at home looks permanent.
Sure, there are some businesses that outright refuse to participate in the hybrid model. Others, though, have adopted this model which looks to be a permanent way of doing things for them.
Another example is the growing trend in online global e-commerce sales. This is expected to grow steadily over the next several years and by some estimates, reach around US$7 trillion by 2025.
Let’s face it, whilst we’re not going to do everything online, if there is the opportunity to go online in the comfort of my own home, order an item of equipment and have it delivered, then I’ll go with that option rather than drive all the way into town. Then I have to load that item into my car, drive all the way home and then lug it from the car into the lounge or wherever it’s supposed to go.
Far easier to click, pay and open the door for the delivery guy.
Change is the only constant, as they say.
There are no guarantees that any of the aforementioned big tech companies will be as dominant in five or ten years’ time. In fact, when we look at history, we can see that those businesses that dominated, even for many years at a time, gradually see their dominance decline. Other businesses emerge, taking over the top spots.
By the way, that’s where the idea of buying and holding actually doesn’t make sense. Yes, we want to buy and hold on to a good business, but only if its economics remain competitive.
To be clear, at WISEplanning we don’t like the idea of moving money about to try and make money. We much prefer to let a good business do the heavy lifting. However, if it changes its spots, then it must be scaled back and eventually removed.
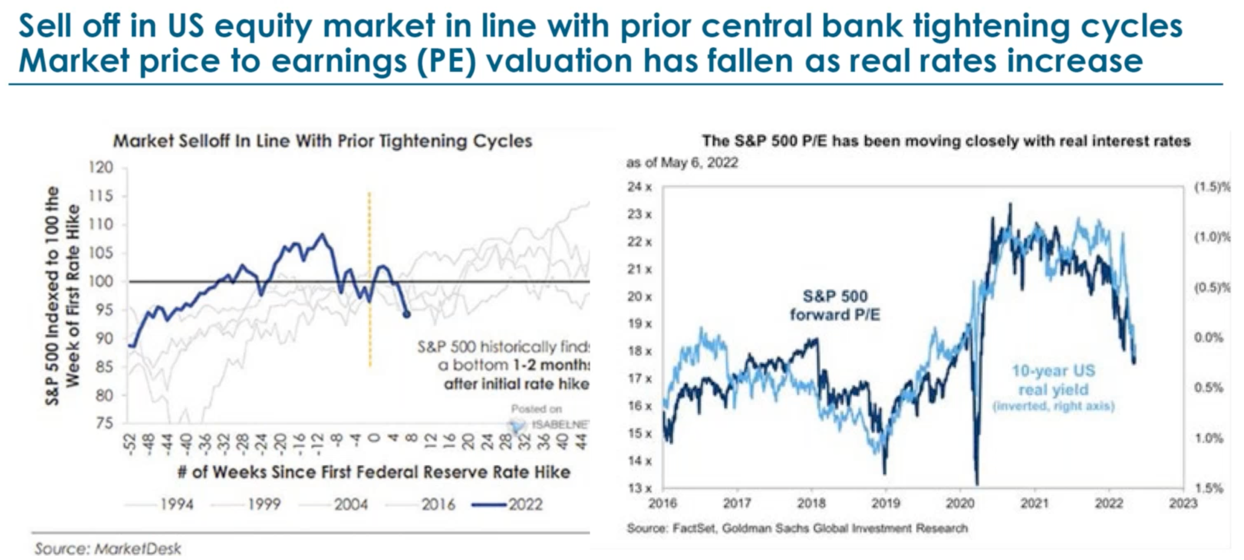
Put simply, the graph to the left shows the current sell down (the strong blue line) and compares it with the other sell downs (the other grey lines). The graph to the right showing the price-to-earnings ratio shows how the decline in the S&P 500 price-to-earnings ratio (left side axis) tracks the rise in interest rates (right side axis).
Simplifying it all, the current market sell-off is normal.
That’s what tends to happen when interest rates increase.
History shows that markets start looking ahead and can even start recovering within three months following the initial rate hike. The current series of rate hikes however, are perhaps more protracted than usual but nonetheless, markets are forward-looking and won’t wait around for things to look perfect before recovering.
Currently, we are seeing that price-to-earnings ratios have declined as interest rates have increased.
This means then that market pricing has been led by the bond market, at least up to this point. That may change in the future. If we look at the fear/worry gauge, we can see that the market, whilst it hasn’t capitulated, is nonetheless showing signs of real fear.
The sell down over 2022 has been quite sharp when compared to some others in the past.
So, what are the market trend drivers potentially?
This would be inflation data suggesting slowing inflation, economic growth slowing and the US Federal Reserve moderating the removal of liquidity from the system to suit market conditions.
In other words, if the US Fed sees economic slowdown as tipping towards a significant slowdown too quickly, then it may modify the pace of liquidity removal from the market. Liquidity removal, of course, is the opposite of quantitative easing, which has been going on since the global financial crisis (2008).
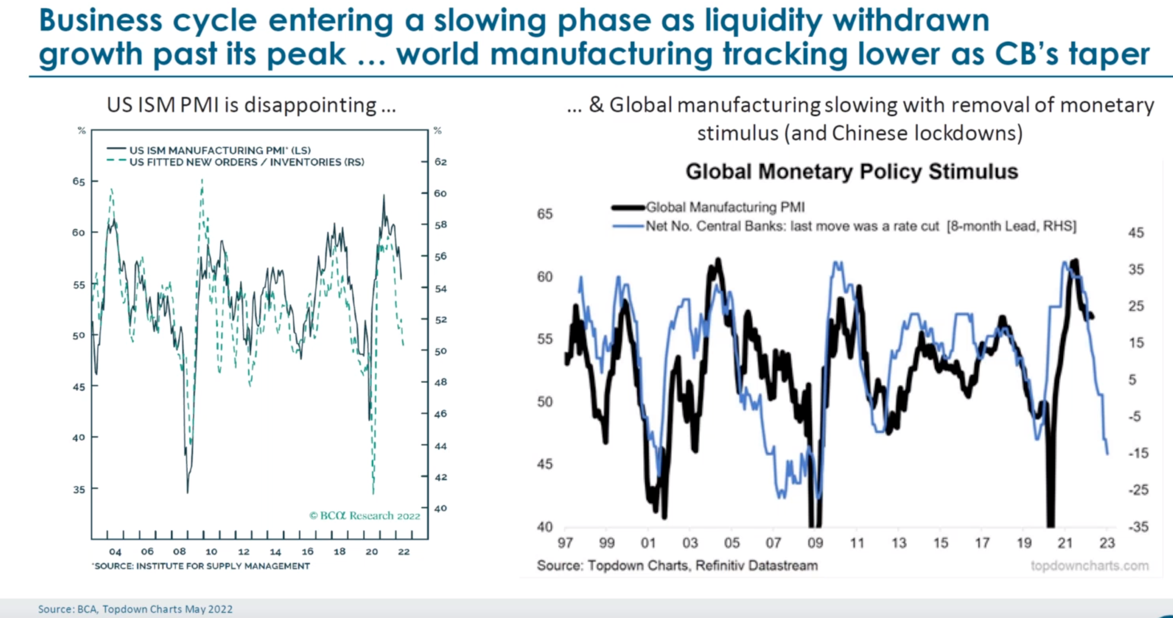
The graph on the left shows manufacturing indicators. The graph to the right shows global manufacturing slowing down as monetary stimulus is removed from the system.
Looking more closely at the graph to the left above, focusing on the thin black line, this tells us that the American institute of supply chain management indicator has peaked and is now slowing down. The thin black line in this graph refers to the left side axis.
Still, with the graph to the left, now looking at the green dotted line (refer to the right-side axis), we can see that global manufacturing appears to have peaked as well. This is also evidenced on the graph to the right with that thick black line trending down.
Where all this gets to, is that we are seeing the transition from a low inflation / low interest rate economy to a higher inflation / higher interest rate economy.
We know this because the fear gauge is riding high, turbulence and uncertainty are all over the market, and trading price corrections have taken place.
This is a normal process that is perhaps more amplified compared to other times in the past, given the excesses that exist and need rationalising.
Yes, it does feel uncomfortable for some. For others of course, it represents opportunity – where do you sit?
Anyway, what we are seeing is supply chain normalisation which may take a bit longer yet, with inflation levels moderating, but perhaps remaining somewhat high. This is all part of the transition.
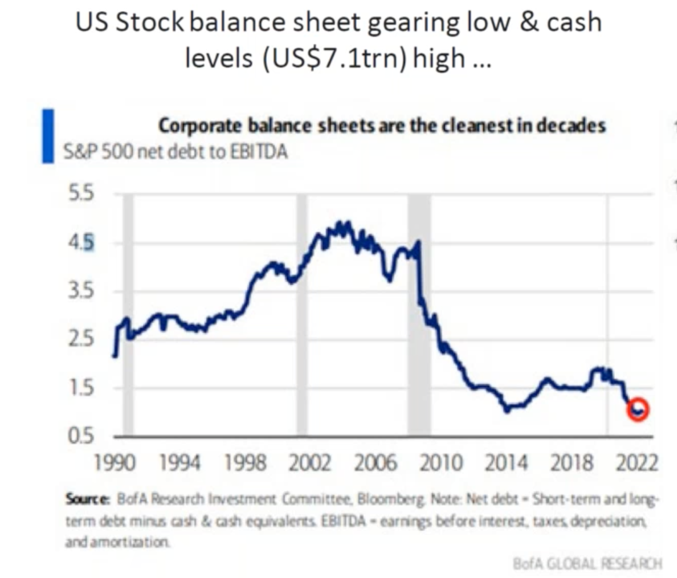
The above graph shows the level of corporate debt on American balance sheets.
As the above graph demonstrates, corporate debt levels are at 30-year lows, with circa US$7 trillion of cash sitting on those balance sheets (no doom and gloom here).
As you can imagine, this supports valuations and also future business growth.
Share buybacks may continue given this level of cash. Also, what is noteworthy is earnings announcements versus earnings expectations.
There are some notable exceptions. Any business that demonstrates the slightest hint of missing an expected topline or bottom-line result is severely punished by the market (sold down), instantly ( e.g. Walmart, Target).
That aside, you always hear about those spectacular result misses in the popular media but generally, earnings have been coming in either at or slightly above expectations. That’s a good thing (no doom and gloom here).
So, there’s been a lot of noise about how “bad” things are. Seriously, ignore that banter.
We are in transition.
As I outlined earlier, this is normal and business as usual as far as credit cycles, businesses and trading prices are concerned.
We will see slowing growth ahead, and that could even create some near term headwinds on profit reports versus expectations over the next month or two.
That would cause further trading price corrections for some businesses.
That said, recent price declines mean that much of the excess pricing has already been removed, with markets generally sitting somewhere around fair value. Any significant decline would take the markets into real value territory. See … it’s not all bad!
The Global Economy
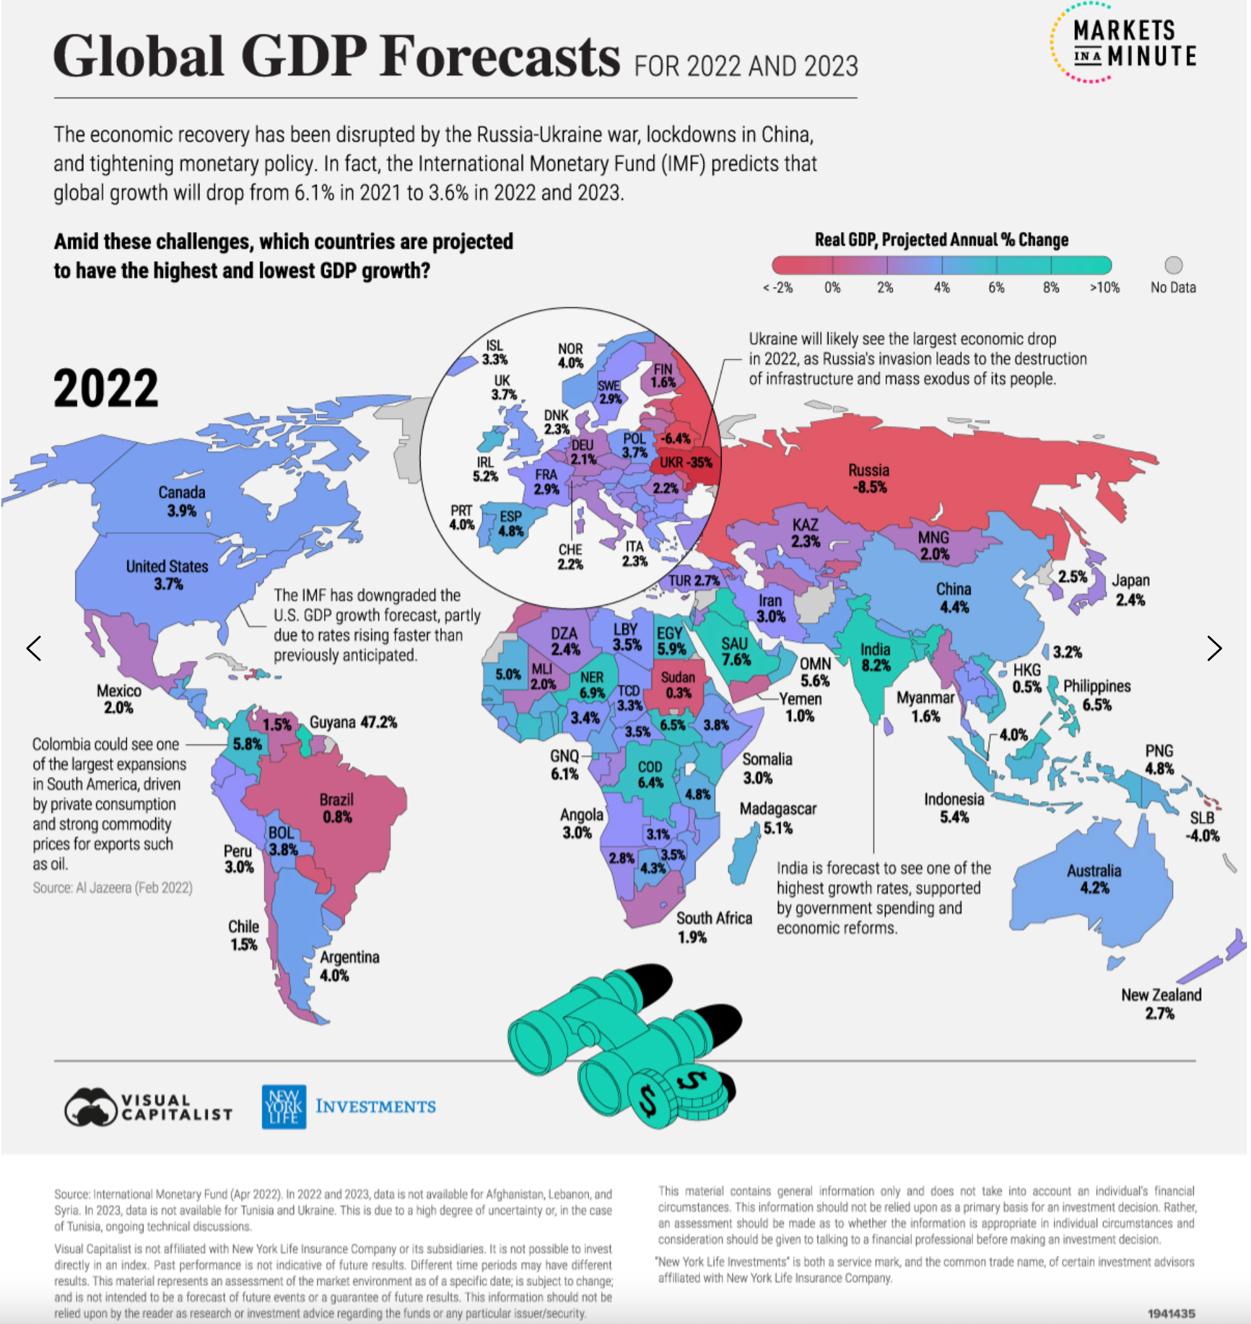
The above diagram shows the level of projected economic growth around the world.
Partly because of the Russia/Ukraine war, lockdowns in China along with their zero covid tolerance policy, and inflation, we have seen predictions of economic growth over the next couple of years reduced.
Nonetheless, economic growth may continue moving along at around 1.5% over the next couple of years. This is a projection based on what we know and of course, not a guarantee.
However, if you’ve been an investor for a number of years, you will have observed how markets and governments, in an ad hoc way, come together to keep the global economy ticking along. In short, economic growth continues.
Where recession emerges, this becomes part of the market and economic adjustment process – normal.
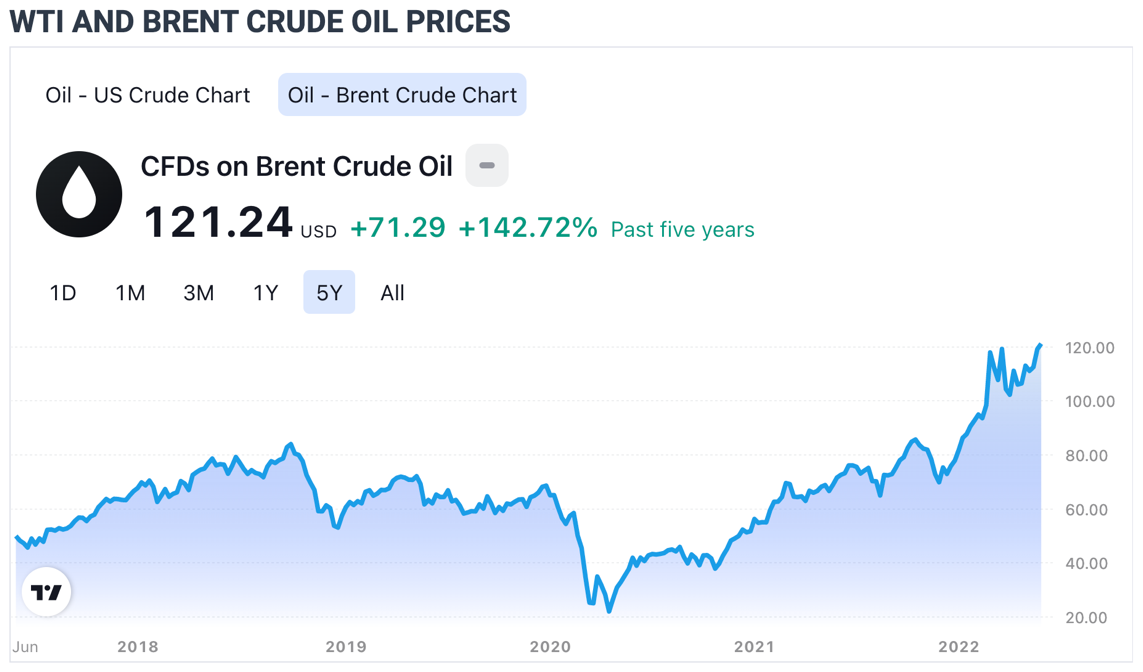
The above graph tracks the trading price of Brent crude oil over the last five years.
The price of oil continues to rise, driven by geopolitical conditions (Ukraine/Russia war). Recently, OPEC agreed to increase the production of oil for July and August this year. Despite sanctions, there remains some confusion as to where Russian oil fits into the mix.
Usually, an increase in the supply of this magnitude would ease crude oil prices, but with other OPEC member nations struggling to supply as much oil as needed, this increased level of productivity looks like a stretch for a number of contributing nations and may not be enough.
America has been contributing to the oil supply as well, although there are limitations as to what they can do too.
Perhaps another factor affecting crude oil prices worth mentioning is the Chinese slowdown.
They have maintained a lockdown position as they combat the coronavirus. This reduced the demand for oil somewhat. However, with those lockdowns being removed, this may increase demand for oil which again puts further pressure on oil prices. Indeed, oil prices may well be at a higher level now if it was not for the recent Chinese lockdowns.
So, with inflation spiking globally due to supply chain constraints, rising interest rates and rising oil prices, there is an increasing possibility that the global economy could slide into recession.
I’m not predicting it. Even if it does occur, as I’ve mentioned elsewhere, technically a recession is defined as two consecutive quarters of negative economic growth. That is a very long way from economic depression (soup kitchens, 25% unemployment etc).
Recession is possible, although not imminent at this point in time.
To be clear, the market won’t like it. However, it is actually just part of the transition process as the global economy moves through to the next phase of inflation and interest rate normalisation and as supply chain constraints moderate.
The reality is that this process won’t fit into a calendar timeline that you and I might prefer. However, it is part of the transition … part of the process. It will progress at a pace that fits market conditions. You and I can choose to be patient – or not.
The United States of America
Interest Rates – USA
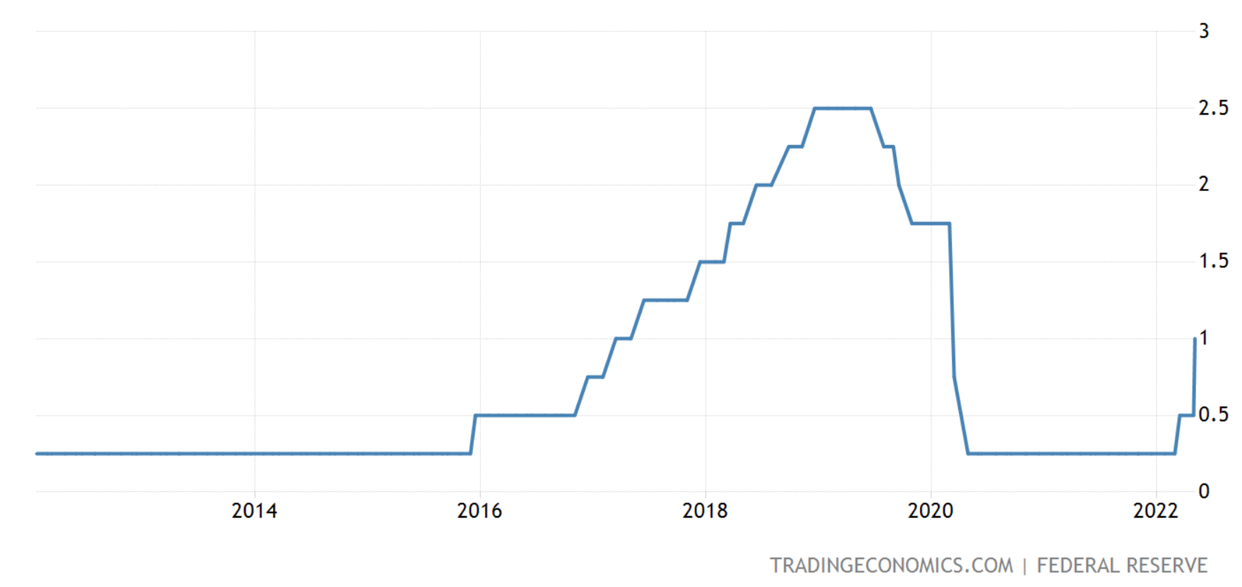
The above graph tracks the US Federal Reserve target funds rate.
Interest rates have been rising in the United States of America.
There are a number of rate hikes scheduled by the US Federal Reserve over 2022, with my focus now on the upcoming rate hike this month (June) and the July rate hike as well.
Both are looking like being 50 basis points each which means a 1% increase in interest rates over two months. That is quite a lot when you consider the level of interest rates at the moment.
Some commentators suggest that the markets have already built-in the increased levels of interest rates because it’s already been telegraphed. This might be true, although I remain cautious because it may well be that some participants across the market might take a different view of interest pain, once it actually takes place.
As well, interest rates remain accommodative. They are low when compared to long-term interest rate levels.
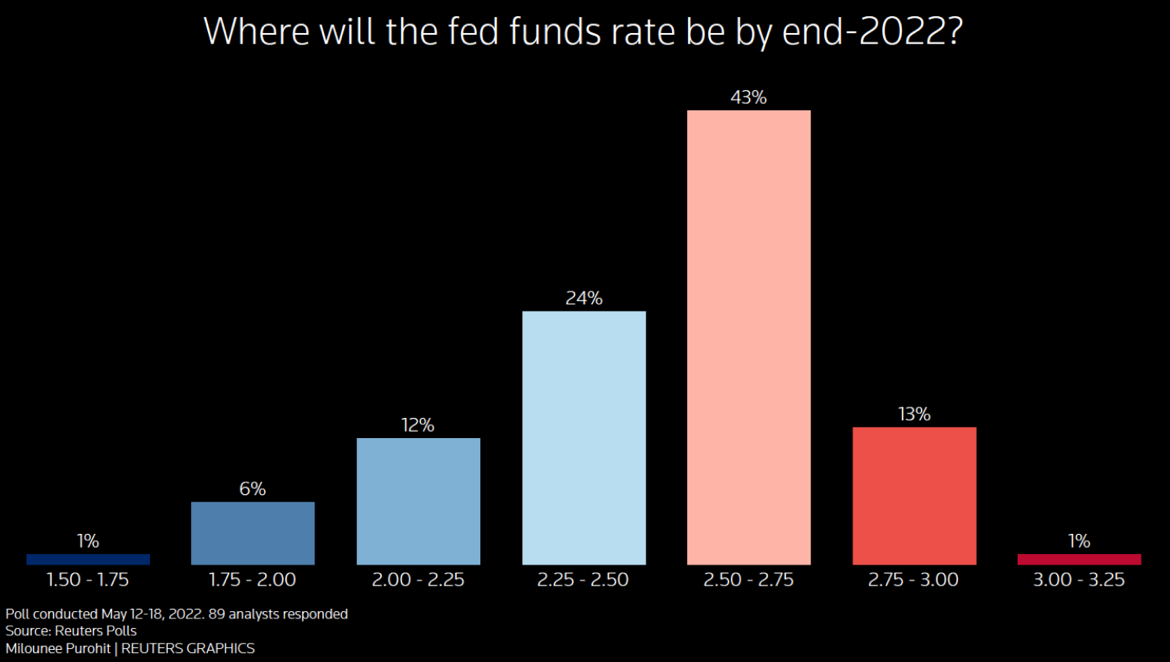
The above graph is a poll that gauges the consensus view about the outlook for monetary policy.
The real question is how high-interest rates will need to rise to head off inflation?
It’s difficult to say for sure. However, what we know is that the US Fed has said they’ll keep going as long as needed, but will modify the pace of rate hikes and even stop if need be.
For us as investors, this suggests that further volatility may lie ahead. However, we are getting closer to the point where a pricing recovery of some description is possible. It could take the form of markets tracking sideways for quite some time or trending up slowly and very subtly. Bear market rallies aside (short term bull market spikes), markets will not decline forever.
Inflation has been forecast to average 7.1% this year and remain above the US Fed’s target until 2024 (or possibly longer). That suggests sticky inflation.
Meanwhile, one poll showed a median 40% probability of a recession in the US over the next two years with a 25% chance of that happening in the coming year. Equity markets of course, are not enjoying this type of environment and remain volatile ( a good thing (better buy prices) – yes?).
Unemployment – USA
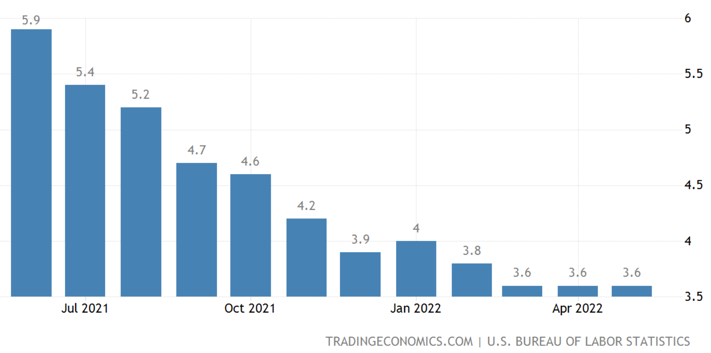
Wages Growth
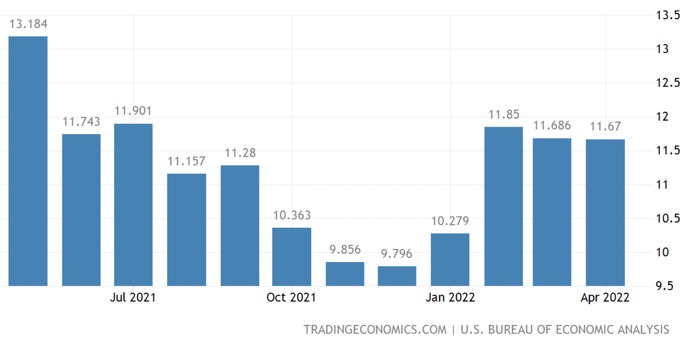
The graph to the left tracks the unemployment rate in America. The graph on the right tracks wages growth in America.
We can see that unemployment is at historically low levels, and we know that wage growth has increased, as you can see from the graph to the right above.
Indeed, many have been looking for wage growth over the last few years and were wondering when it was going to finally turn up – it is here.
There’s every possibility that what we are seeing now is only the beginning. What this leads to is the so-called sticky inflation, which is of a more permanent nature and could mean that interest rates need to go that bit higher in order to slow inflation and inflation drivers such as wages growth in the future.
So, it is a balance between heading off inflation, (too much inflation is not good) and not getting too carried away with interest rate rises so that America slips into a deep recession. That scenario looks unlikely at this time.
Anyway, the Fed has stated that they will moderate interest rate hikes if need be.
I know that there’s plenty of volatility across the markets currently. However, steady as we go right now.
It will be interesting to see how it plays out over the next two scheduled rate hikes in June and July.
China
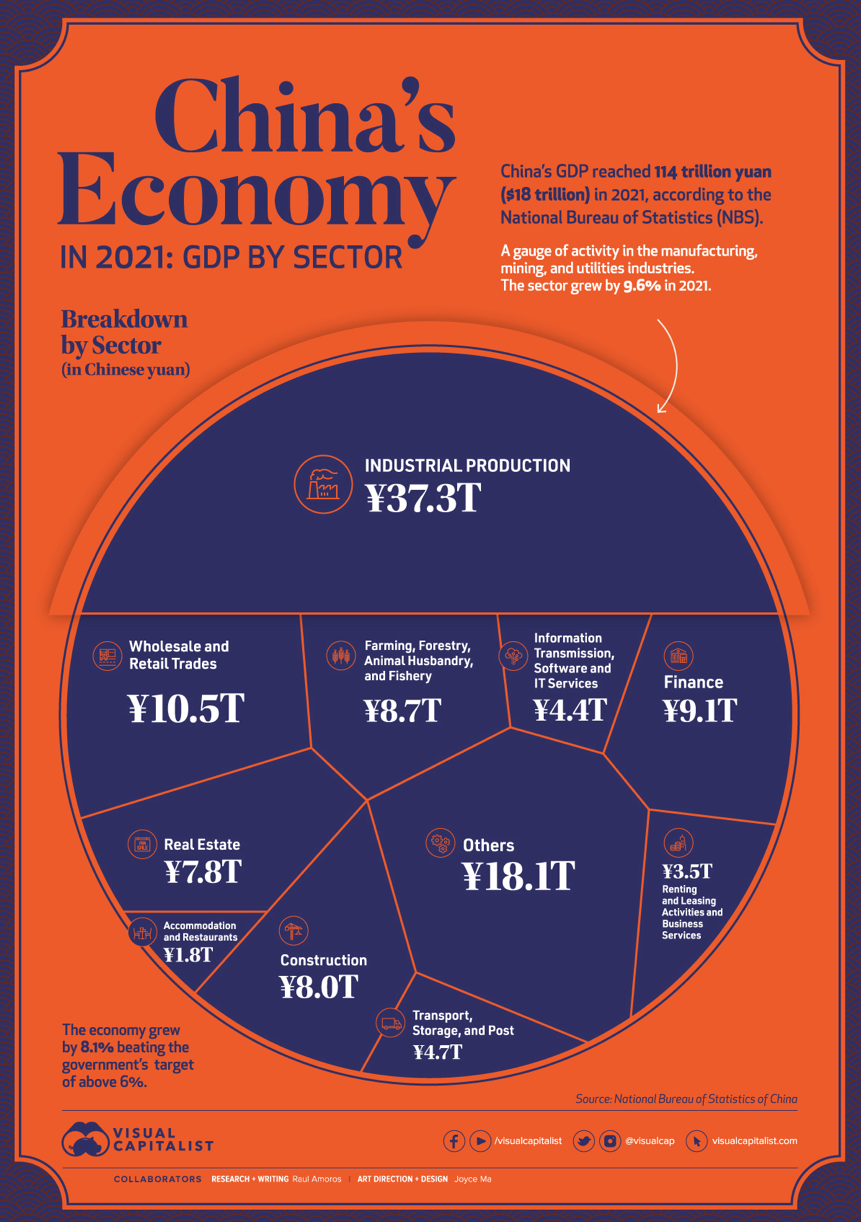
China’s economy is the second-largest in the world and has grown strongly compared to other more developed economies. The lockdown of two major cities over the last couple of months will likely see a real dent in economic activity, as the data emerges over the next couple of months. Potentially, it may look a bit grim. However, it’s temporary.
China, big picture, is looking to remove its reliance on America and Western nations for trade, but that’s many years off into the future. China is also looking to reduce its reliance on manufacturing, but again that is well into the future.
What we know about the Chinese economy is that it is managed with an iron grip by the Chinese government. As we’ve seen, they do whatever it takes to keep the economy on track.
Geopolitical difficulties (the US, Australia) continue to emerge, although at this stage, there have been no serious consequences thus far.
Interestingly, Joe Biden warned that America would retaliate against China militarily if they move on Taiwan. It sounds as though that may have been a step too far (?). However, it is a contingent risk that sits to one side that may or may not ever be something for us to be concerned about.
Interestingly, with the distraction of the Russia/Ukraine war going on, in some ways, now would not be a bad time for China to swoop on Taiwan! Unlikely.
I’m looking for information to gauge how the recent lockdowns in China and the slowdown of the Chinese economy flows across to the global economy. It will be temporary but is something that could bother the markets near term if it’s large enough.
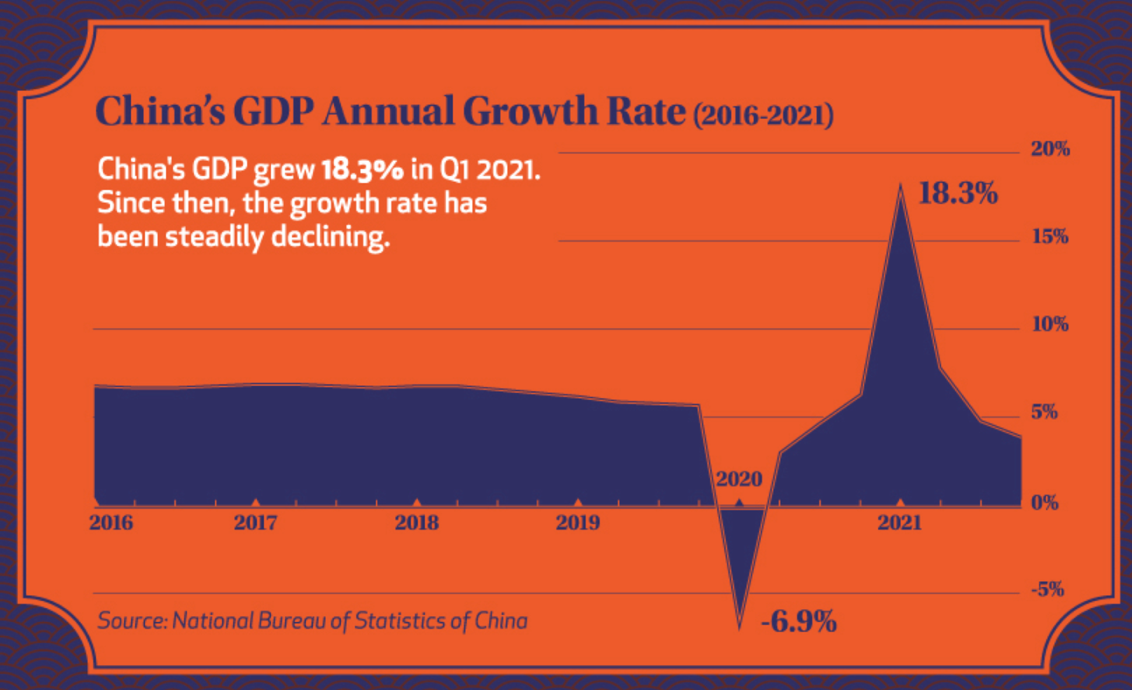
The above graph tracks economic growth in China.
The above graph clearly shows the impact of the coronavirus. The Chinese government takes whatever action it thinks achieves its goals, as can be seen by the sharp decline in economic activity in 2020 (as they locked much of the country down).
It will be interesting to see how the recent lockdowns have impacted economic growth in China. It could be quite significant, although it is temporary. The impact on the global economy therefore, is likely to be limited.
Manufacturing PMI – China
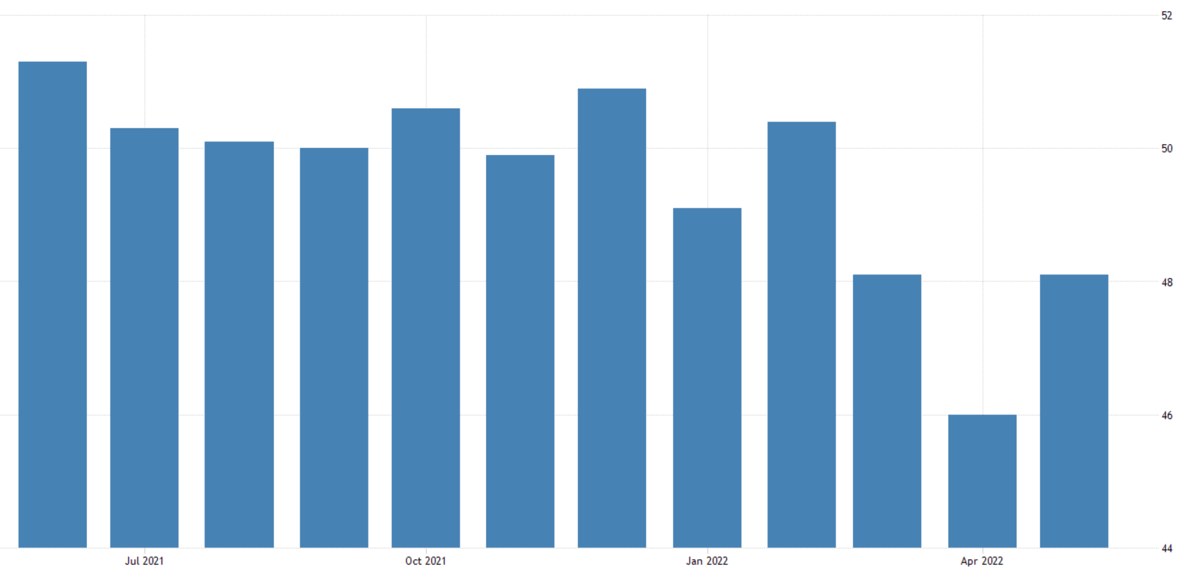
The above graph tracks manufacturing in China.
This is considered a leading indicator showing whether manufacturing activity is increasing or declining. A reading above 50 suggests increasing activity, whereas a reading below 50 suggests slowing activity.
As we can see, the May reading came out at 49.1, which is up from the April 26th month-low of 46.0.
This reading might look better if it weren’t for those recent lockdowns. Understandably, we are seeing new orders declining, although at a moderated rate, amid ongoing declines in both export orders and employment.
Companies are continuing to streamline stock levels and delivery times continue to lengthen quite sharply due to the recent travel curbs and lockdowns.
Sentiment measures show a further weakening to a five-month low due to the concerns over how long the restrictions might continue, along with concerns around the Ukraine war. I would expect sentiment to improve somewhat, given those restrictions are being lifted.
China is by some measures, the second-largest economy in the world and is very important to the global economy and global stability. The good news from a trading perspective currently is that, whilst China is not necessarily a friend of the West, it relies significantly on trade with the US and other Western nations, even as it strives to reduce that dependency.
The other bit of good news is that the Chinese Communist Party that rule, govern China’s economy with an iron grip and is very focused on stability and prosperity. That is good for the global economy.
Europe
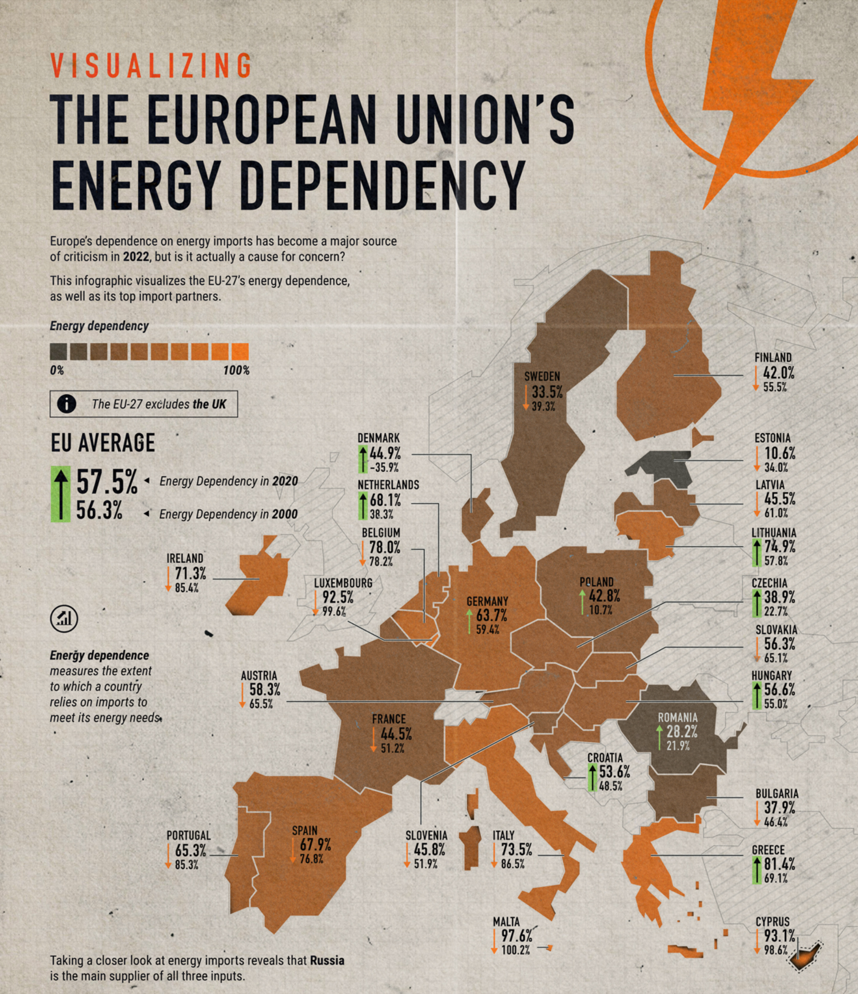
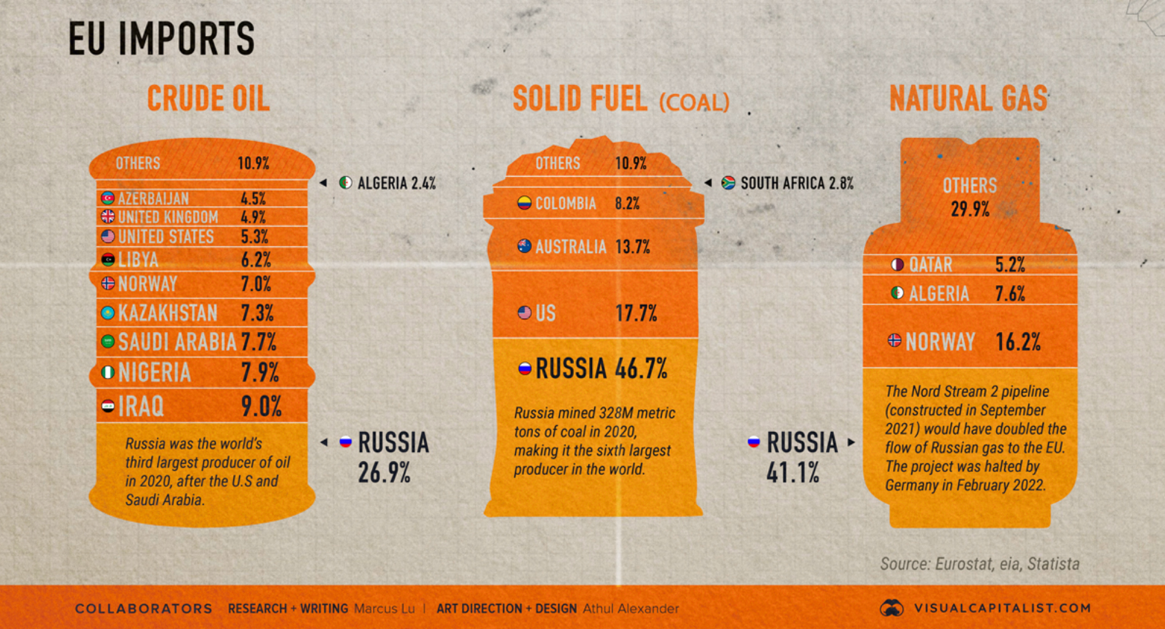
The above diagram outlines each country’s dependency with regard to crude oil, solid fuel and natural gas.
Europe’s economy continues to struggle along (nothing new). Now, of course, we have the destabilising impacts and the uncertainty surrounding the Ukraine/Russia war. What makes this all the more interesting is the fact that Russia is the third-largest oil producer behind the US and Saudi Arabia.
Europe’s oil dependency actually hasn’t increased that much over the last 20 years, rising from 56.3% to 57.5%. However, the situation has now changed and they are looking elsewhere, away from Russia for other alternative sources of energy.
As a result of sanctions against Russia, ironically the price of gas has spiked, making things more difficult for Europeans and ironically meaning that Russia gets paid a bit more for what it produces. Interestingly, recent proposals for alternative energy sources excluded nuclear power, which remains a polarising topic across Europe.
Economic Growth – European Union
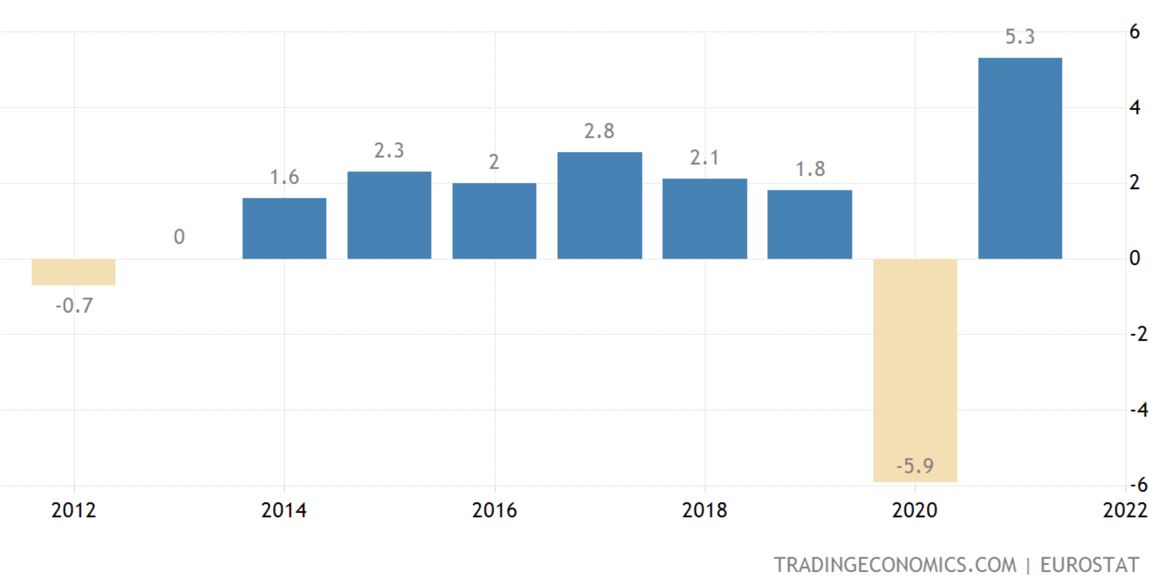
The above graph tracks economic growth across the European Union.
The most recent results look good, although of course, as you can see from the graph above, it is making up for lost ground as a result of the coronavirus.
In short, the European economy is reasonably stable but continues to struggle to generate a meaningful level of economic growth. That said, the growth that they have achieved is not deflation!
New Zealand
Mortgage Interest Rates – New Zealand
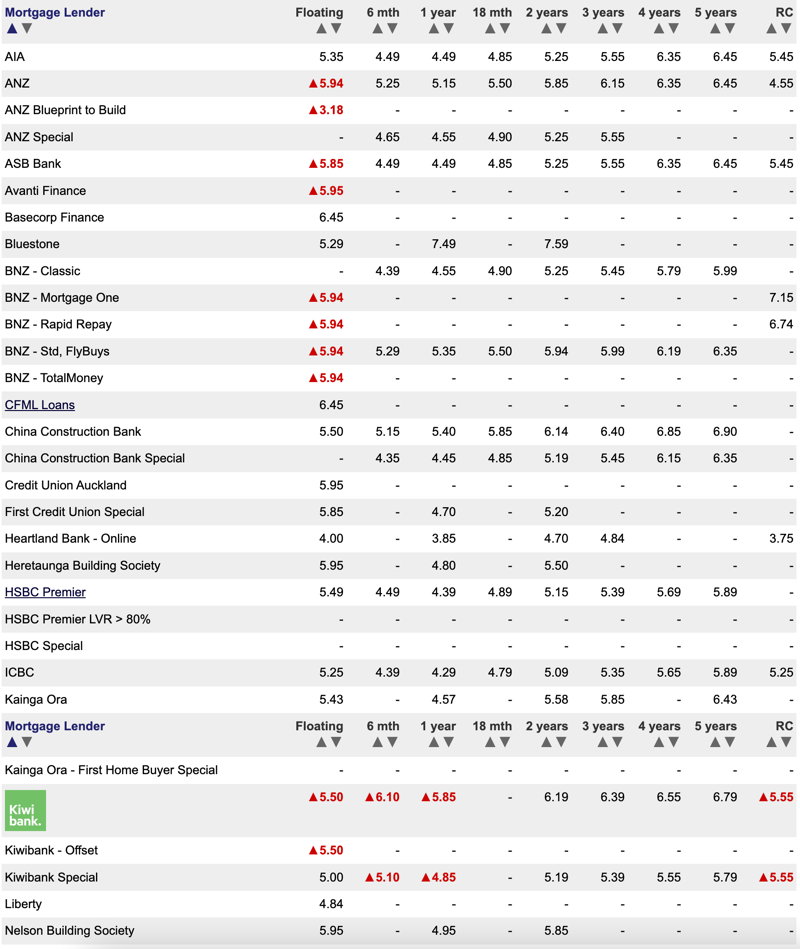
The above table shows mortgage interest rates as of the beginning of June 2022.
Term Deposits – New Zealand
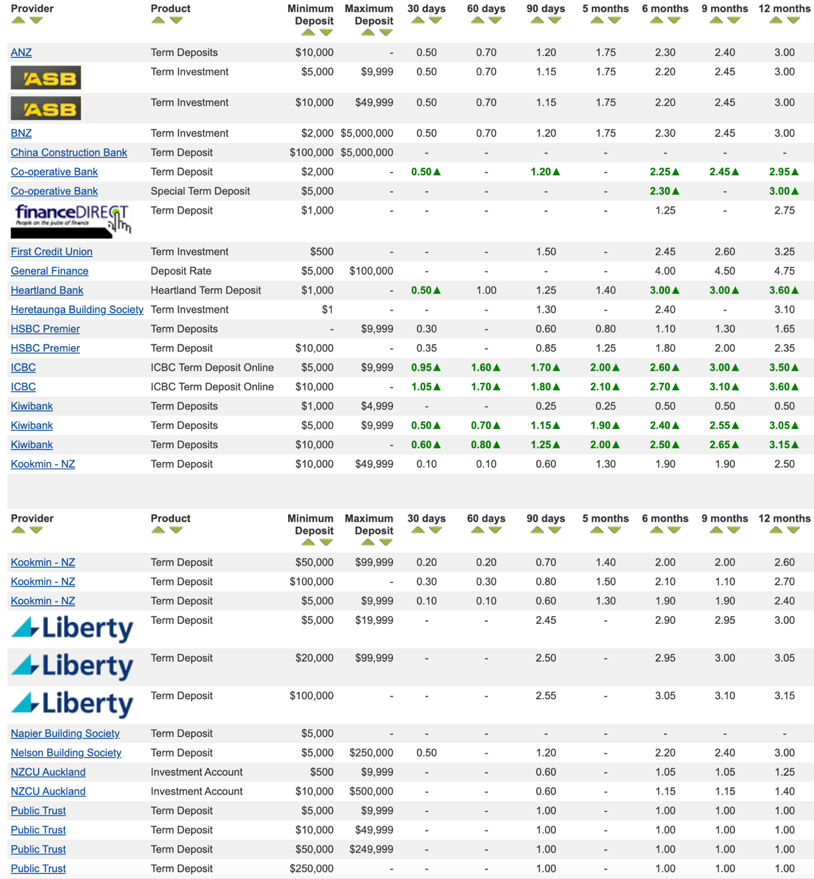
Term deposit rates in New Zealand as of the beginning of June 2022.
Interest rates are on the rise in New Zealand. Adrian Orr, the governor of The New Zealand Reserve Bank, has said that he is committed to raising interest rates, hard and fast if need be.
The most recent interest rate increase was at 50 basis points (half of a per cent), and it looks as though the next one might be another 50 basis point rise as well.
Fixed mortgage interest rates have jumped between 2-3% as the rapid monetary policy tightening by the New Zealand Reserve Bank gets underway.
With inflation rising in New Zealand, this makes it more difficult still for those not on the property ladder to get on board. The Credit Contracts and Consumer Finance Act is now very stringent so that a number of would-be borrowers can now no longer obtain finance easily. For some, bank borrowing is no longer an option.
In short, the credit cycle shift (nothing new here) is well and truly underway, and there’s no going back.
Looking forward, some estimates suggest that the interest rate increase cycle could actually peak sometime this year or in 2023. Inflation is a key indicator to watch in this regard.
Inflation – New Zealand
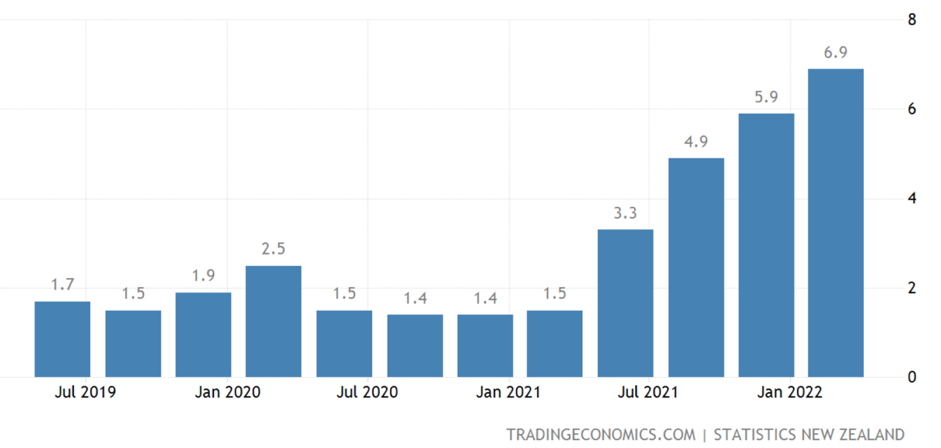
The above graph tracks the inflation rate in New Zealand.
Inflation continues to rise, caught up in both New Zealand and international drivers of rising costs.
This is a key indicator to watch.
Once there are signs that inflation has been curtailed to some degree, then we will look for comments from Adrian Orr (governor of the New Zealand Reserve Bank) regarding future interest rate hikes.
We will likely see at some stage, comments around more modest rate hikes, and eventually, rate hikes will become few and far between to the point where inflation is stabilized.
Interest rates will also stabilise, likely at higher levels than the previous 20 – 30 years.
Some of those inflation drivers are variable and will dissipate. Others though, like wages costs, are sticky and of a more permanent nature. I will keep you posted.
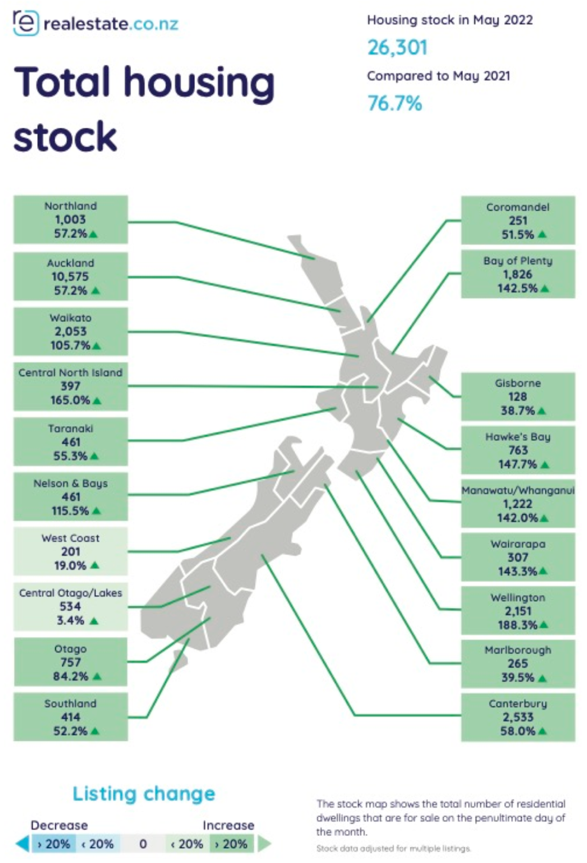
The above table highlights increasing housing inventory available across New Zealand.
Based on the law of supply and demand, an increasing number of houses available will mean that house prices will decline. It would appear that house prices have generally declined by around 6%. When we think about projections of somewhere between 12-15%, we are almost halfway there by that measure.
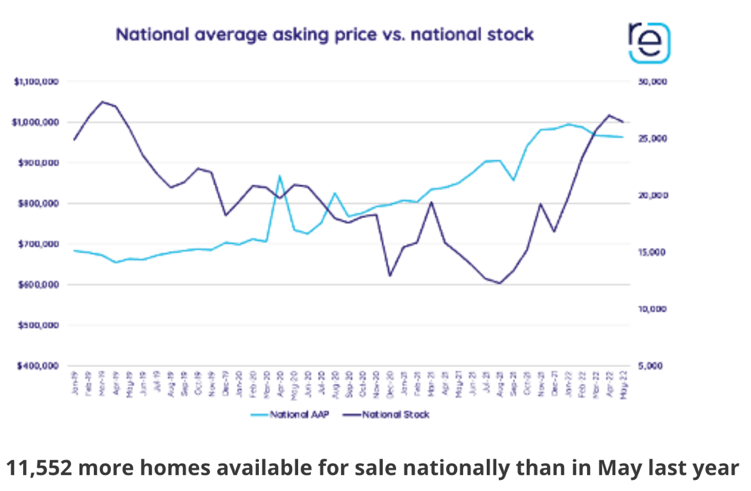
The above graph tracks the national average asking price compared to the level of housing.
Obviously, rising interest rates will have a dampening effect on property prices. It will be interesting to see the impact of the new housing intensification environment, thanks to the recent RMA Amendment Act. Basically, it means considerably more intensification in major cities, which in theory may have some impact on levels of property prices.
It is becoming more and more a buyers market for first home buyers, mums and dads looking for a home for an expanding family and for property investors.
Although it varies across the country, year on year stock levels have increased significantly in the likes of the central North Island (up 168%), Hawke’s Bay (up 148%), Wairarapa (up 148%), and the Bay of Plenty (up 148%).
It will be interesting to see in say, six months from now whether seasonal factors such as the battening down of the hatches over winter have any impact as it dissipates leading into the summer months.
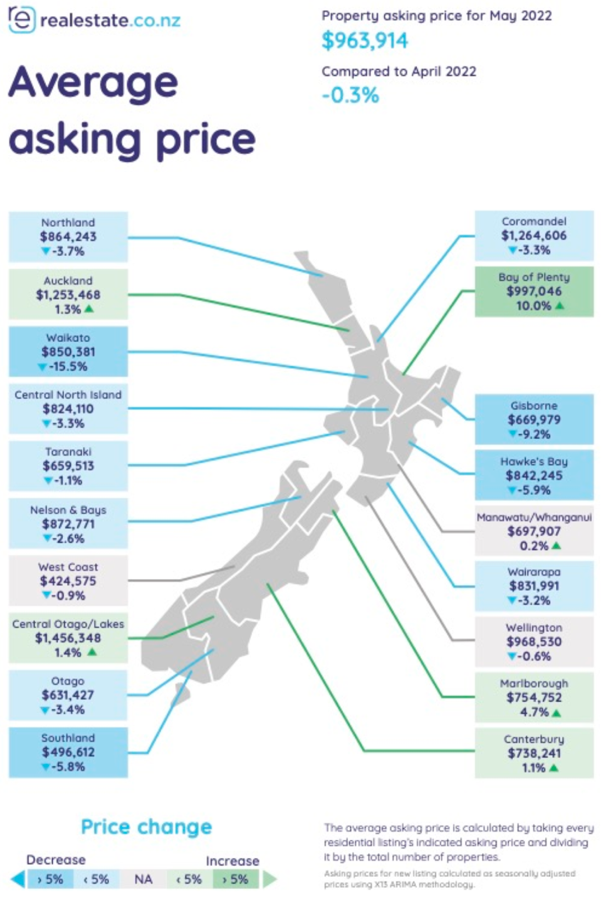
The above diagram tracks the average asking price across various regions in New Zealand.
Notably, prices are moderating, but Canterbury continues to show pricing increases as it catches up with the rest of the country. Bay of Plenty remains strong and Auckland holds its own as well from a price increase perspective.
Although anything is possible, it remains difficult to see a housing price ‘crash’. What is more likely is moderation in prices towards more realistic levels, but even then, I suspect housing prices across New Zealand will remain expensive by any fundamental measure. Kiwis love their property!
New Zealand is actually tracking okay all things considered, although the impacts of inflation have yet to be felt. Steady as we go for now.
To Summarise…
Despite the uncertainty, the global economy continues to grow, albeit at a lower price than was previously projected. Still, 2.5% global economic growth is not too bad.
All eyes are on spiking inflation and rising interest rates as central banks raise interest rates to head off the damaging impact of excess inflation around the world.
The Ukraine/Russia war continues and could well continue for a lengthy period of time. The cost of energy has spiked, which is not making it easy for European nations as they battle inflation caused by supply-chain constraints and in the future, probably more sticky inflation drivers such as wages growth.
Although this is further into the future, I will be watching for indications about unemployment levels rising, which signals an economy’s capacity to sustain increasing wages costs. In short, layoffs and redundancies will be a sure sign that we’ve reached that point where ongoing increases in wages are hurting. That would help slow inflation too.
Here in New Zealand, Adrian Orr, the New Zealand Reserve Bank governor, is raising rates hard and fast and will do so, he says, until it’s no longer needed. This suggests that there could be perhaps an early peak (compared to other countries) in the increase in interest rates that could take place this year or at some point in 2023.
Property prices tend to be a lagging indicator and may well languish for the rest of 2022 and across 2023. Although beyond that, it becomes murky. It could be 2024, 2025 or later before residential property prices return to growth mode. Interest rates and immigration are two key indicators / drivers to keep an eye on.
Despite the uncertainties and creative use of the English language by some commentators around ‘economic hurricanes’ coming and catastrophic levels of debt etc. etc. etc., the global economy is actually doing what it always does.
That is to navigate the ongoing credit cycle shift. Nothing new here.
But isn’t it different this time?
The cycle might be elongated compared to some previous cycles, although I struggle to see why what we have at the moment is measurably different from what we’ve seen many times in the past – do you think it’s different?