Markets Reach All Time Highs, But What About Inflation?
Monthly Market and Economic Update – July 2021

Peter Flannery Financial Adviser CFP
“If you have one economist on your team,
it’s likely that you have one more than you’ll need.”
Warren Buffett
Key Points:
- US markets are at all time highs.
- Can markets keep rising?
- Is inflation transitory?
- How would you handle a significant market correction?
- Will you need to?
THE MARKETS
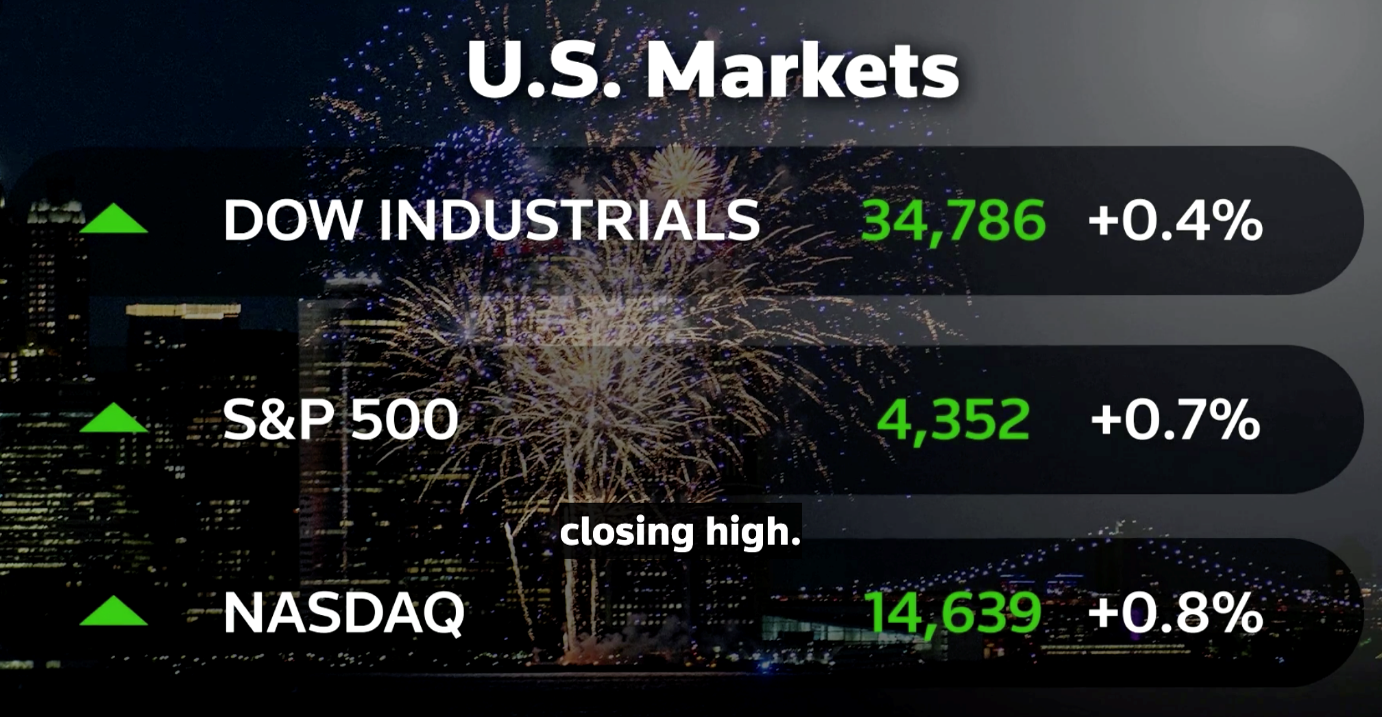
The above image captures share market indexes across the US at record-breaking highs.
Markets boom.
As they say, in share market parlance, “the bulls are in charge”. So, what does this mean for investors?
Market prices generally have been expensive for a number of years and so this is nothing new. The real question though is whether or not we are heading for a significant pricing correction because markets have reached all-time highs?
It’s always difficult to predict market corrections because they erupt quickly based on information that emerges at any point. Just because markets are at all-time highs does not necessarily mean that automatically there will be a correction. That said, they often go hand-in-hand which is only logical when you think about it.
Whilst markets are generally expensive overall, there are what some refer to as “value pockets” in the US market and other markets (e.g., banking, health care, hospitality…) and you’ve heard probably in the last 12 months about the so-called “rotation”. This is the line of thinking around the market moving out of expensive large tech companies into some of those other ‘value’ areas where stock prices have been beaten down for some time and may look to rise as the economy emerges from the depths of the COVID-19 pandemic recession.
Although I would not argue against the general idea that tech companies remain favoured and have been for some time. Also, the fact that those sectors whose trading prices have remained low and represent value is possible. I’m less convinced however about the markets’ notion of everyone rotating out of expensive tech stocks into value stocks.
It’s important perhaps to remember that there are a lot of different players in the market. Many are playing a different game. Certainly, almost without exception, most are playing a different game to you and I as value / eco-Investors.
You might wonder about that statement when you often hear about value-investing in the popular media.
The point here of course is that when we look at the definition of the markets’ idea of value, it generally refers to ‘cheap stocks’ which, simplistically are those stock prices or sectors whose trading prices have been low for quite some time.
At WISEplanning, we have a different definition which generally is based around the combination of the financials and the underlying economics of the business. As you know, that’s because we invest in the business rather than play the share market, which ostensibly is what other players across the markets are doing when they exclude the economics of the business or factor it into their analysis in a minor, inconsequential way.
So, where is that market correction anyway!?
The recent job number report out of the US is currently the main reason the image at the top of this page exists – at the moment anyway. It is possible at this stage that a market correction could be based on the market’s perception of when interest rates might rise.
As you know, market prices are determined by market sentiment and that’s the reason prices move up, down, sideways, and all over the place – random.
At the moment (and this can change for any reason at any point in time), the market is very focused on the US job number, the inflation number, and therefore when interest rates will rise.
The general consensus is that there won’t be an interest rate rise over 2021 and over 2022 although the 2022 idea does seem interesting.
Anyway, the point is that once the market senses a signal that interest rates will rise, I would expect some sort of response by the market by way of selling down, even if the actual rise in interest rates is someway off into the future.
One would expect a small and gradual interest rate hike. We then may see notable but moderate volatility.
A sudden, unexpected and sharp increase in inflation therefore means a potential increase in interest rates and would likely see a significant and sharp decline in market prices.
So why don’t we increase levels of cash and wait for the moment?
Certainly, this and other factors are taken into account when I’m considering making recommendations or indeed managing other assets. The reality is that investing long-term is a far more important decision than trying to second guess market movements. I’m not suggesting we ignore it.
I am suggesting though that we take a considerable amount of care around how we weight that decision around cash levels. It’s tricky.
My experience suggests that over time, keeping transactions to a minimum generally works best.
No, I don’t mean sit on our hands doing nothing and hoping for the best long-term. I do mean careful value judgments around a variety of decisions that all come together to create each and every portfolio adjustment. It needs to be well thought through and definitely looking beyond the current market noise / hype.
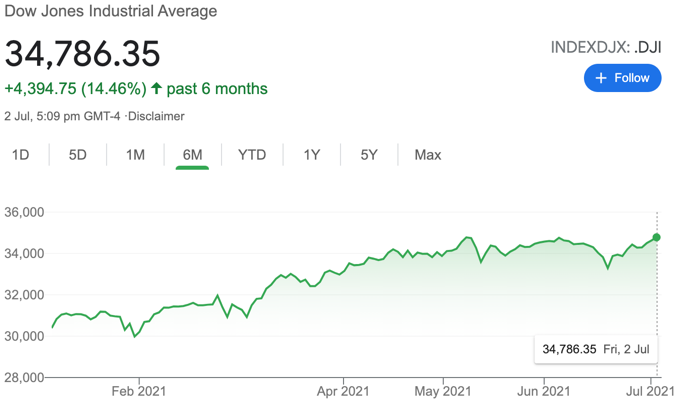
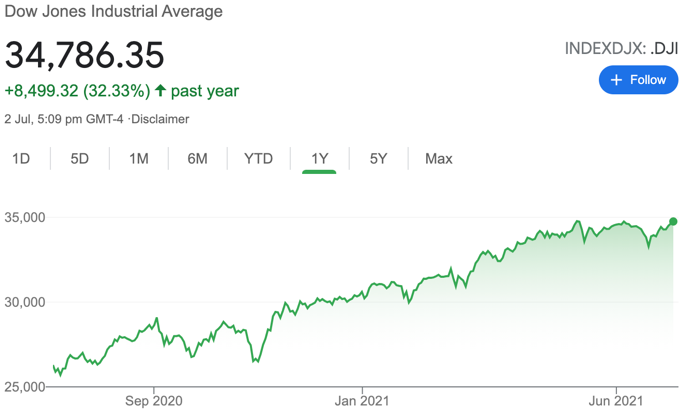
The chart on the left shows the US share market (the Dow Jones) over the last six months. The
chart on the right shows the US share market (the Dow Jones) over the last year.
As the image at the top shows, the US market hit the ‘trifecta’ with the Dow Jones Industrials, the S&P500 and the NASDAQ all at a record-high on Friday, 2nd of July – a very nice segue into July 4th for 2021.
As I mentioned earlier, the main reason for the current all time market highs is the better-than-expected job data coming from America’s Labour department showing that non-farm payrolls increased by 850,000 jobs over June. Still, that total is 6.8 million below its peak in February 2020.
The market appears to have taken this to mean that on the job front at least, things are good but not that hot that the US Federal Reserve needs to talk about raising interest rates just yet.

The above diagram shows the performance of various share markets across the world and different asset classes during periods of rising inflation and falling inflation. US Sh means US Shares, LPT means Listed Property Trusts, US TB means US Treasury Bills. PM means Precious Metals (gold, silver, etc.)
Although I wouldn’t base my methodology on whether or not inflation rises or falls and what one chart suggests, the above diagram is an interesting read but general in nature. Simply, it suggests that direct shares may perform better from a trading price perspective during periods of falling inflation when compared to rising inflation.
So, you might be thinking if we’re heading into a period of rising inflation, doesn’t this mean that we should scale back or sell all of our shares and invest in something else?
No.
Fortunately for us, our methodology is somewhat agnostic with regards to market cycles. Sure, the trading price will be affected in the short term however longer-term it is the quality of the underlying business that determines how much money we make (not the market cycle or the trading price movement in the short term).
Disruption
Disruption is all around us. One of the most prolific disruptors is the well-known Amazon but there are many others too. For example, PayPal is well-known for its online payment system but is perhaps less well-known for its innovative and disruptive ecosystem that has been developed that will challenge traditional legacy payment models and systems that currently exist in a traditional banking system.
For us as investors, there is definitely some opportunity in this space. At the same time of course, it’s not as simple as just picking a few stocks and throwing some money at them. Sure, that might even work for a time and perhaps even look good compared to other options. It doesn’t change the fact though that the quality of the business in the end is what determines how much money we make rather than the logical sounding narrative on steroids, convincing the gullible that this is a sure thing.
The markets have a habit of punishing the uninitiated when making investment decisions based on flimsy ideas that sometimes work, but more often become problematic.
I’m not so sure about you however, I prefer some meaningful certainty and reliability around my decision-making process, where and how to invest rather than speculating and hoping the noise across the market carries the trading price even higher still. Sometimes, the fundamentals catch up to support the trading price. More often than not though, that is not the case.
In case you’re wondering, I am looking in this space for worthy options that I can recommend although I don’t feel pressured to just come up with something because markets are excited.
The Global Economy
A. Global growth B. Share of global growth
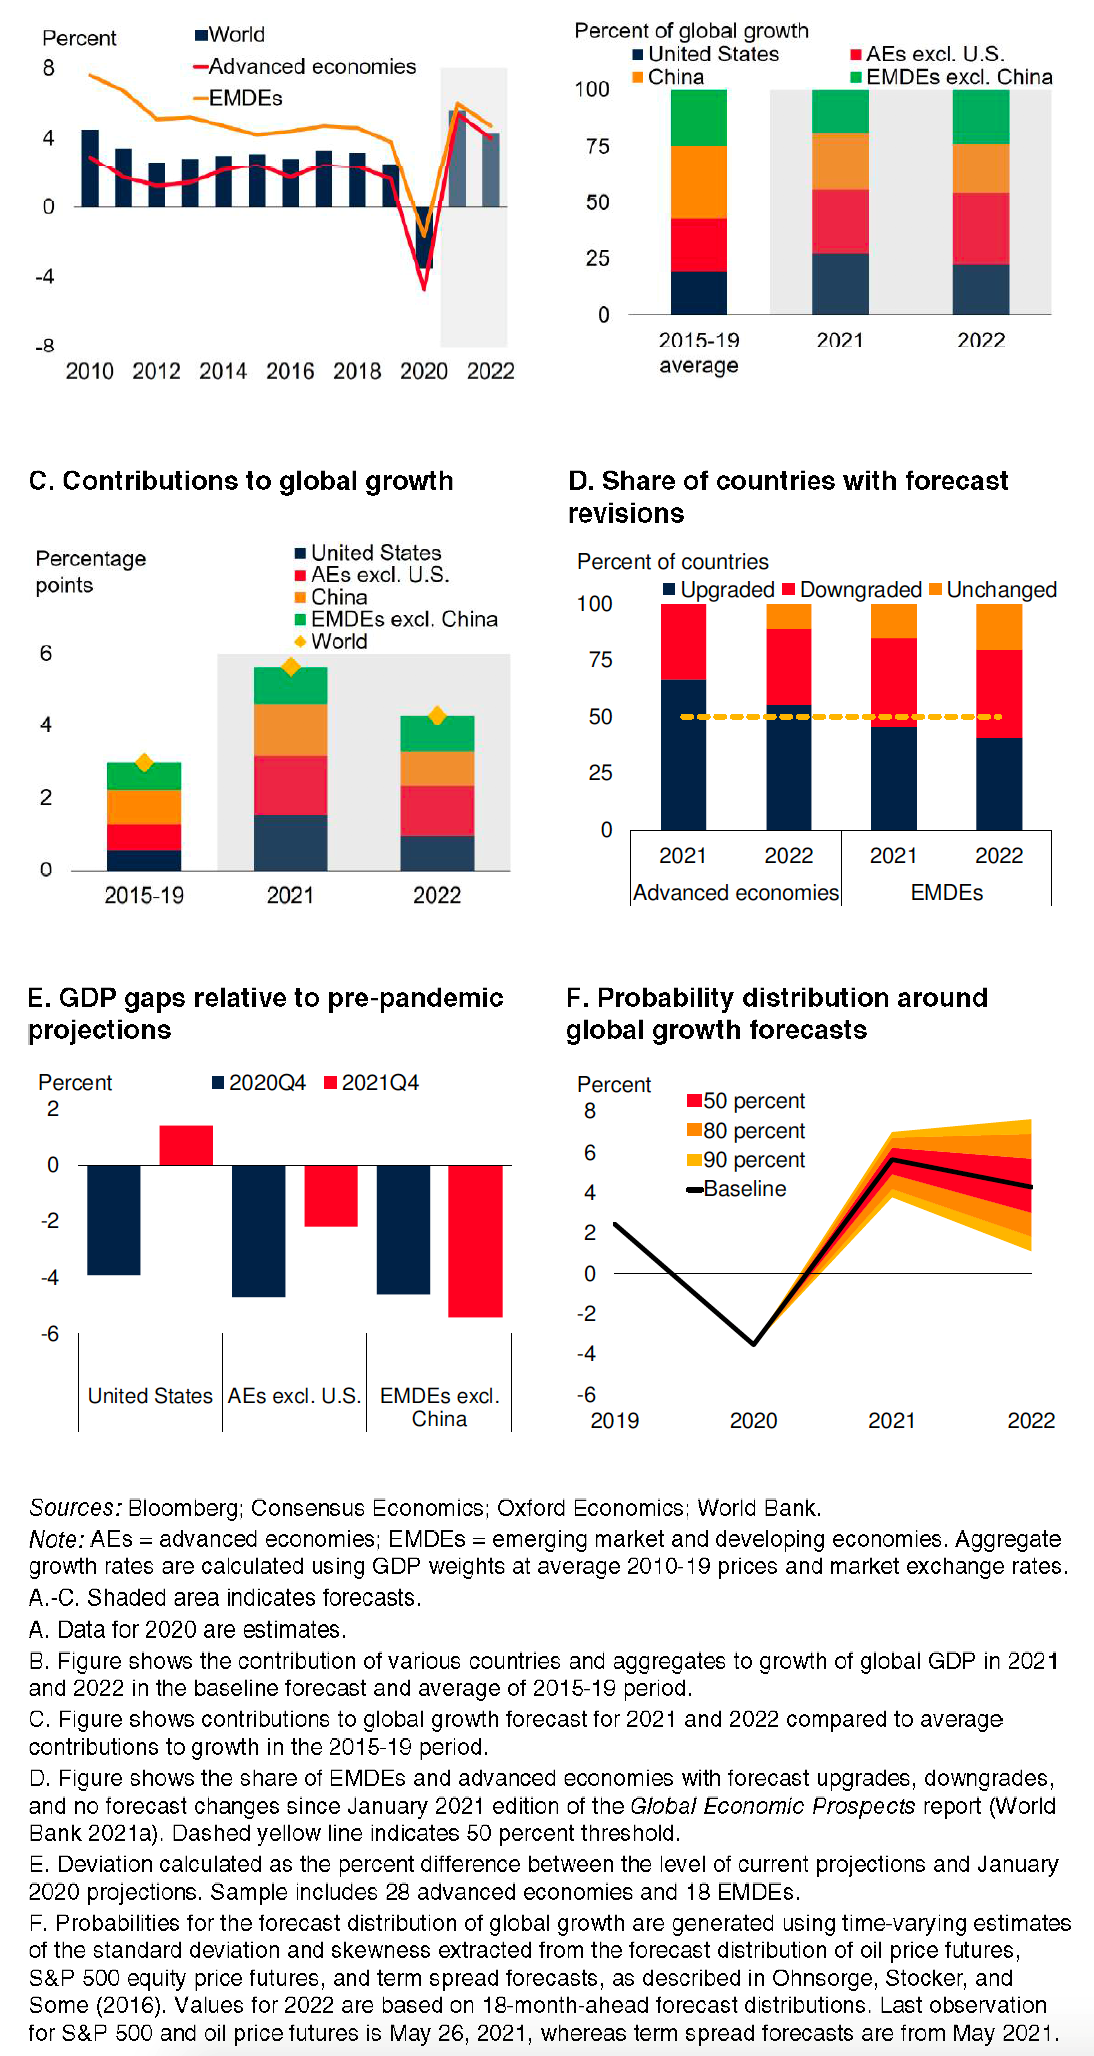
The graphs provide a variety of data showing the global economy emerging from the COVID-19 pandemic. AEs means Advanced Economies. EMDEs means Emerging Market and Developing Economies.
The global economy is recovering from the global COVID-19 pandemic recession. The development of a vaccine to help contain the spread of the coronavirus has been stellar. The rollout of the vaccine however, not so much. The economic recovery has been mainly driven by a few major economies such as China and America. In a number of emerging market and developing economies, it looks as though growth forecasts have been downgraded with output and growth projected to remain quite a bit below pre-pandemic trends – thanks to the spread of the coronavirus.
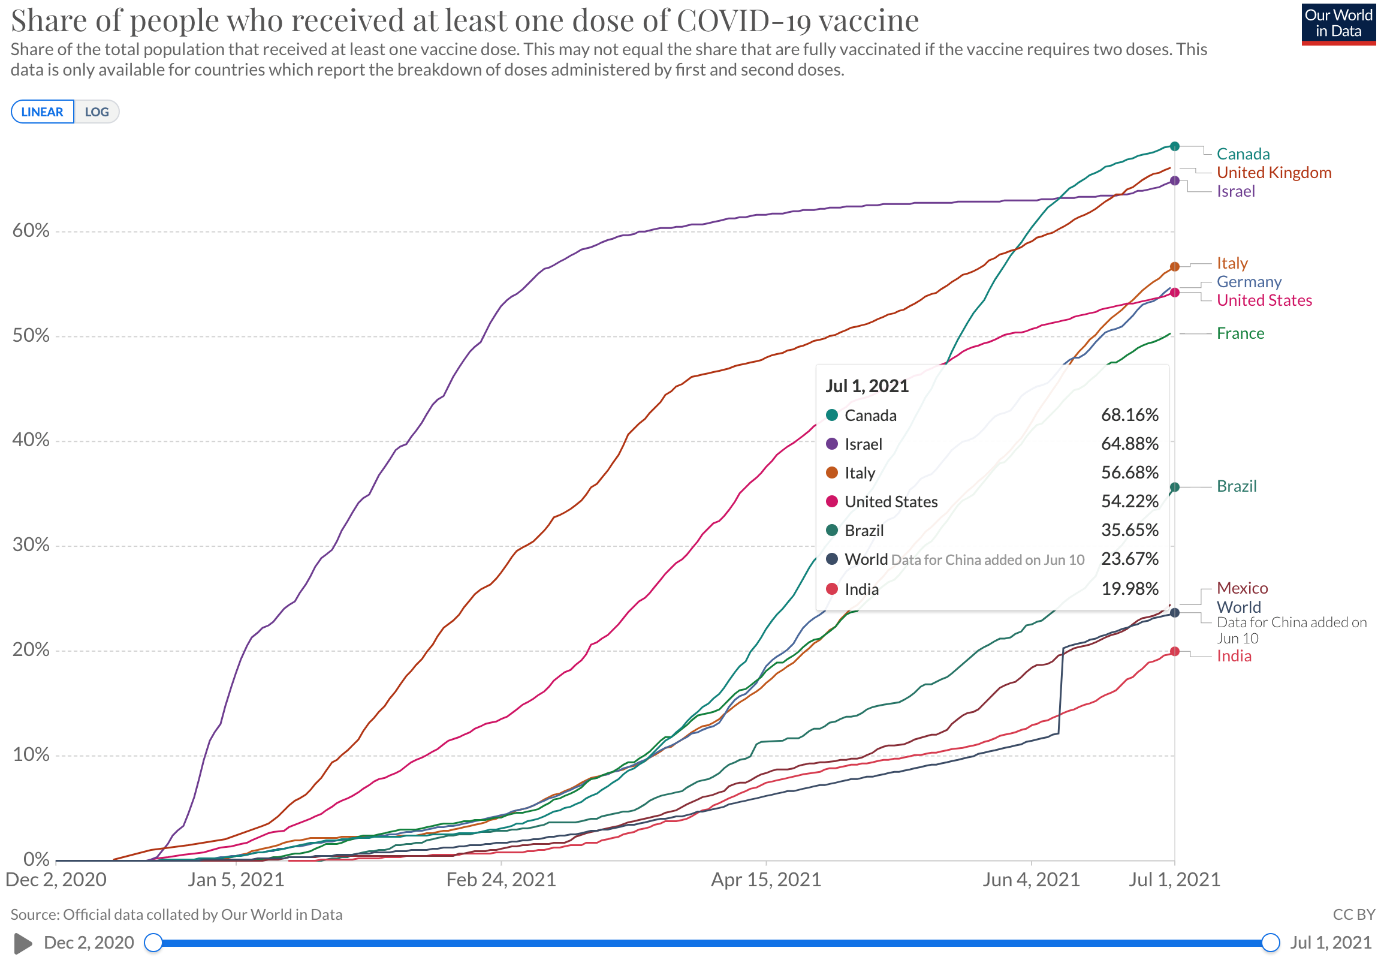
The above graph tracks the rollout of the COVID-19 vaccine in a variety of countries around the world.
As the above graph shows the rollout of the vaccine is mixed on a global basis. The advanced economies appear to be faring better in terms of the rollout distribution although a number of those still have quite a long way to go. The emerging and developing economies however are struggling to roll out the vaccine. An obvious standout is India although they are not alone in terms of their struggle to manage the spread of COVID-19.
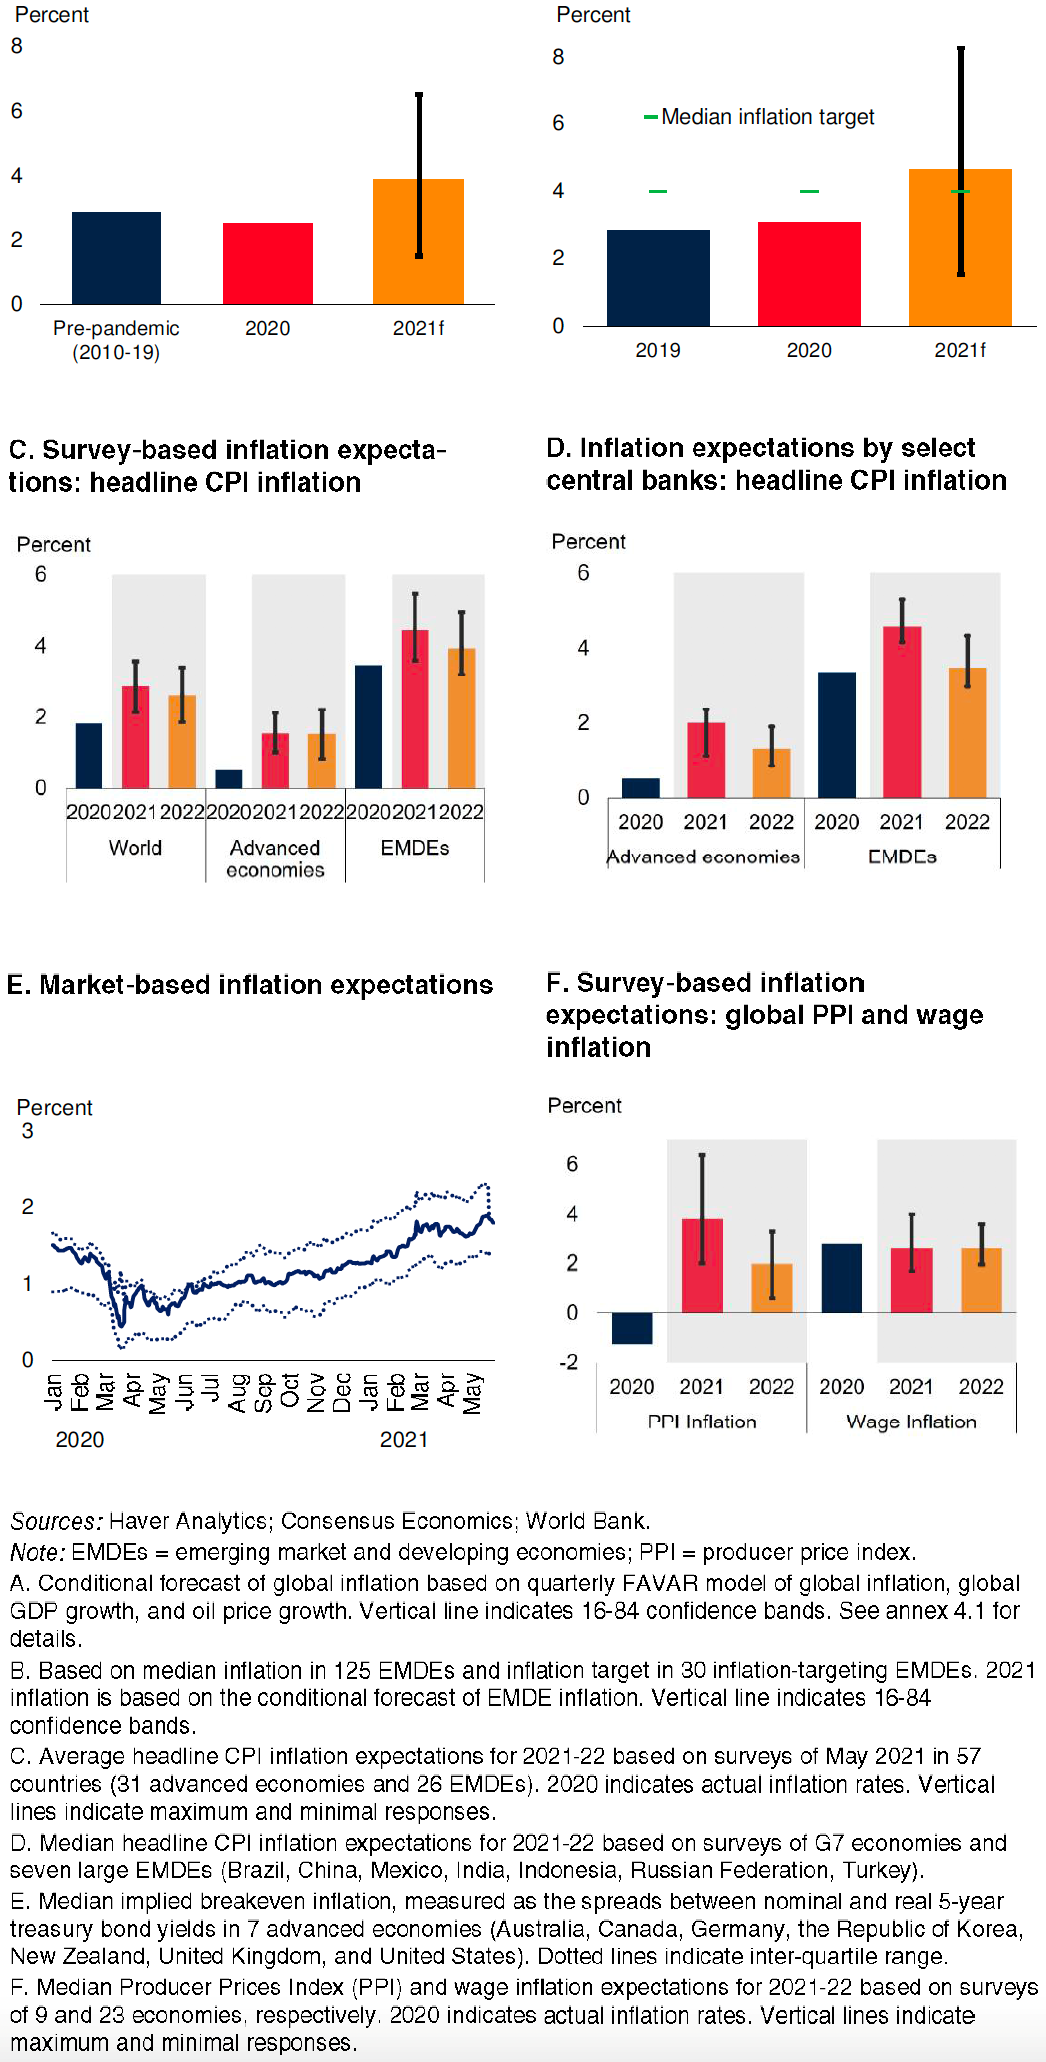
The above collection of graphs provides an interesting outlook for inflation. The above graphs suggest inflation will be around benchmark or slightly above but not rampant inflation as some commentators suggest.
In short, the outlook for inflation as the US Fed and other central bankers have suggested, appears to be somewhat transitory over the next 12 months or so with some deflationary factors helping to keep much higher levels of inflation in check.
Looking more closely, on the assumption that global output growth is expected to exceed 5% over 2021 and all prices that have already increased continue to increase, this scenario suggests a 1.4 percentage point increase in inflation in 2021 (from 2.5% to 3.9% in 2021). Whilst there are other models with slightly different projections, I believe this provides us with a realistic look into the future and where inflation may be heading. Of course, it offers no guarantee but is nonetheless a reasonably credible guide to what may be in front of us with regard to inflation.
The United States of America
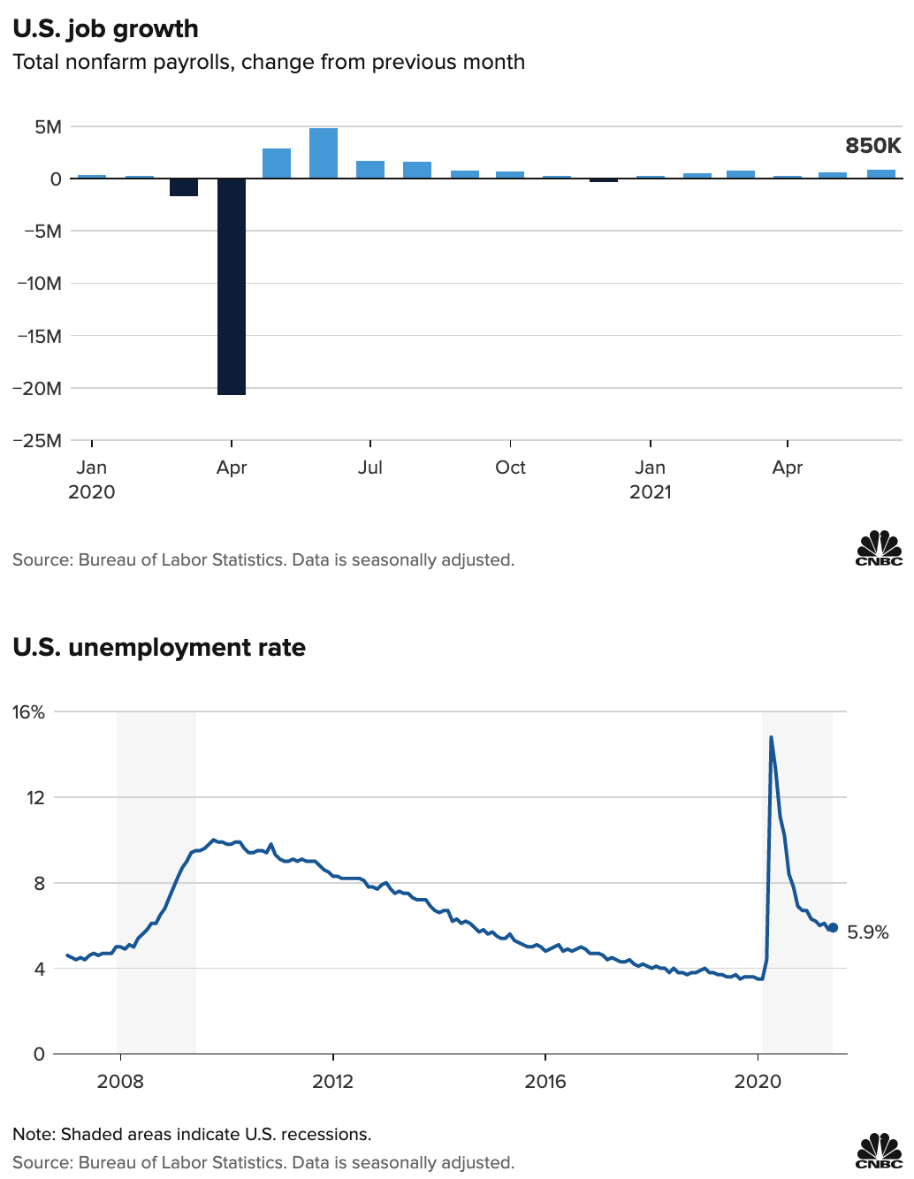
The top graph shows the change in non-farm payrolls from the previous month (an improvement of 850,000 jobs), the bottom graph measures the US unemployment rate.
The unemployment rate in America continues to decline. Although as the lower graph above shows that, the unemployment rate is still not at pre-pandemic levels. It is heading in the right direction but may take a while longer to get there.
I mention unemployment and the jobless number etc. because the market has been very focused on it over the last few months. Indeed, the recent share market index record highs is a testament to the favourable response from the market to the improvement in the unemployment rate across America.
US Fed considers inflation.
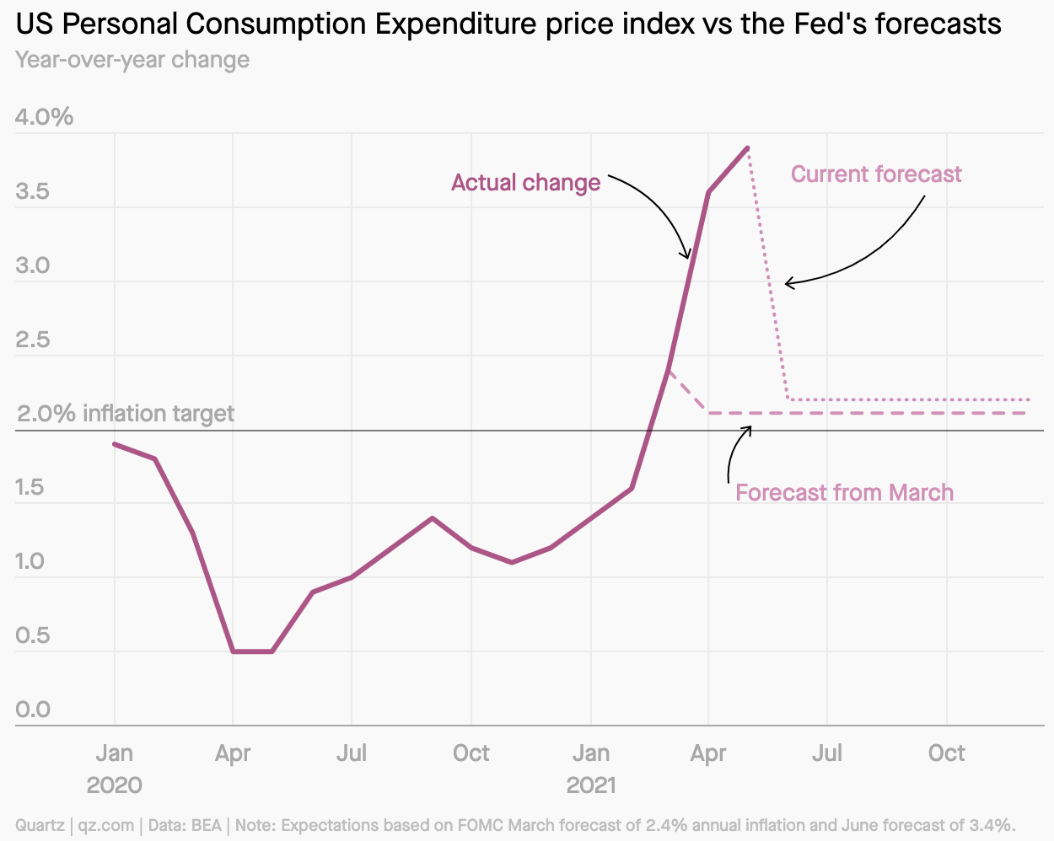
The above graph shows how the US Feds projections and how they changed between March and June this year as US economic recovery exceeded the Fed’s expectations.
Faster than expected economic recovery from the COVID-19 pandemic recession is one reason why some members of the Federal Reserve are thinking about rate hikes earlier in 2022 than has been discussed in the past.
So, for the Feds forecast of 3.4% inflation in 2021 to be accurate, price increases will still have to slow quite a bit in the months ahead (to an approximate 2.2% annualised increase).
The Fed I believe, is thinking that the pent-up demand and the short-term boost to inflation will subside somewhat as the pent-up nature of demand diminishes and settles into a more normal pattern over the final quarter of 2021 through 2022.
Britain
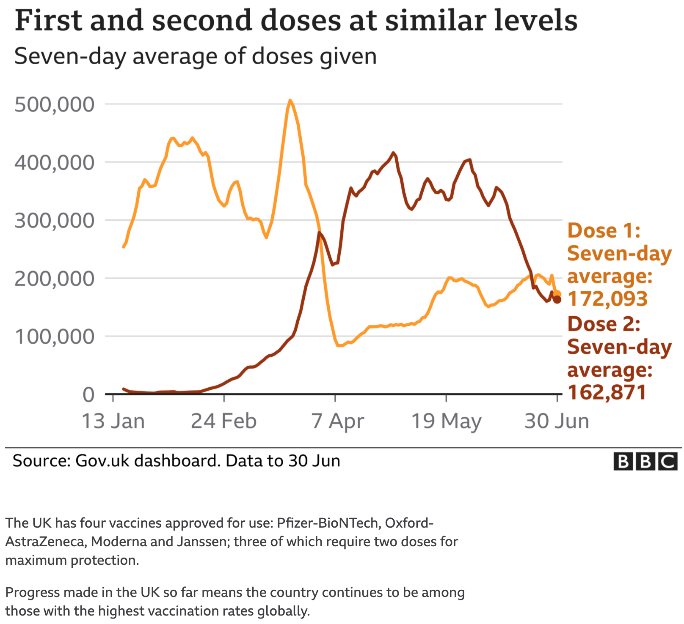
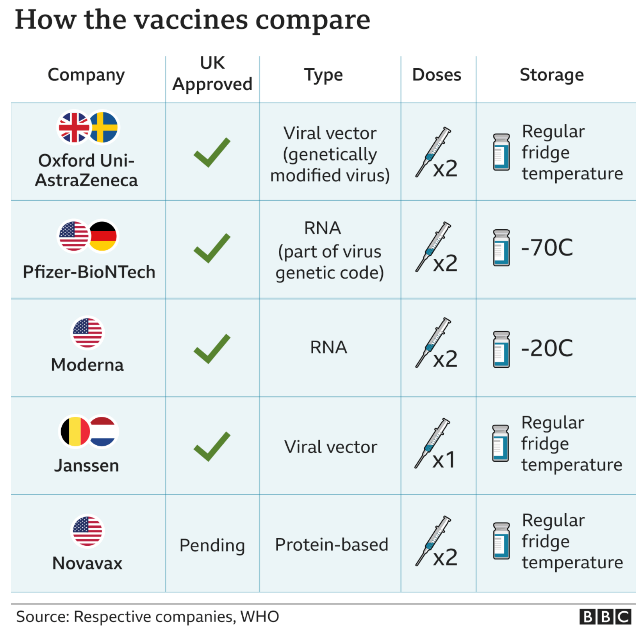
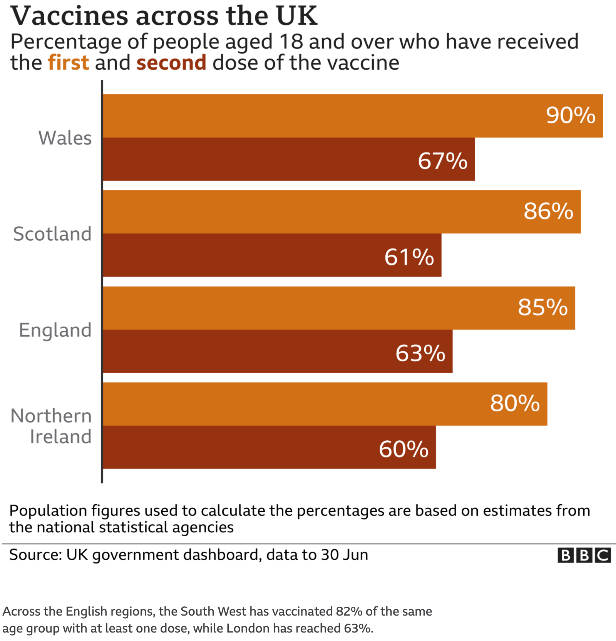
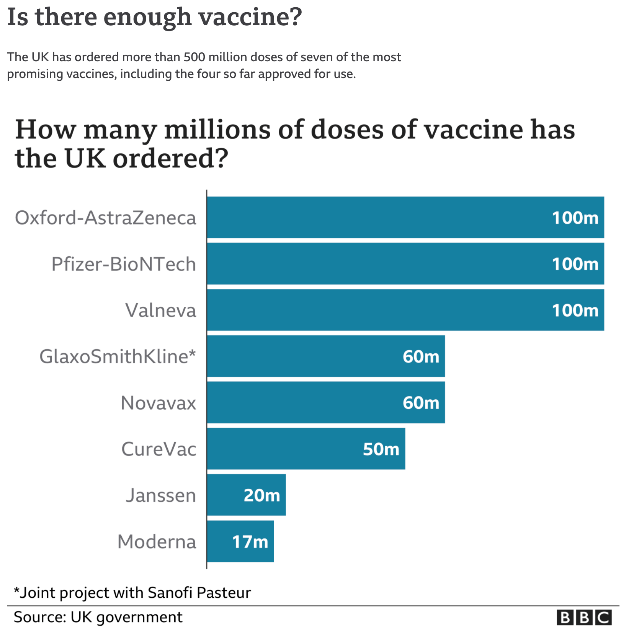
The top left graph tracks the rollout of the first and second doses. The top right graph indicates what percentage of people over age 18 have received the first and second dose of the vaccine across Britain. The bottom left table compares the different vaccines. The bottom right graph indicates the number of doses of each type of vaccine that has been ordered.
An additional 60 million doses of the Pfizer – BioNTech vaccines were ordered last month as the government prepares for a vaccine booster program in the not-too-distant future.
Getting sufficient supply, checking those supplies are in good shape and transporting the vaccines according to their requirements, have all seen difficulties emerge, some of which have yet to be dealt with.
The COVID-19 vaccine rollout is going reasonably well across the UK but they have still got quite a long way to go yet. By some measures, somewhere between 90% and 95% of populations need to be vaccinated to ensure that herd immunity is robust. I suspect it won’t be the majority of vaccinations that will present the problem but the final few. Some of them, for reasons of their own, may resist.
Australia
Economic Indicators – Australia
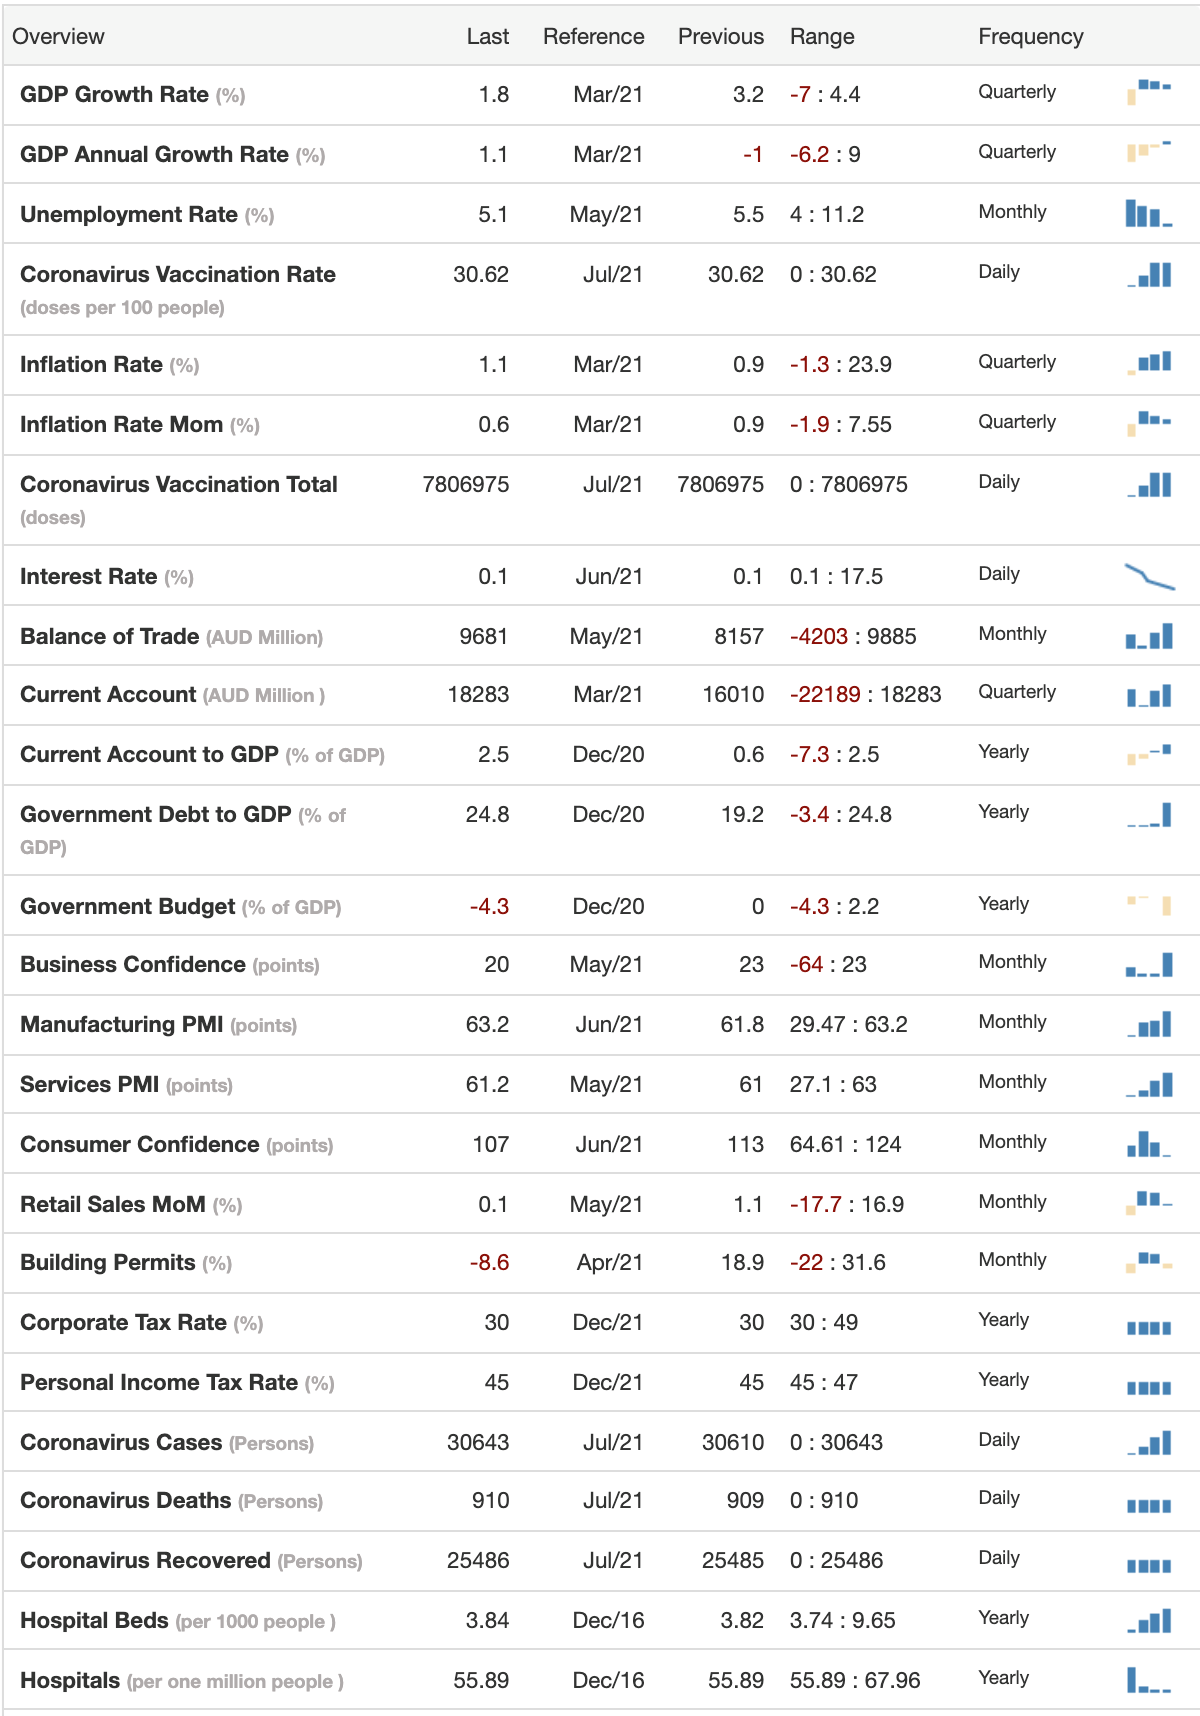
The above table outlines a variety of economic data across the Australian economy including information about the coronavirus (down the bottom of the table).
Australia has made good progress in its battle against COVID-19 although recently, as many Kiwis know, there has been another outbreak which has seen isolated lockdowns return once again. Whilst not everyone likes lockdowns, without them, COVID-19 and its various new strains are tricky to manage. Serious measures are needed. The good thing is they don’t last forever. New Zealand needs Australia to contain the coronavirus. We trade with Australia and of course travel between the two countries must be restricted at the slightest hint of community spread of the virus.
So, the coronavirus is a challenge for everyone including Australia. On the other hand, Australia has just seen a record trade surplus.
Balance of Trade – Australia
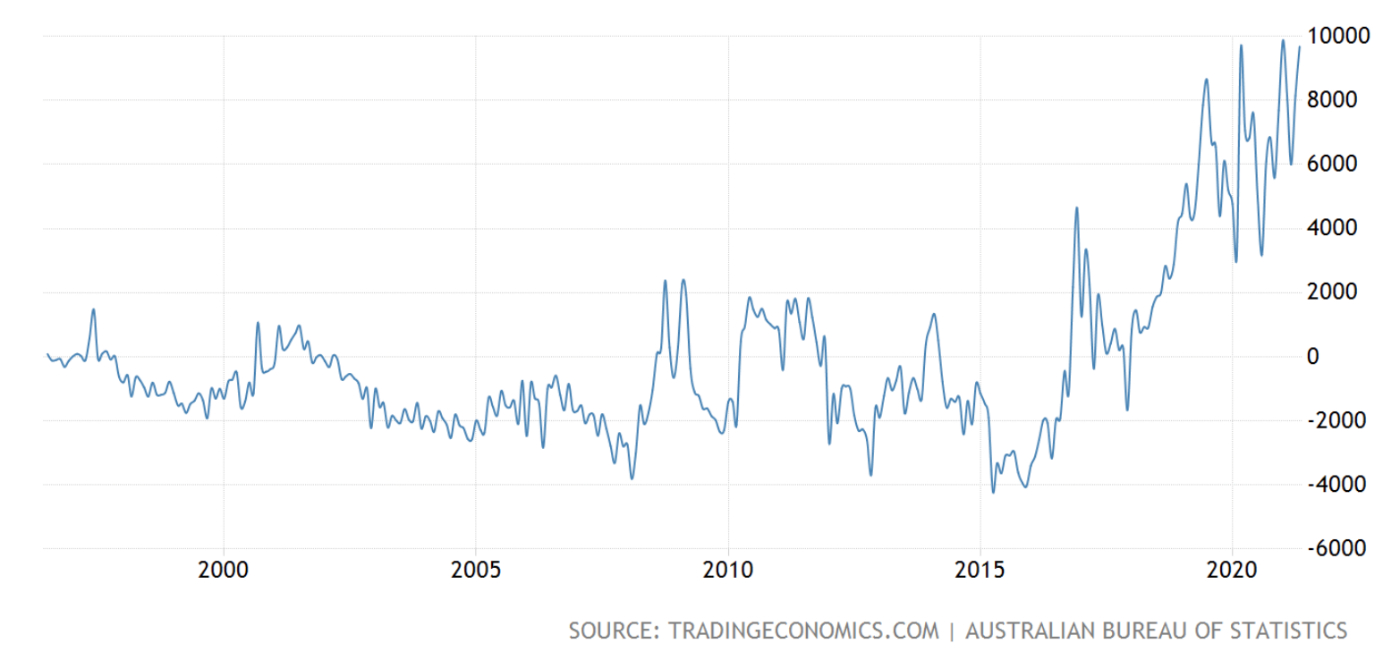
The above graph tracks Australia’s trading account. Note the length of time Australia’s trading account hovered around zero and now (toward the right side of the graph) how Australia’s balance of trade is tracking. Good news for Australia.
Australia’s trade surplus increased to a record high of AU$9.68 billion in May 2021. This was from a surplus of AU$8.16 billion in the previous month and compared with the market consensus of a trade surplus of AU$10 billion. Exports increased 6% to a 29th high of AU$42.23 billion. Imports rose a much lower 3% to $32.55.
The Australian Federal Government is anticipating that Australian economic growth (GDP) may fall by 3.75% for the year ended December 2020 before rising by 2.5% in 2021.
Australia net debt looks to be around AU$488 billion which equates to 24.6% of GDP as of 30th of June 2020. By the 30th of June 2021, net debt has increased to AU$677 billion.
Although high by historical standards for Australia, it remains low compared to many other developed economies (e.g., Germany, USA, Japan).
Like a number of other countries, unemployment has increased in Australia and looks like peaking at 9.25% in December this year. The Federal Government claim that their fiscal measures are estimated to have lowered the peak of unemployment by around 5 percentage points.
Interestingly, the government is expecting COVID-19 restrictions to ease across the country from September onwards and from there the Australian economy should get back on track but possibly remain at growth levels below pre-COVID levels for some years to come.
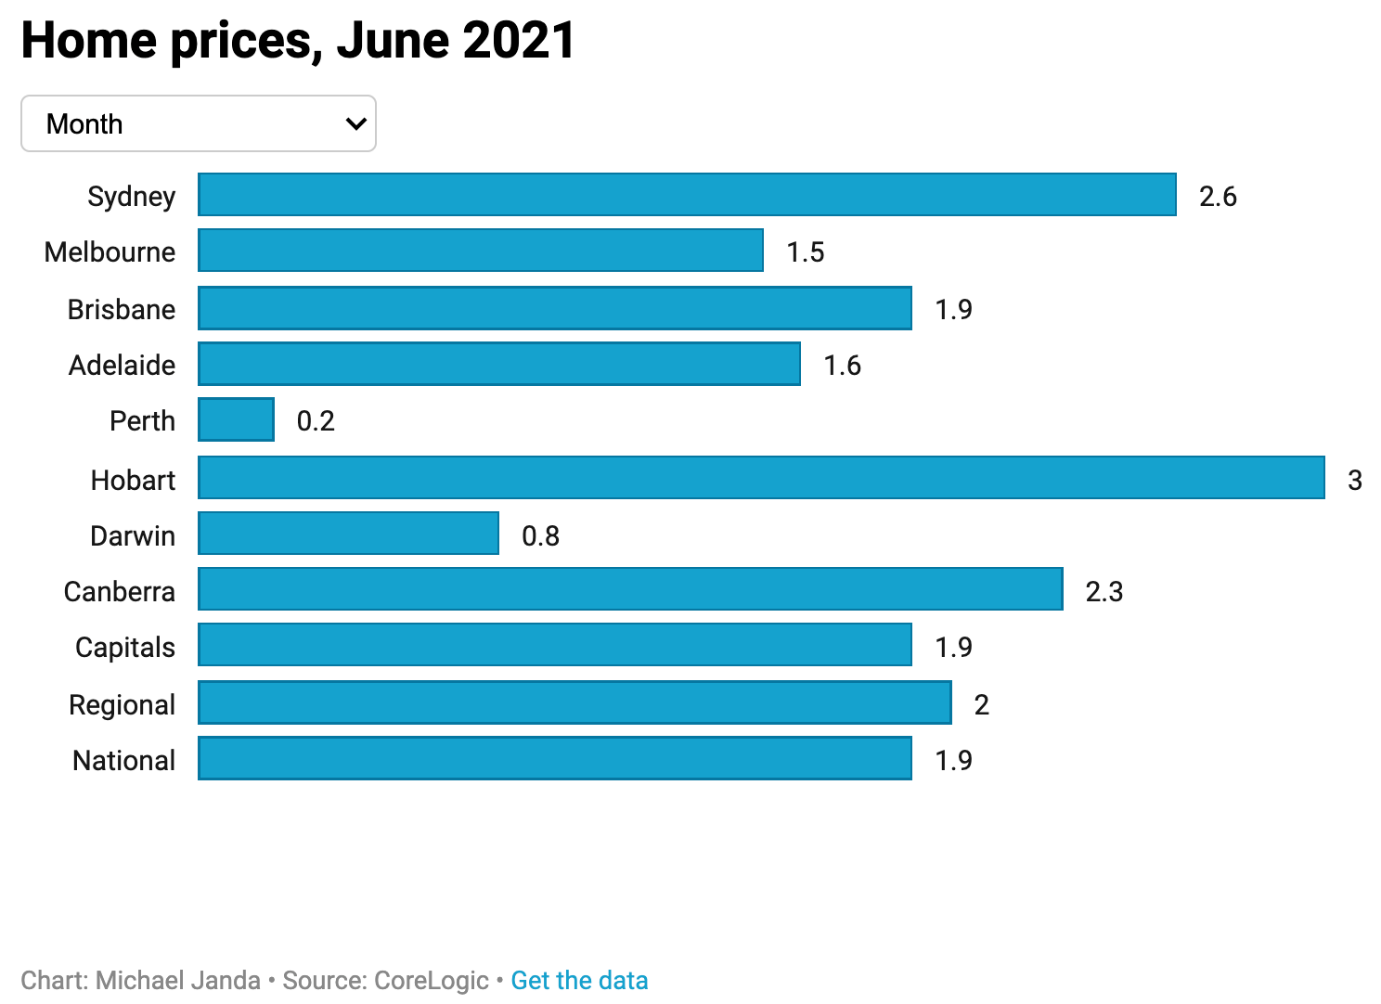
The above graph measures the increase in the price of housing across a variety of centres in Australia for the month of June.
A similar story in other parts of the world (i.e., New Zealand) house prices are rising fast on the back of limited supply, coupled with high demand along with a recovering economy and of course all-time low interest rates. This is the perfect cocktail for rising residential property prices.
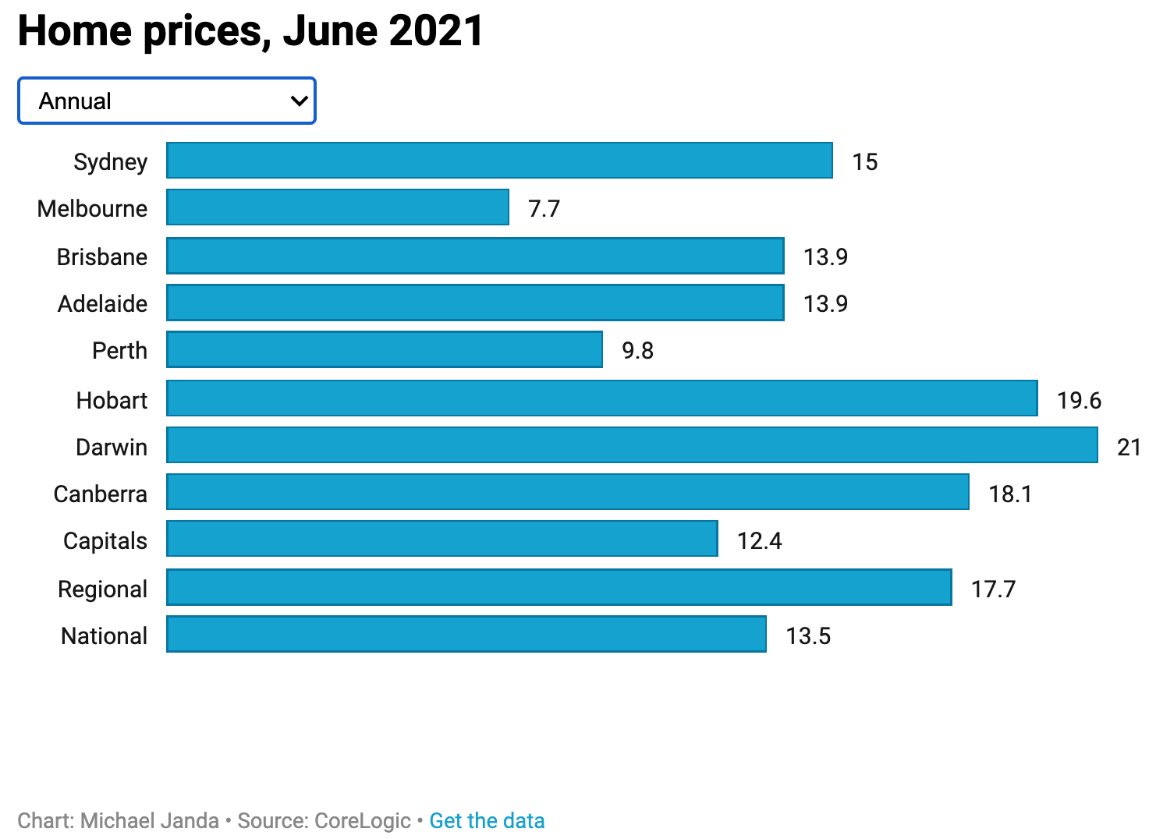
The above graph measures the annual increase in housing prices across Australia.
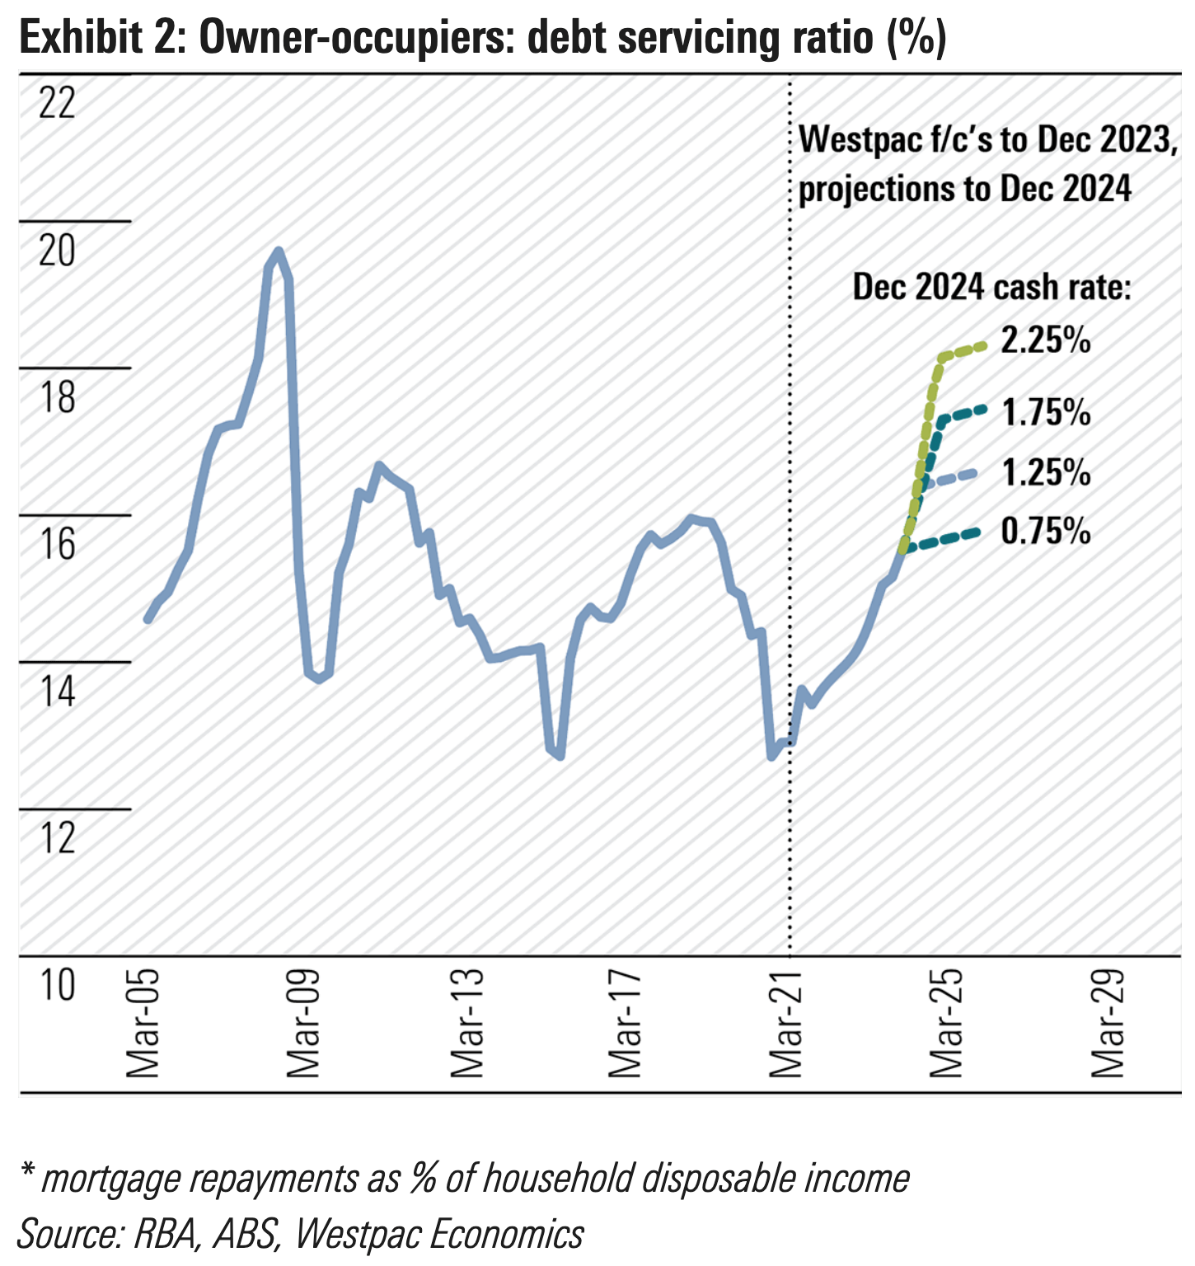
The above graph tracks the owner-occupier debt servicing ratio, projecting different interest rate levels against an increasing debt servicing ratio (see the right side of the graph).
In Australia, the debt is concentrated among owner-occupiers (as distinct from landlords/investors).
Simply, recent buyers won’t have the tailwind of ever reducing interest rates and likely also they’ll miss out on strongly rising property prices as well. Let’s face it, the conditions that have seen residential property prices in Australia and New Zealand increase are running out of puff. Interest rates can only go so low for so long. The ability of everyday Australians to service an increasing level of debt has its limits. Add into that, the fact that interest rates will rise.
I am not promoting the idea of housing price Armageddon. Logic suggests however that ideal conditions making it easy for trading prices to rise, might mean that less than ideal conditions will make things more difficult for trading prices to rise. I say this meaning not only owner occupiers, but investors and other parts of the economy that rely on housing for activity and growth.
Australia the lucky country fortunately has other arrows in its quiver and might be less reliant on housing going well for economic stability. I suspect though that a troubled housing market in Australia might create some headwinds in the future.
For now though, Australia, when it finally contains the coronavirus, will be on a path for sustainable but perhaps, a tepid level of economic growth. That’s okay because, we in New Zealand trade quite a bit with Australia and will take stable growth if that’s what we can get.
New Zealand
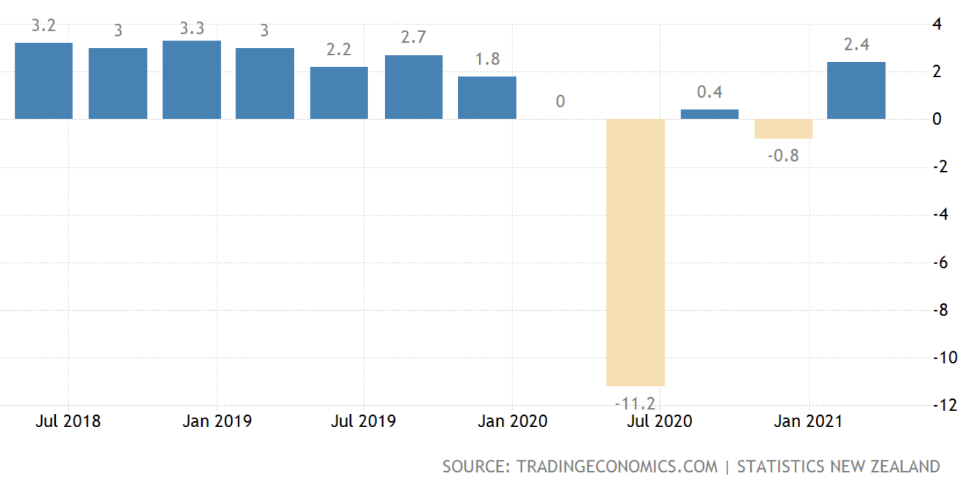
The above graph measures economic activity and growth as per GDP.
New Zealand understandably has had a somewhat rocky road in terms of economic growth as result of COVID-19. We have survived and are getting there but live in a world that is far from free of COVID-19. That may limit our ability to grow in the future because, like most other countries, we trade with a number of other countries around the world.
China is important to us as is Australia, given our volume of trade with both those countries. Ironically, Australia and China are having a tiff which I suspect will drag on for a bit longer. It has not been unduly damaging for the Australian economy so far but should it become so, then it could flow on across the Tasman to New Zealand making things more difficult for us too.
On that note, so far Jacinda Ardern and the Labour Party appear to be successfully treading the fine line between standing up for what they believe in and upsetting China. I mention this because some comments from the Labour Party have not gone unnoticed by senior members of the Communist party in recent times. They are watching. Jacinda and her colleagues will need to tread carefully in the future in my view.
Interest rates – New Zealand

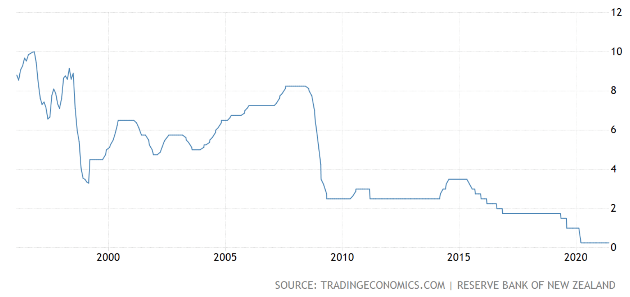
The chart to the left tracks the term deposit rate. The chart to the right tracks the official cash rate here in New Zealand.
The New Zealand Reserve Bank takes into account a variety of data to come up with conclusions around where to next for interest rates. A picture is emerging which suggests the first interest rate increase could be on the cards around August 2022 – possibly sooner. ASB and other banks just increased mortgage and term deposits rates across most time frames. From there, there are some expectations that, as unemployment normalises (all things equal), that ongoing incremental interest rate hikes may continue at 3 or 6 month intervals, reaching around 2% possibly by the end of 2024. This of course is all projections based on current data and could change. However, that’s how things look like now.
Unemployment – New Zealand
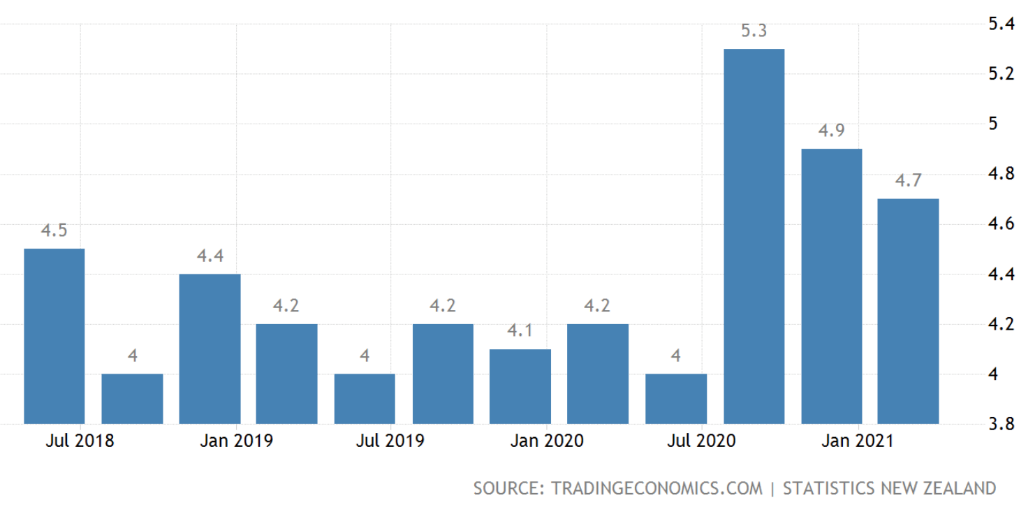
The above graph measures the unemployment rate in New Zealand.
As you can see, unemployment is steadily tracking down from the spike caused by the coronavirus. We’re not there yet but on track for a sustainable lower level of unemployment. Understandably, some workers in hospitality and tourism have had to work with an uncertain future as the coronavirus spread and lockdowns became somewhat normal.
Interestingly, New Zealand survived without international tourists over the summer. Travelling Kiwis, no doubt helped. So to did the stimulus packages from the Reserve Bank of New Zealand.
Residential property – New Zealand
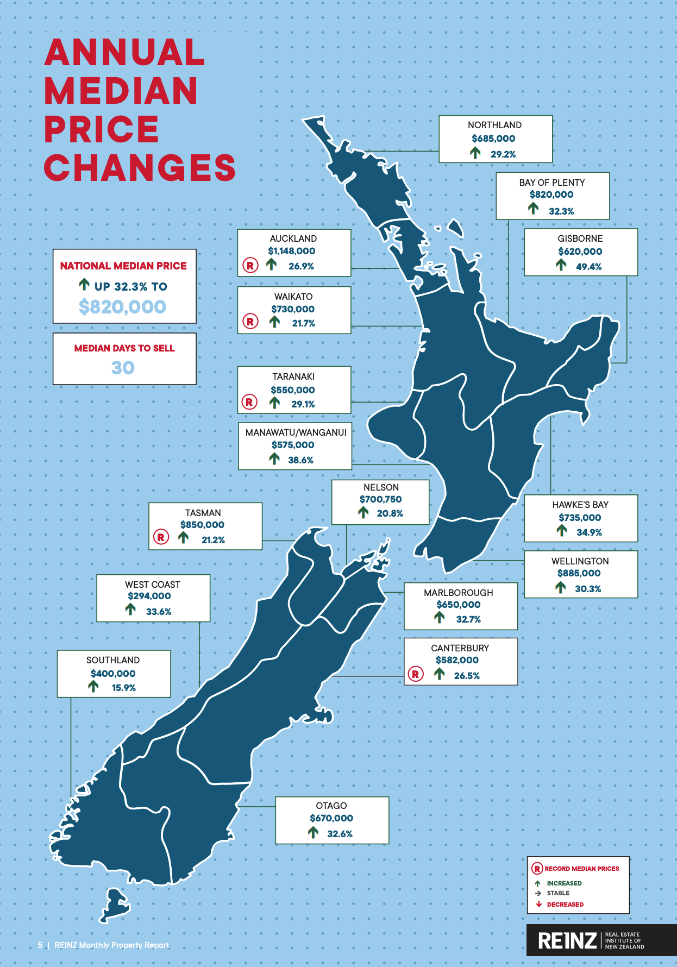
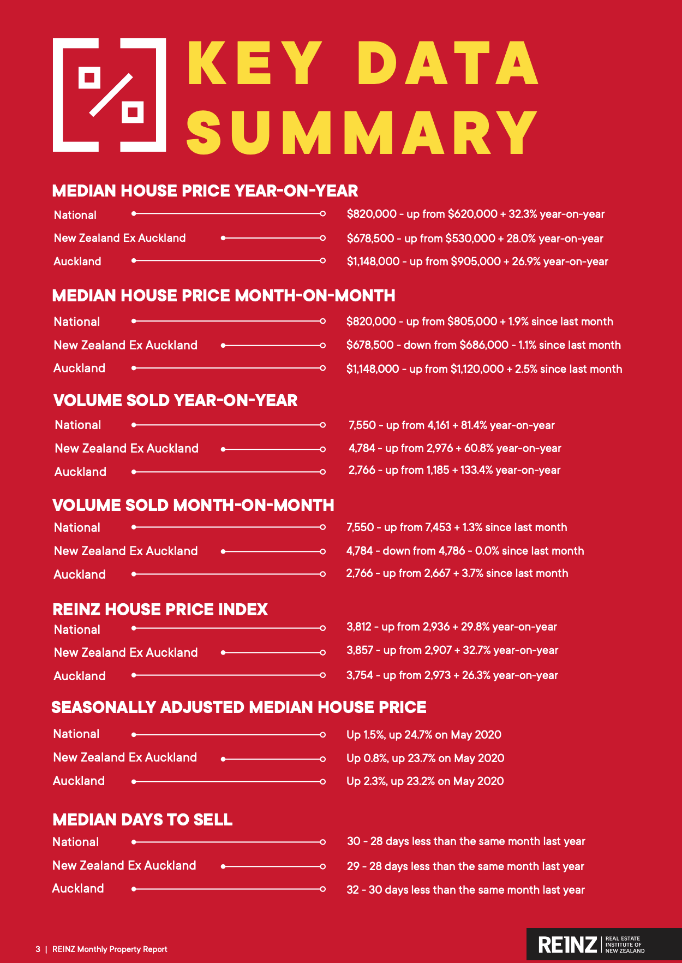
The diagram to the left outlines property price increases for residential property across New Zealand over the last 12 months to the end of May 2021. The table on the right lists key data for New Zealand residential property.
New Zealand residential property prices continue to rise with 15 of New Zealand’s 19 regions having a 14-year record high, based on asking prices to the end of June – based on recent asking prices.
It is important to note that asking prices are a simplistic measure because they exclude things like actual sales and other information. Still, how ever we measure it, residential prices generally continue to rise at pace.
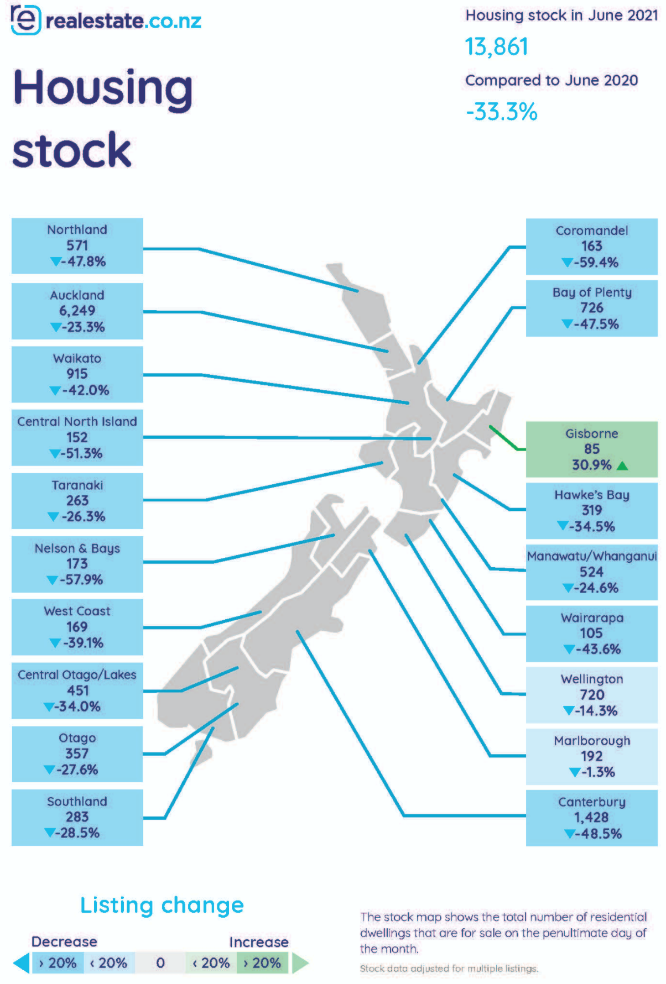
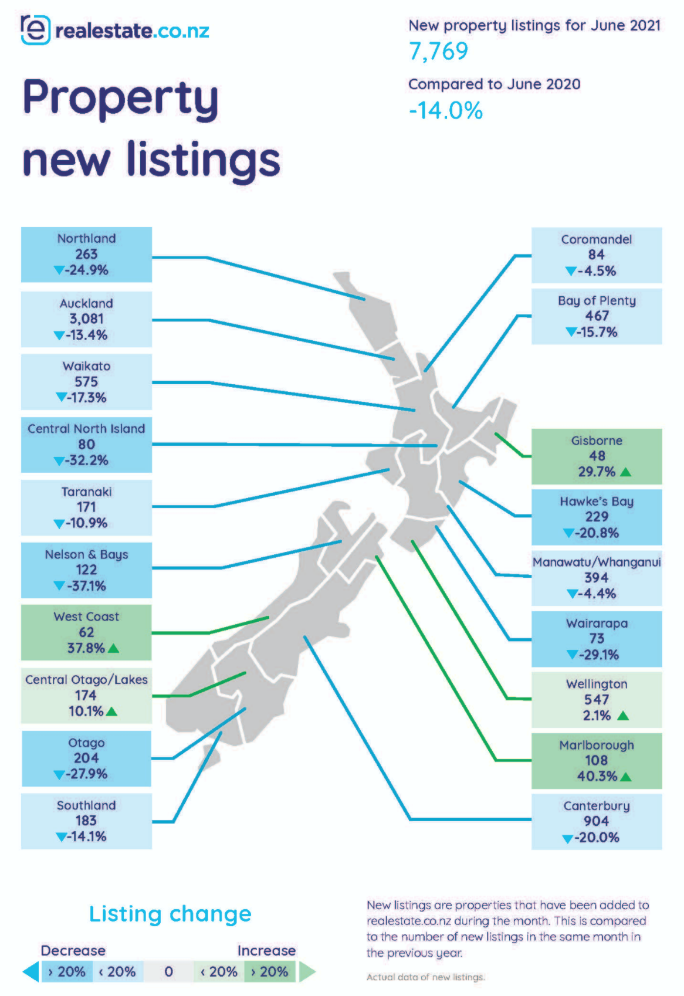
The chart to the left above measures the level of housing stock in various centres accross New Zealand. The diagram to the right measures new property listings across New Zealand.
As you can no doubt see, when you combine all this data together, what we have is rising prices on the back of low interest rates, strong demand, limited supply and an accommodative liquid environment, despite the coronavirus or indeed because of it.
Direct shares, property and other assets trading prices can rise freely in a highly liquid environment like we’ve had now for some time. On the other hand, when there is a credit crunch or capital is difficult to obtain, we have either flatlining trading prices, decreasing trading prices (sometimes sharply).
To be clear, we live in a very liquid environment where money has been and still is relatively freely available. This is not a normal environment which is partly why we see trading prices, whether it be direct shares or property rising strongly.
Overall, the New Zealand economy endured COVID-19 and partly by good management with some luck thrown in, we’ve managed to contain the virus – so far.
There are not many countries that made a good fist of controlling the virus who have not fallen back into at least partial lockdown. Can New Zealand defy the odds?
To Summarise …
Global markets are focused on inflation out of the US and the timing of rising interest rates.
I suspect we’ll see immediate reaction to just the talk about rising interest rates, before interest rates actually rise.
Although I’m not one to speculate, however if I was to speculate about how markets might react, there is a good chance that fund managers and other investors en masse could decide to “rotate” or even “pivot” if they think interest rates are rising anytime soon, too fast or strong.
Having been trained in modern portfolio theory, I am aware that rebalancing portfolios is a methodology that is followed strongly by those attached to this investing methodology as their preferred investing way.
The point I’m getting to is that, if there is enough consensus around the market and when the time comes, that’s why we could see a sharp correction of trading prices – not because there is a fundamental problem with quality businesses that exist across the market.
Remember, rising interest rates means growth.
Last time I looked; growth is a good thing – if you see what I mean?
It’s also worth mentioning now too that those investors who have been brave and adopted a more advanced strategy whilst markets have been rising, may want to take a minute to “check their pulse” as it were.
Whilst the markets around the world have generally moved on from COVID-19, most economies are still right in the middle of it.
In other words, their economic activity and growth is still suffering from the effects of COVID-19.
Many economies however are emerging although in general terms, more advanced economies seem to be progressing faster, whereas emerging and developing economies seem to be generally struggling and indeed may face tough times for longer.
Interest rates for many economies are on hold, certainly for the rest of 2021 and possibly for most of 2022.
Still, we shouldn’t rule out a surprise on the inflation front if it turns out that central bankers (along with Peter Flannery) have miscalculated. As you know, the debate is whether current and immediate future inflation pressures are transitory and therefore temporary, or, working up to a big leap in inflation with dramatic consequences.
Although I could always be wrong, the weight of data favours a transitory inflation environment.
That said, further into the future, I would expect some inflationary pressure to emerge as economies around the world stabilise and continue to grow. I don’t think we can rule inflation out in the medium term. In the short term though, it looks to be a spike as has been suggested by central banks around the world.
As I mentioned elsewhere too, expect markets to react to talk about interest rates rather than wait for interest rates to actually rise.
As Australia grapples with a relapse into coronavirus land, I think it will be an amazing feat for New Zealand to dodge a relapse into community COVID-19 infection spread – what do you think?
The odds are against us however, that does not mean that it is not possible…