Markets Fragile (and The Economy Too?)
Market and Economic Update – January 2019

Peter Flannery CFP AFA
“If you have one economist on your team,
it’s likely that you have one more than you’ll need.”
Warren Buffett
HAPPY NEW YEAR!
The Markets
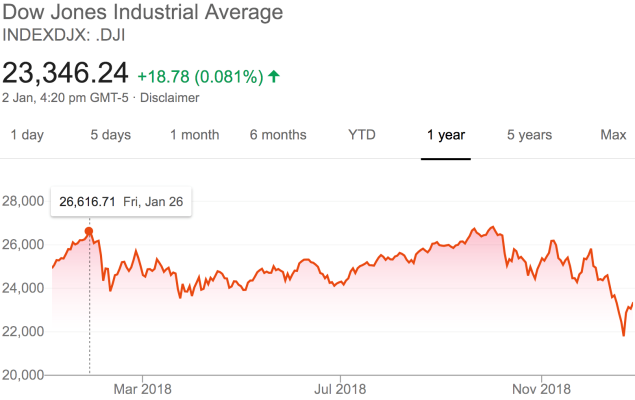
The above chart shows the Dow Jones Industrial index (the US sharemarket) at around its peak of 26,616.71. The larger number at the top of the chart (23,346.24) is where the Dow Jones Industrial Average Index is at currently (January 2 2019).

The above chart is once again the Dow Jones Industrial Average Index going all the way back to March 1979 but, with the mouse cursor on my laptop highlighting for you the Index at 2,482.21 as at October 9 1987 – ring any bells !?
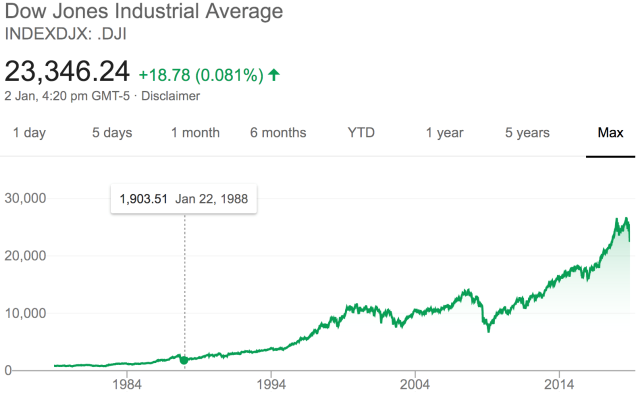
The above chart staying with the Dow Jones Industrial Average has my laptop cursor highlighting for you the Dow Jones at 1,903.51 by January 22 1988.
To be clear, this and the previous chart show the movement in the sharemarket index over the so-called “1987 sharemarket crash”.
1987 was a memorable time for anyone involved in the sharemarket back then. It is interesting to note the level of the Dow Jones by January 22 1988 was sitting at 1,903.51, much lower than the current level of around 23,346.24 today. What do you make of that? Take another look at those numbers – see how much the Dow Jones has increased since 1987.
The short of it is that markets will often have something to worry about and as Warren Buffett has famously said, that’s the time for you and I to get greedy. But wait a minute … in January (January the 1st to be exact) 1988 the price to earnings ratio (P/E ratio) was sitting at around 14. I admit that the price earnings ratio is a blunt instrument and not a ratio that I would use to value an individual business but nonetheless a quick and easy “ready reckoner” to understand where trading prices across the market sit compared to their underlying earnings or profits. When the gap betweeen trading prices and earnings (profit) becomes too large we know that things are possibly getting expensive. Although again, it is just an indicator and not in my opinion a buy or sell signal for an individual business – no way.
The P/E ratios since January 2013 when the P/E ratio across the Dow Jones was sitting at 17.03 were,
- p/e 18.15 January 2014,
- p/e 20.02 January 2015,
- p/e 22.18 January 2016,
- p/e 23.59 January 2017,
- p/e 24.97 January 2018, and of course on January 2019 the estimated price to earnings ratio for the Dow Jones Industrial Average sits at …
- 19.26.
The point here is that markets are still not cheap but hardly expensive either, particularly if you think about the long term p/e ratio average of the Dow Jones sitting at around 18 or so. There are other measures that show the market is expensive. For us as Value Investors though, because we are investing in businesses, we are more interested in how well a particular business uses its capital rather than a price earnings ratio that measures the market as a whole. Whilst we may be interested in the P/E ratio of a particular business, it of course is a stock market ratio for stocks and not a business metric for the underlying economics of a business.
At the risk of stating the obvious, for us as Value Investors, because we invest in the business rather than the sharemarket or shares, we have little interest in using the rise or fall in the trading price of a particular stock as a way to assess the success of our investing efforts, particularly in the short run. Good businesses continue to grow despite market turbulence or even company specific issues that emerge from time to time.
Economic Update
Of course it is holiday time and the depth of economic information available is limited at the moment. The world continues revolving nonetheless, however there hasn’t been much of significance that I have seen emerge over the last couple of weeks or so (admittedly I have also been on Free Time too). Here are some things that might be worth watching over 2019:
- The synchronised global growth slows down or even stops. Whilst the US market still looks to be in expansion mode, China and Europe by some measures appear to be slowing. Markets in the past have used the US yield curve as an indicator of upcoming recession. This yield curve refers to 10 year yields trading at a level that is below three month rates and has been a reasonably reliable indicator of economic contraction. US rates are not there yet.
US yield curve (10 year less 3 month rate)
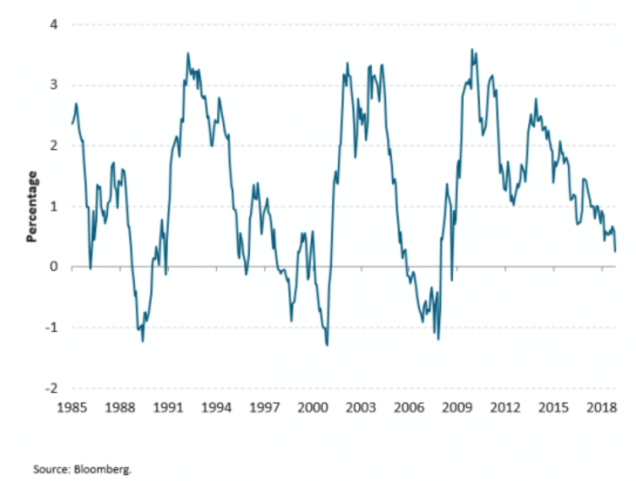
The chart above shows the US yield curve indicating recession is possibly on its way but not there yet.
-
-
- The impact of rising interest rates. This is a difficult one to predict because we don’t know when certain positions within the market will decide the pain is just too great to bear and exit their positions. This type of market action creates panic causing prices to decline sharply. Interestingly the US Federal Reserve Governor Jerome Powell has indicated that he may slow down interest rate hikes in the US over 2019 (from four hikes down to three possibly). It will be interesting to watch and to see how much of what has been signalled has been priced into market prices moving forward. We know that rising interest rates do impact on market prices at some point and that trying to predict the timing of it, difficult.
-
-
-
- So-called “trade wars”. A full blown trade war would have significant consequences for asset prices. Whilst there has been some impact in different parts of the world, I have seen little evidence of a full blown trade war. The media have predictably seized the opportunity to make lots of noise about it. Trump appears to be an unpredictable player for the Chinese to reckon with. That said, I would be surprised if China was not playing the long game, particularly given that they are unable to win a trade war in the short term.
-
-
-
- Chinese economic slow down. China is a large economy now and a significant slow down in economic growth in China would impact on global growth for sure. New Zealand of course would potentially be impacted significantly because China is one of our largest trading partners now. In my opinion the Chinese government have been vigorously managing economic growth and in my view, economic growth will likely be managed rather than declining and getting out of control. Any slow down, I think, will be managed, though, could potentially have a contagion effect with China’s trading neighbours and partners even if it is managed. The Chinese government however, I believe, will be aware of this.
-
-
-
- Brexit. Uncertainty is the enemy – markets just don’t like it. Brexit is creating significant uncertainty for Britain as the government continues to battle its way through the thorny issue of an orderly exit deal. So far this has proved elusive with a no deal exit looking possible. Currently this appears to be impacting on Britain more than other economies. One possible risk here is that, should Brexit become a disorderly mess, the markets could adopt a stance of fleeing to safety, creating wider market ripples and uncertainty.
-
-
-
- Domestic slow down. Consumer and business confidence surveys have been reasonably negative for quite some time in New Zealand although so far, this has not materialised into a real economic slow down. New Zealand economic growth has been hovering around 2.8% or so for some time which is good. Events offshore are a key influencer on the New Zealand economy and while synchronised global economic growth has been underway, this has been a fortunate environment for New Zealand, allowing it to continue to grow. Other drivers of the New Zealand economy are government policy, labour costs, availability of labour and consumer confidence. Interest rates appear to be on hold over 2019 and into 2020, with some commentators suggesting an actual cut in interest rates at some point over 2019. Australian residential property prices for example, particularly in Melbourne and Sydney (Perth too) have been declining strongly for some time and I just noticed a brief headline suggesting that there is now some leniency with regard to interest only loans for investors. Over 2018 the government and banks had tightened up significantly on interest only loans however the word is now that they may be loosening up once again.
-
-
-
- What we don’t know and the unexpected. Markets are a random walk and even though there are economists the world over measuring all kinds of economic data, markets on the other hand have a way of reacting sharply to even a single event, creating uncertainty and volatility. This just goes to show that no matter how closely we monitor economic data and all kinds of economic information, the market has a mind of its own – regardless. I have mentioned the black swan in the past however at this stage I don’t see any obvious black swan on the horizon. Still, there are numerous “grey swans”, any one of which could convert to a black swan at some point in the future. You may have noticed that global debt was absent from my list above and certainly there were other “grey swans” that I could have mentioned. Global debt could be an issue at some point, however rightly or wrongly, it is not something that global central bankers can’t manage (you have only got to look at Japan, China, USA and Europe to see evidence of this). America still matters as an economy because it is so large. The US Federal Reserve, whether we agree with how they have handled it or not, expanded their balance sheet and are now reining it is once again. Another example of significant debt being managed by a central bank.
-
I have highlighted some risks or “grey swans” for us to think about over the next year, however I remain positive about the resilience of the global economy, even when unexpected events suddenly erupt, seemingly from nowhere.
The living standards that we enjoy today have improved significantly, even when compared to our parents, not to mention the living standard that existed around the world two hundred hundred years ago. We now live in a vastly different place.
It’s not without its challenges.
It is not without its opportunity either …
HAPPY NEW YEAR AND ALL THE BEST FOR 2019.