First Inflation, Then Interest Rates Rise
Monthly Market and Economic Update – December 2021

Peter Flannery Financial Adviser CFP
“If you have one economist on your team,
it’s likely that you have one more than you’ll need.”
Warren Buffett
Key Points:
-
Inflation is boring but real.
-
Interest rates are rising in NZ and may follow elsewhere.
-
Markets have rediscovered volatility.
-
Is there more volatility to come?
THE MARKETS
So, where to next then?
Volatility, is it enough?
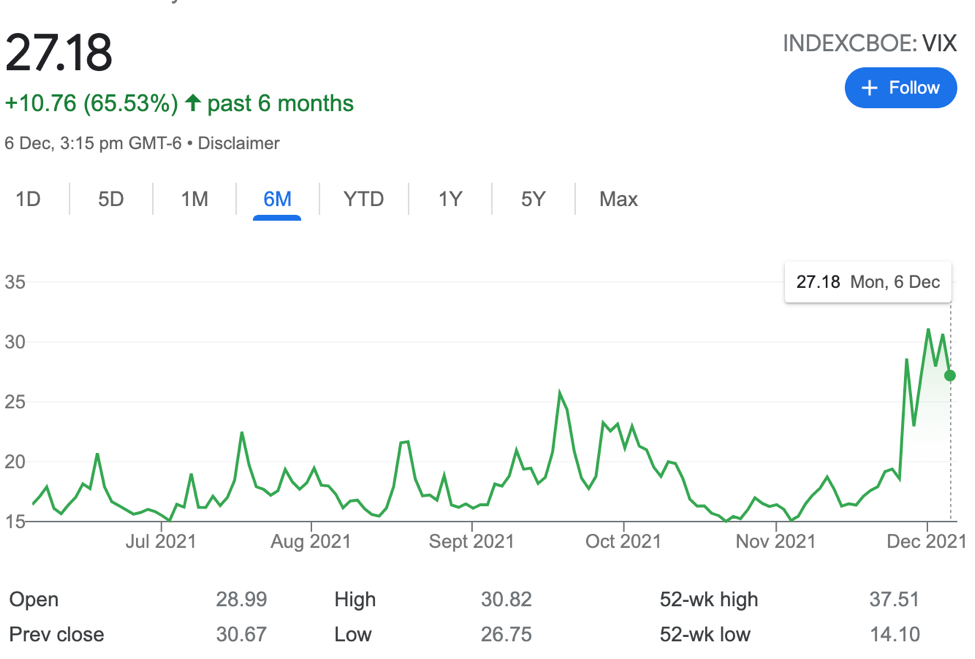
The above graph tracks market volatility. The higher the line on the graph, the greater the volatility.
So last month, I wondered where all of the volatility was, given the time of year!? We now have some. Is that enough?
The short answer is no. Trading prices are simply less expensive rather than cheap. However, we still have some opportunity.
For example, some businesses have been very popular or have become unpopular which can mean that their trading price declines sharply. PayPal, Zoom, and dotDigital are some examples that come to mind.
Averaging up and averaging down
You are likely familiar with averaging down. It simply means that after we’ve invested in a business and the trading price subsequently declines, we buy more shares in that same business, but at a lower price. This reduces the overall average cost for that business. That’s what we call averaging down. It is about reducing the overall cost of an investment.
Averaging up is the opposite and, like averaging down, is not a perfect tactic 100% of the time. It works though, usually.
Recently, we have increased our holdings in the likes of those three businesses mentioned above, but subsequently, the trading price has declined.
In the short term, for example, if we purchased some shares in any of those businesses a couple of months ago, we would have (at least on paper) incurred a loss on those recent buys if we were indeed to cash out at the lower trading price now.
The point here is that if we are not careful, we can adopt a play-the-market mentality and lament having paid too much for the last lot of shares recently. The reality is that, providing these businesses have sound economics and continue to grow, those buy prices in the fullness of time will actually start to look cheap.
A few years ago, I remember agonising over paying more than US$65 per share for Berkshire Hathaway B Shares. Guess what the trading price is now? I would love to pay US$65 per share today!
The point I’m making is that we should neither gloat over big gains in those recent purchases nor despair over unrealised ‘paper losses’ that will never materialise. Do you see what I mean?
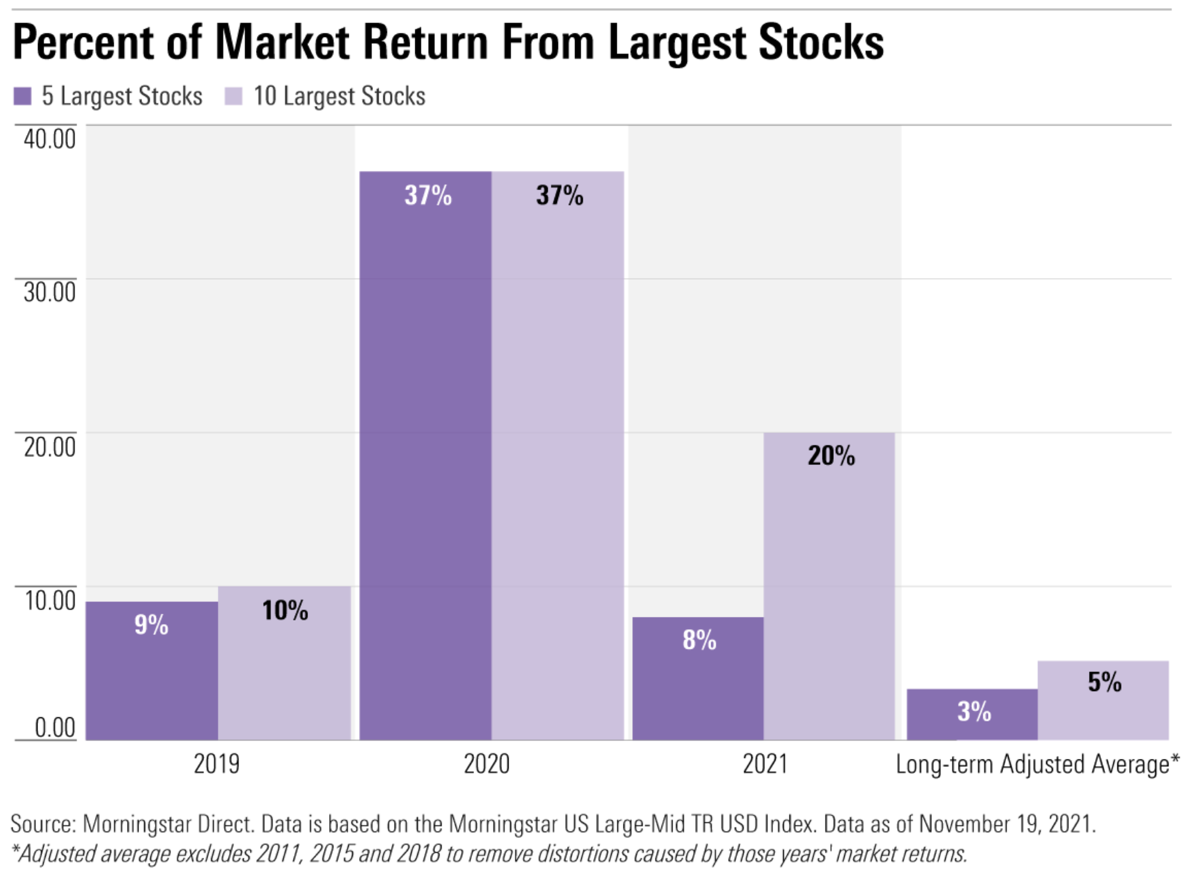
The above bar chart shows the performance from a trading price increase perspective and their contribution to ‘performance’, comparing the five largest stocks and the ten largest stocks across the US share market.
It is quite normal for certain classes or sectors within the market to exhibit underperformance or outperformance.
Moving towards the end of 2021, we can see that the significant concentration of returns in a handful of tech stocks were responsible for a lot of the gains made over the last couple of years. This now looks like it’s beginning to fade. Within those clusters, the larger stocks obviously would have the greater impact when the trading price rises or declines.
More specifically, the five largest stocks… Apple, Microsoft, Amazon, Meta platforms (Facebook) and Tesla contributed a significant 37% of total market returns.
This year, as of late November, in contrast, the five largest stocks contributed only 8% of market returns. Interestingly, that compares with an average return of 3% from 2009 to 2019 – a sizeable difference.
Looking more closely, the actual FAANG stocks (Facebook (now Meta), Apple, Amazon, Netflix, and Google) have contributed around 2.7% of returns in 2021. This is down from 24% in 2020.
The above information is somewhat interesting, although of limited value for us as e-Biz investors. That’s because we invest in the business and don’t play the share market. That market data does not tell us much about the quality of those businesses.
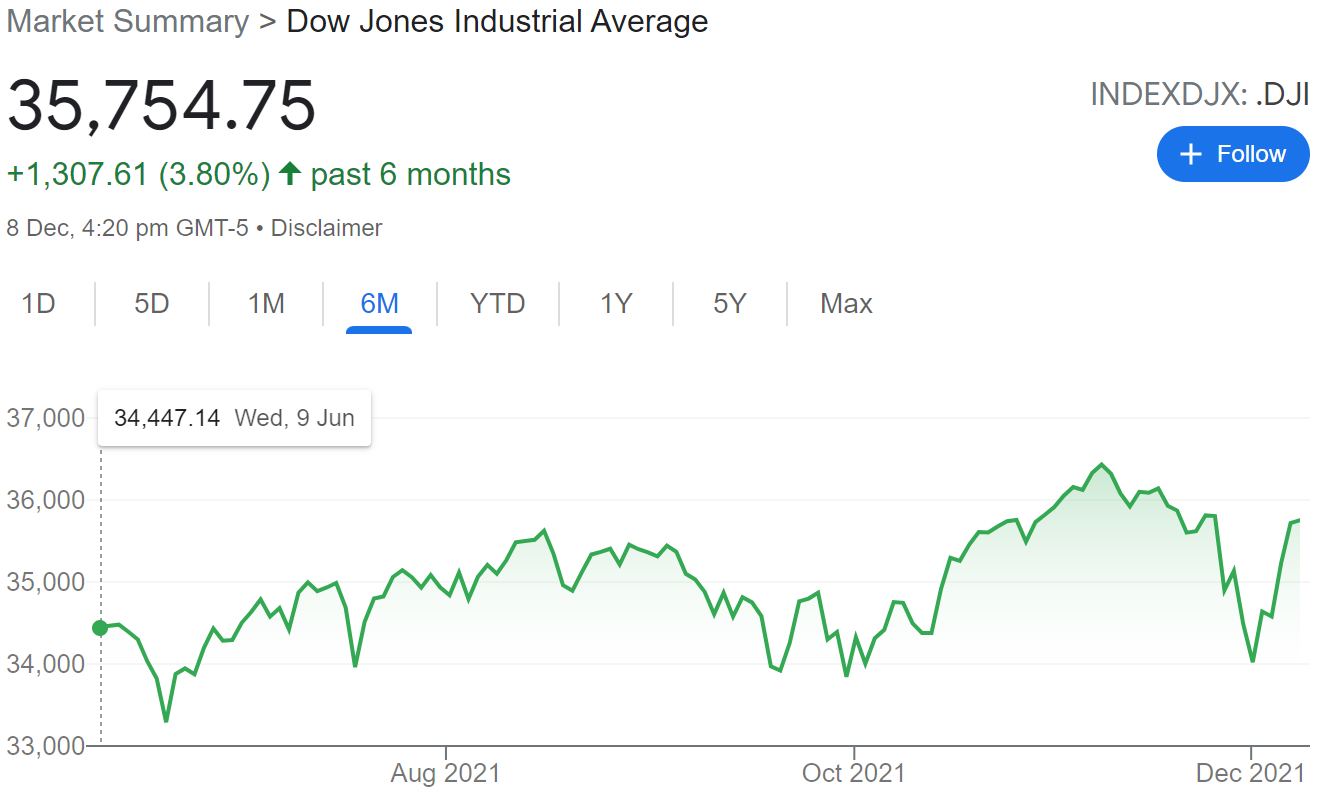
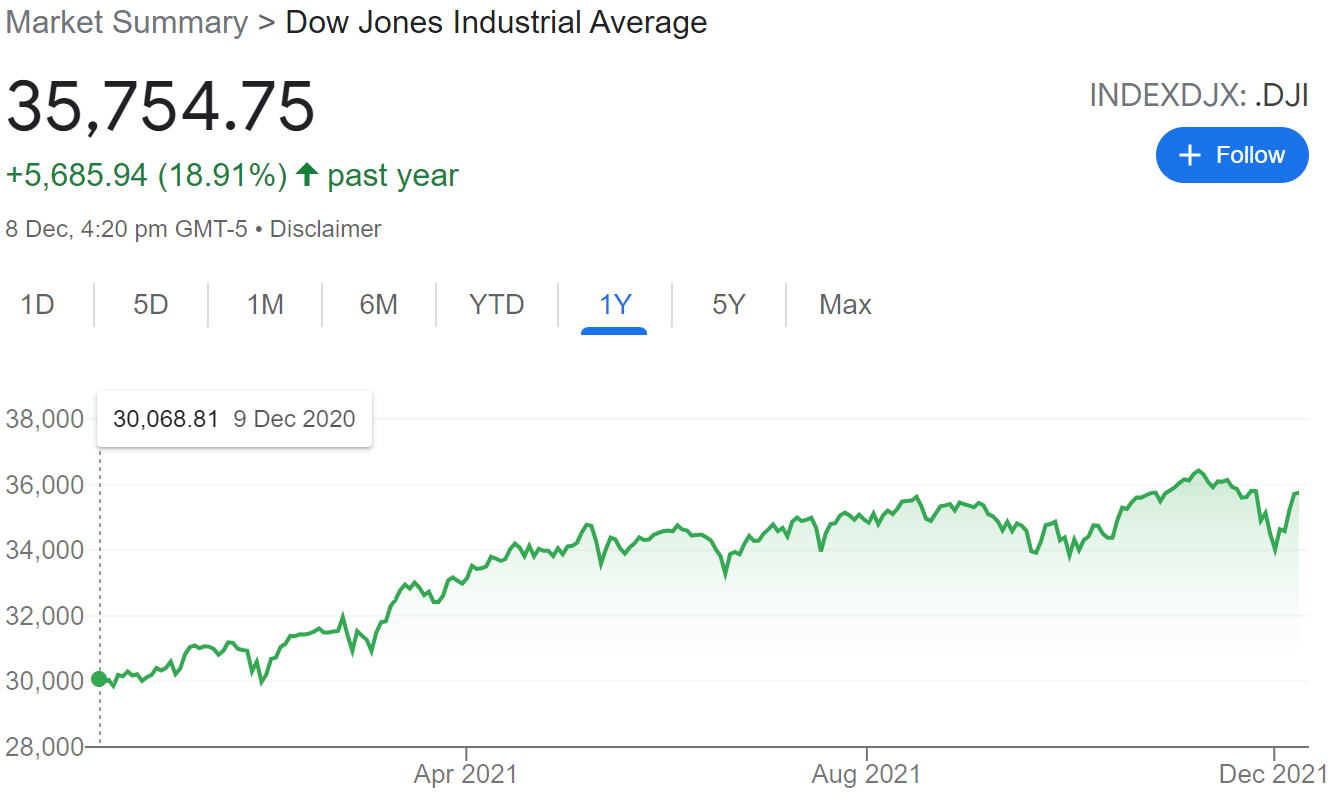
The chart on the left shows the US share market (the Dow Jones) over the last six months. The chart on the right shows the US share market (the Dow Jones) over the last year.
We have seen a bit more volatility recently (December), although it didn’t come to much over September and October.
Looking ahead, economic growth continues to be peered back, and interest rates have been rising in some countries around the world but not yet in the US.
The current talk in America is about slowing down and winding back the significant quantitative easing (referred to as tapering) sooner than was previously anticipated. This may suggest that inflation of the more permanent type may not be that far away. Inflation, of course, may mean rising interest rates, and that may lead to more share market volatility – hopefully.
In China, Evergrande, China’s largest property developer, continues to grapple with over $300 billion of debt and is still at risk of becoming China’s largest-ever default.
The company is trying to sell assets to cover debt repayments but appears to be struggling. I also noticed that management states that they have a number of “government members” on their committee for debt restructure.
This suggests to me that, whilst the Chinese government says they are not interested in helping Evergrande, they are possibly quite keen to manage the restructure process and minimise the damage to other Chinese small businesses and individuals that may be affected should Evergrande eventually slide into default.
Default is looking more likely and should that happen, it is then a question of whether the contagion effect will occur or be contained.
I still don’t see it being a global problem but nonetheless the beginnings of a notable headwind for the Chinese economy. Bad for China and possibly not good for the rest of the world either.
Elsewhere, Britain continues to struggle along, as does Europe, with New Zealand and Australia doing okay generally. These markets tend to follow the US market anyway.
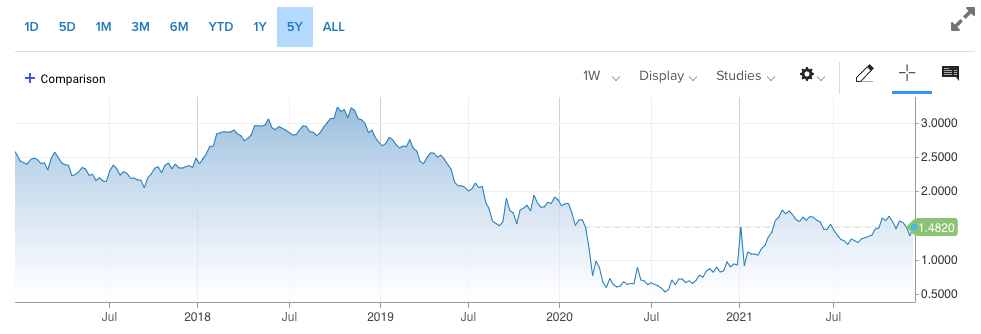
Relatively expensive trading prices and rising interest rates are two notable risks worth keeping an eye on. Ten year US treasuries is an indicator also worth watching.
U.S. 10 Year Treasury
The Global Economy
China or the United States of America?
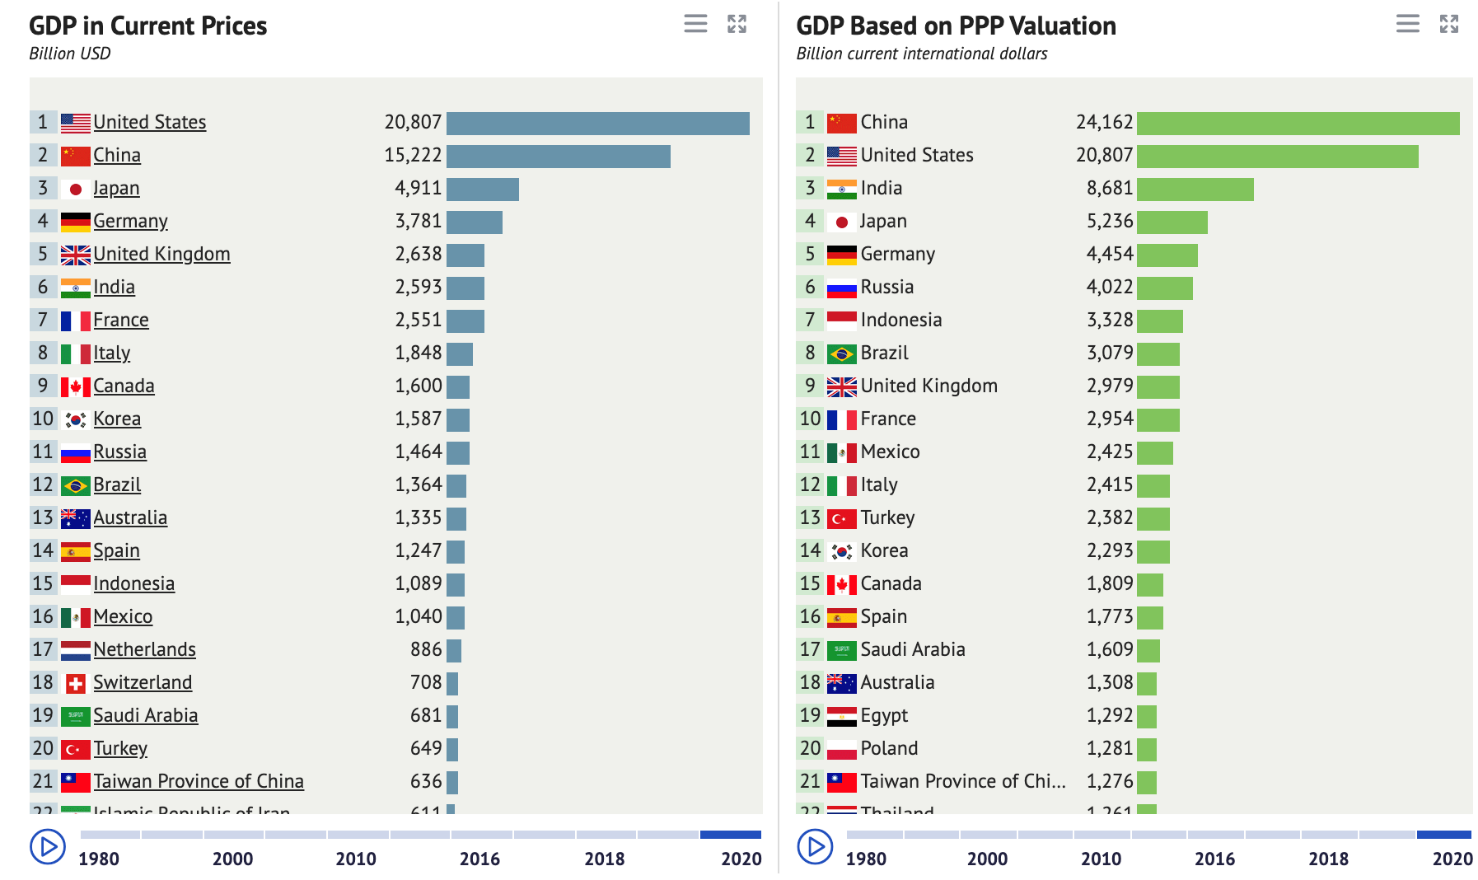
The above chart shows economic activity. The chart on the left measures gross domestic product in current prices, whereas the graph on the right measures gross domestic product on purchasing power parities. This is where the currency conversion rates are used to equalise the purchasing power of different currencies by eliminating the differences in pricing levels between countries.
Whichever way you look at it, China and the United States are clearly at number one or number two positions in terms of share economic size or power. That’s why when we think about the global economy and markets, we often look to the likes of the US and China for direction because when they move one way or another, they impact on everyone else. That old phrase from the 1980s comes to mind…”When America sneezes, the rest of the world catches a cold.”
The point here is that what goes on in New Zealand still matters too.
The usual items such unemployment, interest rates, inflation. These things should be taken into account as we invest, but also we should be thinking about what’s going on in the likes of the US and China because inevitably, significant moves from them can flow through to us right here in New Zealand.
The coronavirus would be a good example of an unexpected development that has significantly impacted our lives here in New Zealand.
Economic growth projections
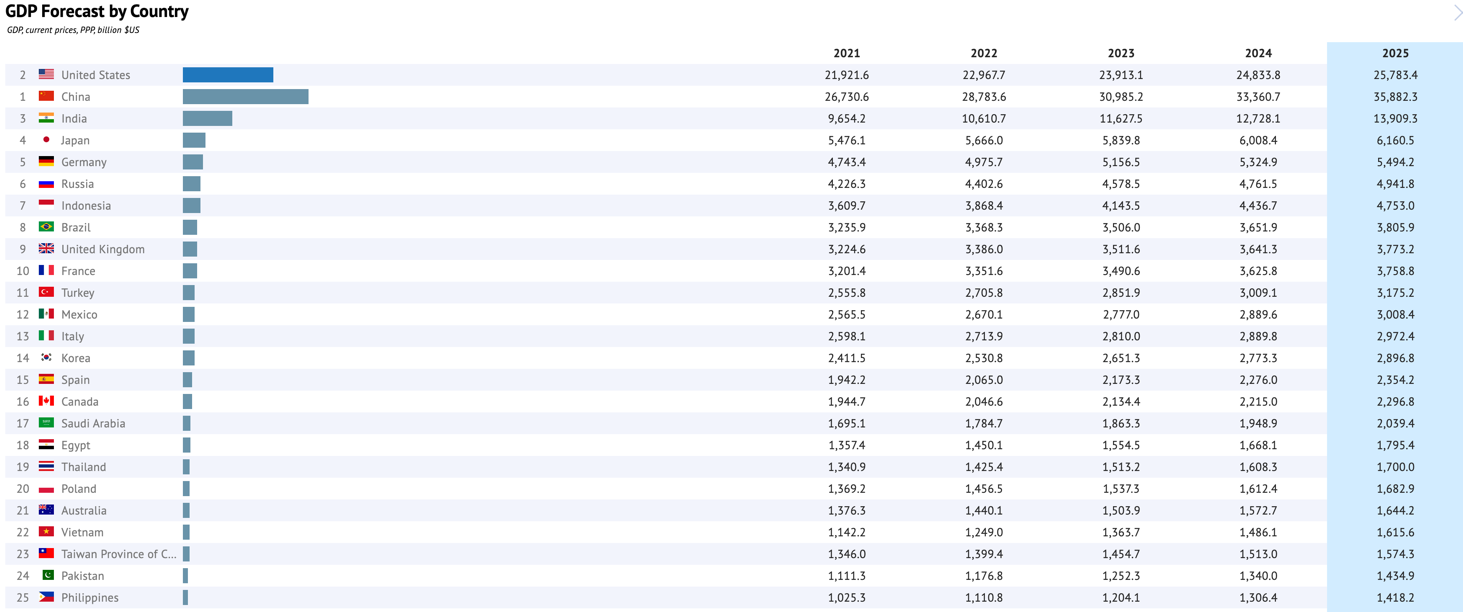
The above graph shows economic growth as measured by GDP forecast over 2021 through 2025.
One important point to note on the projection above (admittedly, it’s only a projection) is the fact that most economies continue to grow.
Whilst growth is not stellar, it is growth nonetheless, highlighting the fact that the global economy may continue to grow for the foreseeable future.
Whilst there will be swings and roundabouts along the way, that is generally good news for us all.
It doesn’t mean to say that there won’t be events along the way. Rising inflation and as a result, rising interest rates are looming. As you know, we have interest rates rising here in New Zealand right now.
A few months back, the emergence of the Delta virus rattled the markets and, more recently, the news about the Omicron variant also spooked the markets.
This provided some of the volatility that we’ve seen over the last few weeks. Notice how the market panics when this type of news first emerges, and then once it has absorbed what it means, prices get back on track generally?
As I mentioned earlier, inflation, particularly in the US, shows no signs of easing back in the near future. Inflation in the US is reaching a 30-year high, rising year-on-year at the rate of 6.2%, driven mostly by energy and food prices.
Interestingly, inflation in Germany also hit 6%, which put further pressure on the European Central Bank to modify its highly accommodative monetary policy.
Anyway, the talk from Jerome Powell, the US Federal Reserve Chairman, is now around tapering earlier than expected as a result of a strong economic recovery and inflationary pressures.
As you know, the Reserve Bank of New Zealand (RBNZ) raised the official cash rate by 25 basis points to 0.75% in New Zealand recently.
Looking ahead, the RBNZ is forecasting the OCR at around 2.5% by late 2023.
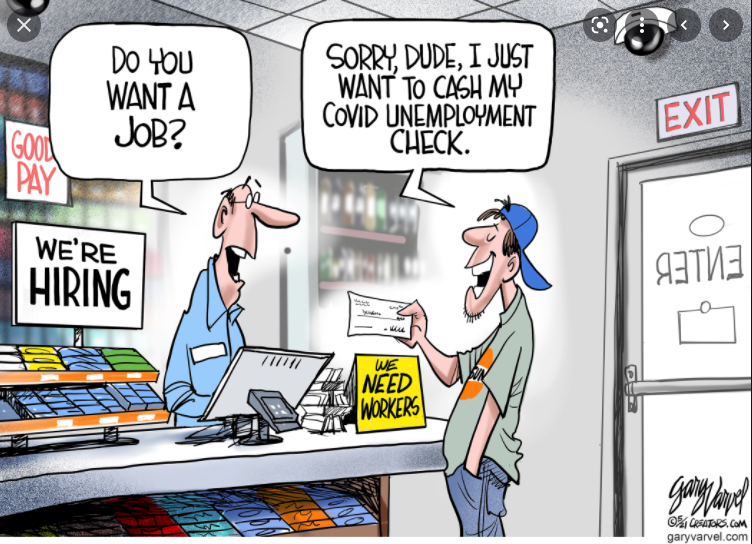
Unemployment in New Zealand fell to 3.4% in September, which is the lowest level on record. Good news on the one hand.
On the other hand, the RBNZ is now becoming concerned about capacity issues. If there aren’t enough people to fill the roles and jobs required, New Zealands’ economic wheels cannot turn as fast. In fact, this has become a significant problem in the US and parts of Europe already.
Looking ahead into 2022, interest rate rises are on the horizon. Economic growth will likely continue all things equal, supported by the ongoing vaccination rollout and accommodative monetary and fiscal support.
The United States of America
GDP – USA
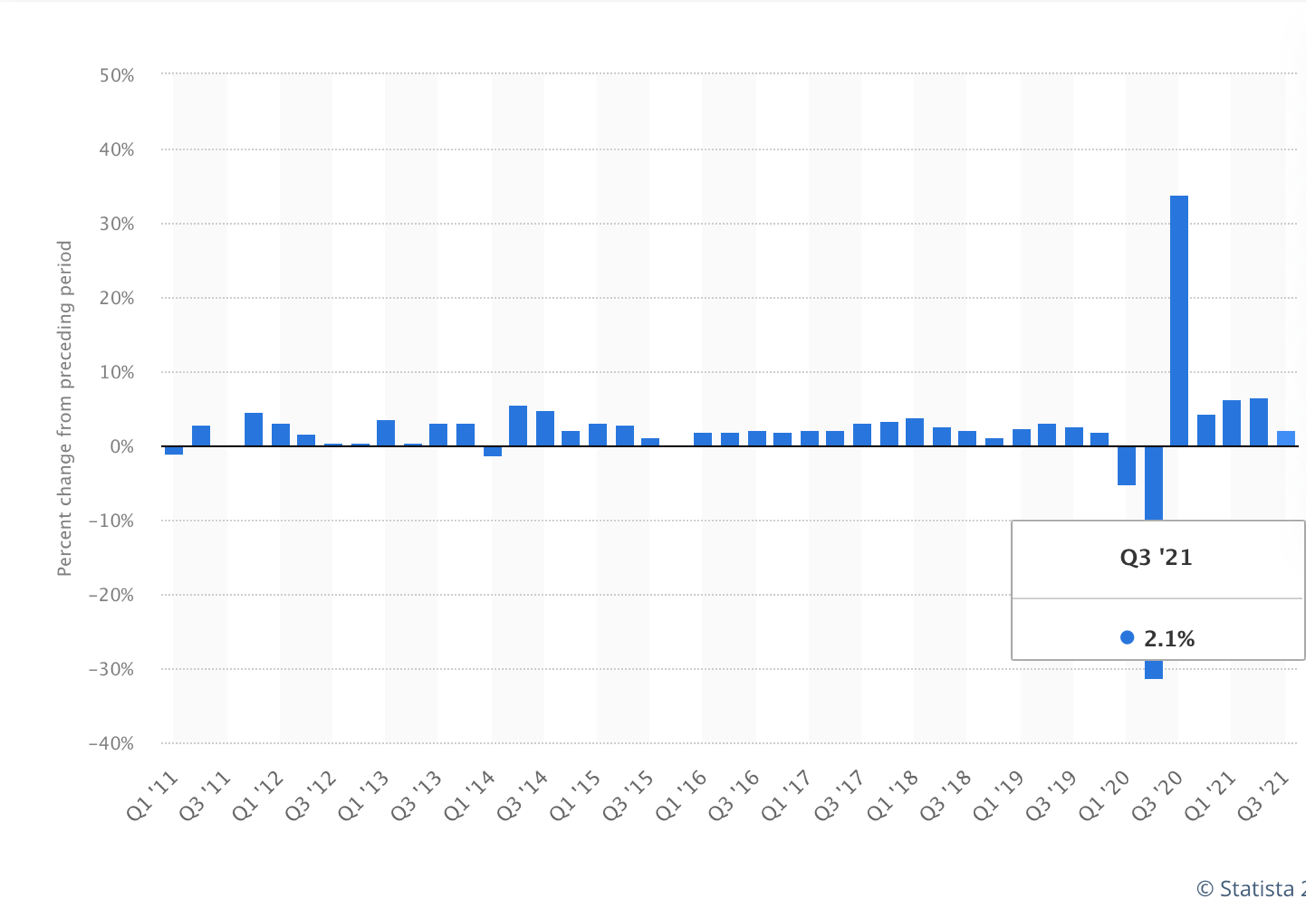
The above graph tracks economic activity in the United States of America as measured by Gross Domestic Product (GDP).
The American economy continues to grow, although forward growth projections have been peered back a few times of late. What we know about the United States of America is that, even in difficult times, it remains an economic juggernaut and powerhouse.
I have spoken many times about the unique package that makes up the American economy, matched by no other country.
Whilst China is growing at a faster pace than the United States of America, and in many ways is a worthy opponent economically, they are nonetheless different cultures and different economic packages.
Although there’s more to it, one obvious difference is the innovation that comes out of America. For example, the iPhone was an American innovation, not a Chinese innovation.
On the other hand, China appears to be able to pull together as a nation, whether it be willingly or by force to achieve objectives. I’m not suggesting that America does not, but rather that China achieves this whether it be by will and consensus from the population or other less desirable means. Their action around the coronavirus is one example.
Then there is the likes of, for example, rule of law and population per hectare – both advantages for America.
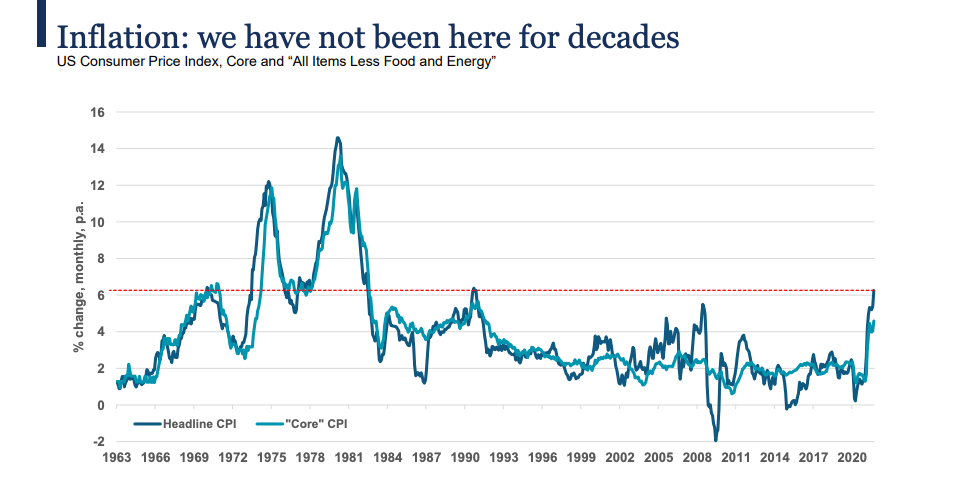
The above graph tracks inflation in America from 1963 up till recent times.
Inflation keeps coming up for discussion because it is a precursor to rising interest rates.
As the graph above shows, levels of inflation are, in fact, normalising. This is not hyperinflation.
We have had declining interest rates for over 30 years and a deflationary environment for many years. It’s only recently that we’re starting to see inflation reappear.
I regard the inflation number and announcements around inflation out of the US as an important indicator, particularly at the moment.
Anyway, as you know, the US Fed is looking to begin the tapering process sooner than expected and may also look at rising interest rates in 2022, sooner than expected as well.
If an unexpected and significant event suddenly emerged that created headwinds for the US economy, I suspect The Fed would back off from early tapering and certainly from rising interest rates too soon. We have a fragile economic recovery which is easy to derail when things don’t quite go as they should economically.
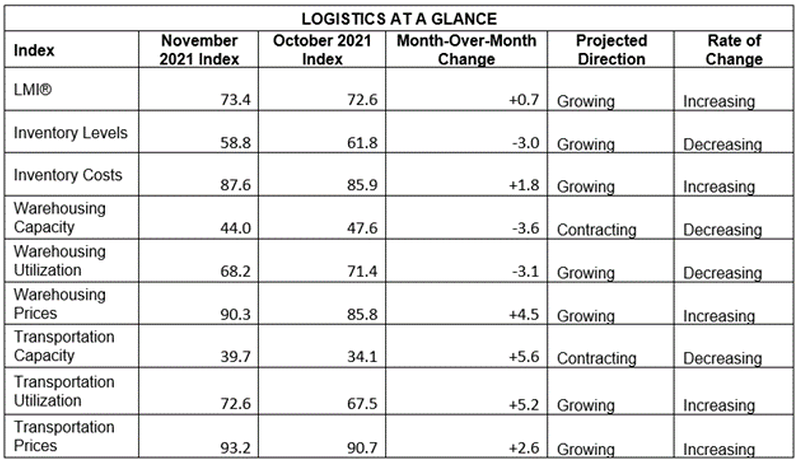
The above table looks at some of the components that make up the Logistics Managers Index (LMI).
Looking more closely at the US economy as to what’s actually going on inside it, we can see in the table above that supply chain constraints are moderately high, and yet goods are moving along the chain.
In short, inventory management remains tight, and the outlook over the next 12 months looks much the same as we can see on the graph below. This may tie in with more permanent levels of inflation possibly.
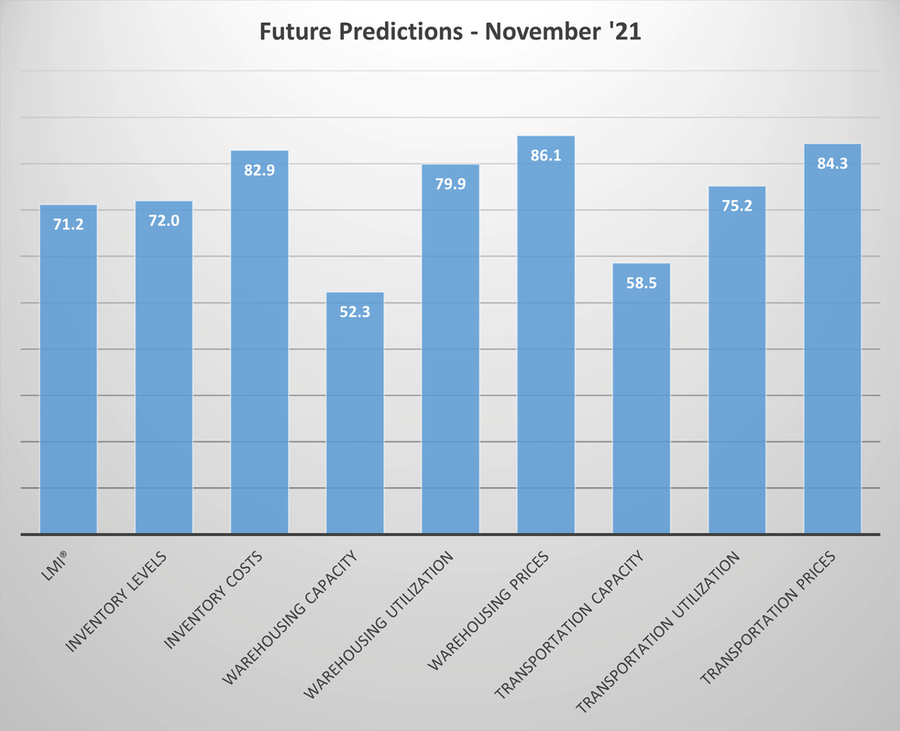
The above table looks at estimated future projections on underlying market logistics in the US.
As the graph above shows, respondents to the LMI (Logistics Managers Inventory) Survey predict that movements in the overall LMI show a growth rate prediction of around 71.2 for the overall LMI, up slightly from October’s future prediction of 70.
Some predictions have suggested that supply chains may begin to return to normal (whatever normal means post-Covid). However, we can see from the table above, that the likes of inventory costs, warehouse prices, and transportation prices suggest ongoing supply chain challenges. At least for the next 12 months anyway.
China

Evergrande continues to struggle and recently capitulated, saying that they are unable to meet their obligations. A committee for restructuring has been formed, including the chairman and founder of the organisation and members of government.
What we appear to have is a managed restructure of the business. We know too that other property developers have also defaulted, but the fallout across the markets has been contained so far.
Is there a risk that we have global problems because of Evergrande?
It is possible, although in my opinion, unlikely. That’s because management and the Chinese government appear to be working together to manage the restructure of the business, even though they are likely to be in default of some of their repayment obligations.
The next question then would revolve around whether this may create headwinds for the property market across China and, therefore the Chinese economy?
That is more likely, although the degree of the fallout and the impact on the property market and the wider Chinese economy is difficult to gauge at this point.
My information suggests that the property market across China is struggling already. Although I’m oversimplifying it, markets generally tend to keep ‘going at it’ until they can’t anymore. This is one of the unfortunate aspects of unbridled capitalism.
I’m not against progress and getting ahead. We sometimes face the problem that some participants don’t know when enough is enough. Levels of debt become excessive, and when growth slows down, problems emerge.
Anyway, for now, it’s a case of watching the Evergrande situation, which appears to be contained, at least for now.
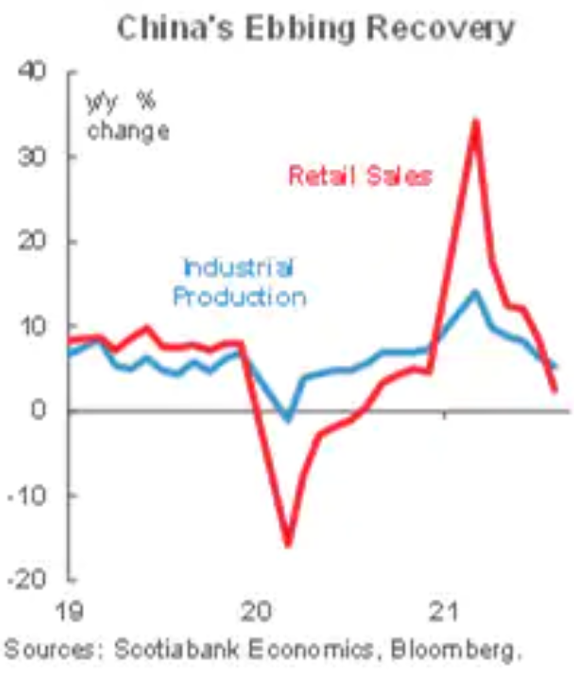
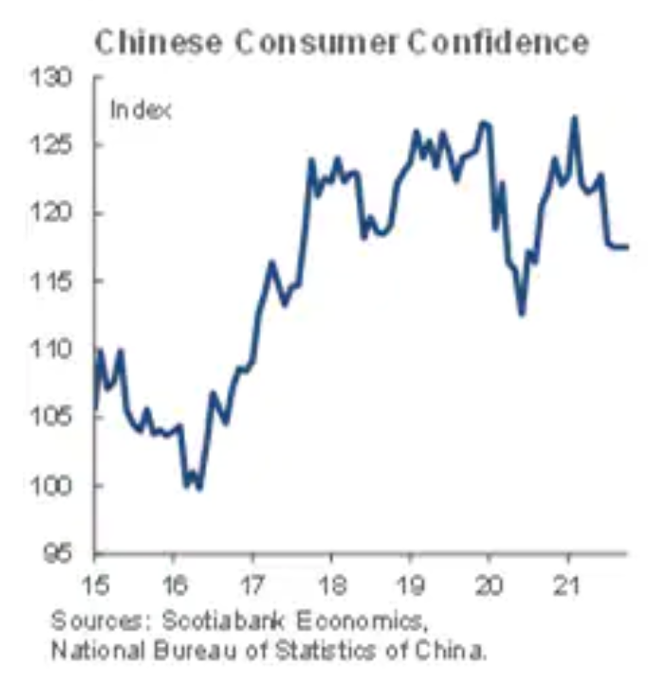
The graph to the left tracks industrial production and retail sales across China. The graph to the right tracks Chinese consumer confidence levels.
When we look more closely at the Chinese economy, we can see that there are some headwinds blowing in the face of Chinese economic growth.
- The surging and re-emerging presence of the coronavirus which results in movement restrictions.
- Concerns over the Chinese real estate market, including high-debt levels.
- Ongoing supply chain bottlenecks (like elsewhere in the world).
- Government and regulatory intervention, particularly in the private business affairs of those large businesses that we’ve seen over the last six months or so.
- We’ve also seen power shortages which may reflect the Chinese government’s efforts to reduce emissions. This coincides with high energy prices and shortages of coal.
- Some estimates suggest that real economic growth as measured by GDP may sit at around 5-6% over the next 12 months or so. This is still a good level of economic growth, providing it can be maintained in the face of those headwinds I mentioned just now.
Britain
Economic Growth – UK
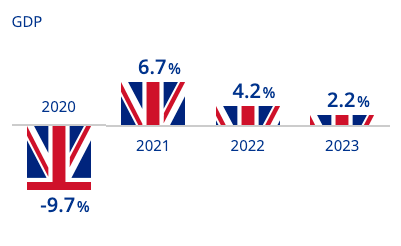
*The above graph looks at the lack of economic growth over 2020 and the projected economic growth over 2021 through 2023.
Like any other economy around the world, Britain’s economy is facing challenges because of Covid-19. Although we don’t know enough yet, the emergence of Omicron does bring uncertainties in the fight against the COVID-19 pandemic for Britain. They have strong vaccination across the population and a solid health system. Therefore, my expectation is that they will contain this latest strain of the coronavirus accordingly.
Economic growth measured by GDP is expected to grow between 1.8% and 4.2% over 2022. Social distancing measures could be a head wind.
Labour shortages have also become significant in some areas, and may also impede growth to some degree.
Notably, rapid house price growth has emerged recently, although this is expected to moderate due to rising mortgage costs when the current temporary low-interest rates fade away.
Inflation and Unemployment – UK
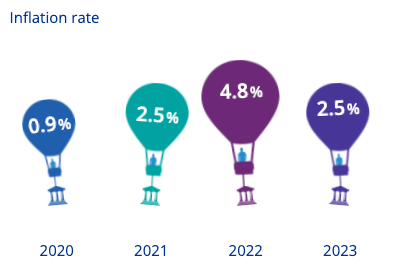
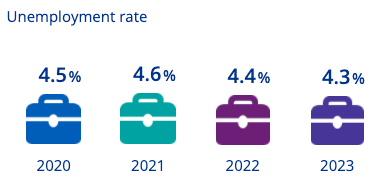
The diagram on the left tracks inflation from 2020 through 2023. The diagram to the right tracks the unemployment rate from 2020 through 2023.
Rising inflation and, therefore, rising interest rates are back on the agenda for Britain. UK Inflation accelerated to 4.2% in the 12 months to October 2021. It looks as though there are more increases on the horizon too.
The labour market has benefitted significantly from the UK government support schemes during the pandemic and the strong demand for labour during the reopening phase.
In general terms, there are jobs available for those with suitable skills, but it would appear that matching roles with the appropriate skill set has become a growing problem across the UK labour market.
Europe
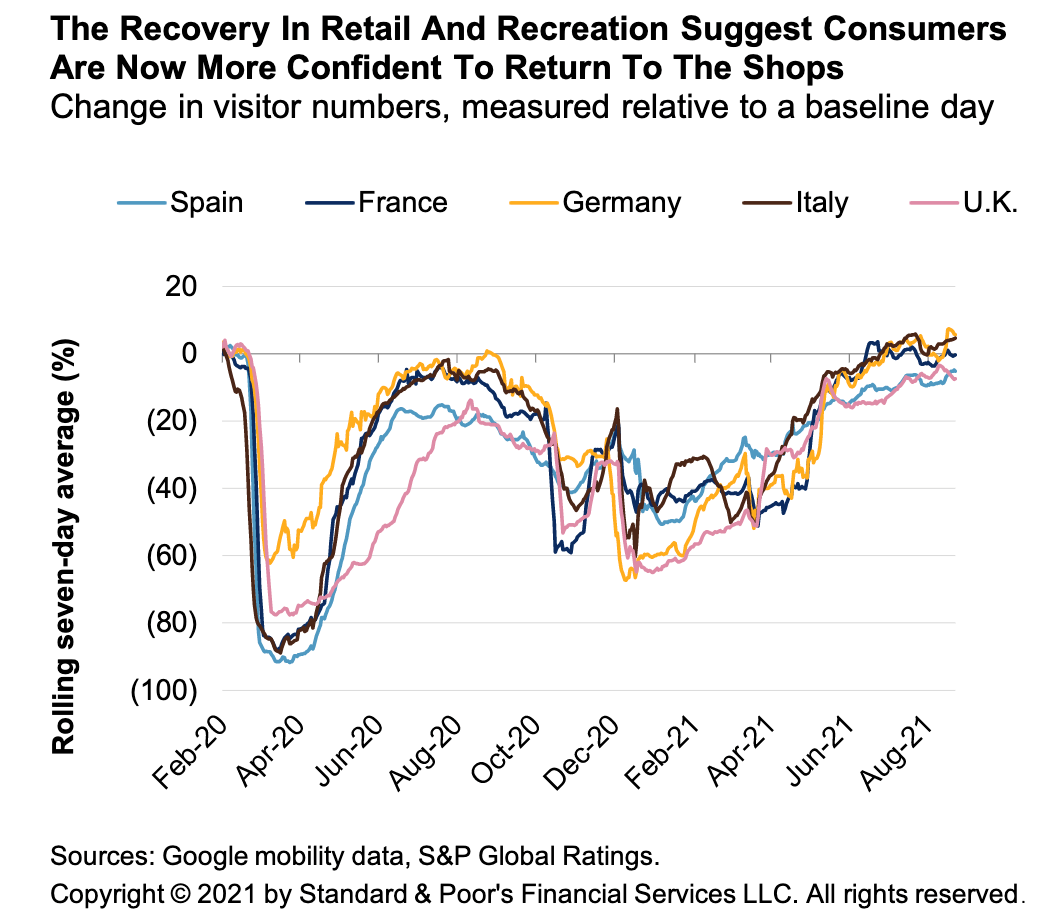
The above graph tracks retailing activity across Spain, France, Germany, Italy, and the UK.
The rebound of the European economy since restrictions were lifted in March / April this year has been strong. Both economic growth as measured by GDP and employment have responded to increased economic activity across Europe.
Like other countries, this has resulted in material shortages and rising commodity prices, pushing up inflation.
Although everyone has an opinion on transitory or permanent inflation, I suspect that we will see the transitory components of inflation dissipate over the next year or two, but more permanent inflation to remain.
Ultimately, that could see interest rate rises emerge in due course.
In the meantime, the European Central Bank is likely to continue with its asset purchase program (sometimes referred to as printing money) at least until at this stage, the end of 2023 and no interest rate rises until potentially the end of 2024.
Europe, therefore, continues to struggle along, nothing spectacular but doing okay, in general terms.
Australia
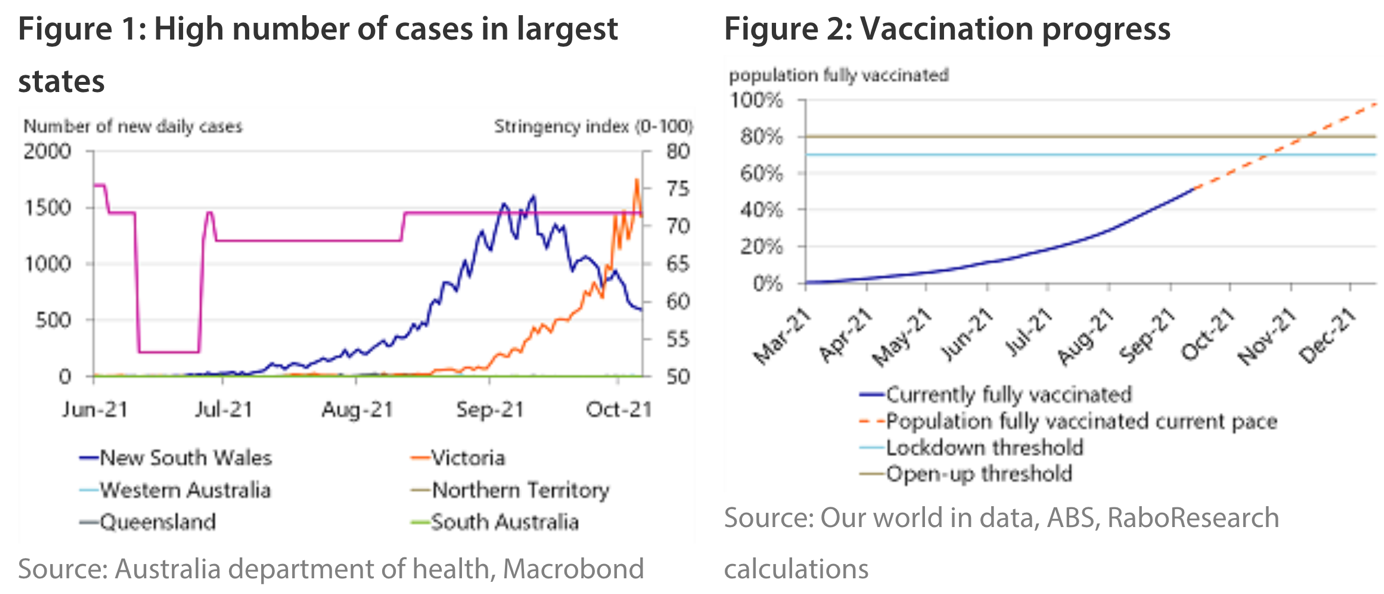
The graph to the left tracks the number of new daily cases of COVID-19. The chart to the right shows the percentage of the total population fully vaccinated.
Australia has been the lucky country for over 30 years without a real recession. The coronavirus has changed that.
The above graphs are a bit historical; however, they show the impact of vaccinations on the infection rate as the population moves about more freely. There will likely be a rebound in economic activity across Australia. However, there is one notable headwind that we need to consider with regards to Australia…
Breaking up?
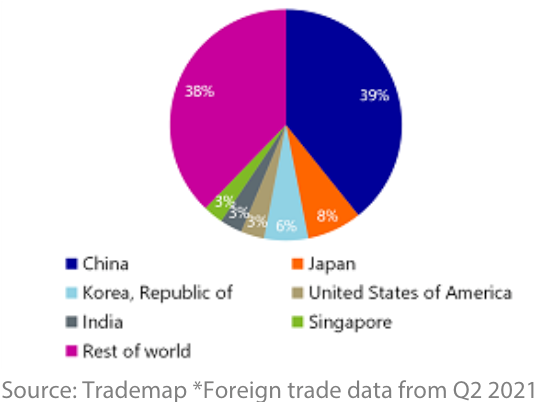
The above pie graph shows Australia’s largest trading partners.
China is Australia’s single largest trading partner. The spat they engaged in last year is old news; however, it’s not over.
China is having an increasing influence across the Asia Pacific region. However, Australia is notably absent from communications.
Last year, you may recall that relations between Australia and China worsened as China banned some Australian products such as barley, wine, lobster, and coal. Therefore, Australia has been looking to tighten relationships with other like-minded economies to increase economic resilience and protect itself against further moves from China.
Interestingly, Australia still has a significant supply chain dependency on China. Australia needs China for crucial imports such as semi-conductors, fertilisers, computers, and the like.
Currently, it’s difficult to see the way ahead with the Chinese / Australian relationship. I note that Australia, however, is still exporting large amounts of iron ore to China. I suspect that will continue as long as it suits China. Anyway, this is an interesting situation because it is close to home.
As the impact of COVID-19 falls away and vaccination rates continue to rise, everyday Australians will get back to some sense of normality, as will the Australian economy to some degree.
One potential risk to the Australian economic recovery is the reduction in covid-19 related ‘disaster payments’, which could impact the recovery.
Australia is a commodity-rich economy and is able to benefit from a large global shift in activity that seems to be unfolding internationally. However, Australia will be walking the relationship tightrope between its existing ties with China and its other relationships with Western countries.
New Zealand
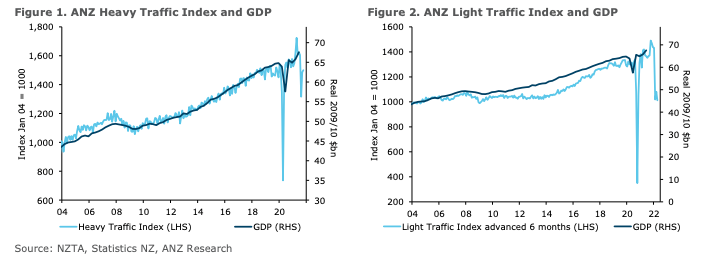
The graph to the left is the heavy traffic index showing the movement in heavy traffic items. The graph to the right is the light traffic index showing the movement in light goods around New Zealand.
New Zealand was reasonably well-placed heading into the coronavirus with low unemployment, low interest rates, good levels of economic activity and support from the New Zealand Reserve Bank. The sharp disruption across markets and the New Zealand economy was not something that many expected. Although these types of events always affect different people in different ways, the tourism and hospitality sectors were among the hardest hit. The impact of the coronavirus on these sectors continues today.
Confidence index – NZ
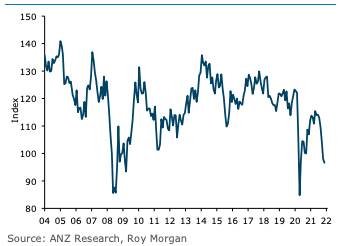
The above graph tracks the level of confidence across New Zealand.
Whilst there are some positives, there is also the increase in living costs which have notably outpaced wages growth. This means that many households are actually going backwards in real terms.
Some commentators have suggested that this indeed is what has pushed a number of people into the workforce as living costs have increased, and the need to fund those increased costs has gone along with it.
So, nominal wages have shown growth, although wages growth is still slightly negative in real terms ( after rising living costs). However, taking the nominal wages growth together with the growth in employment, we still have a positive situation on balance.
Net Migration, projection
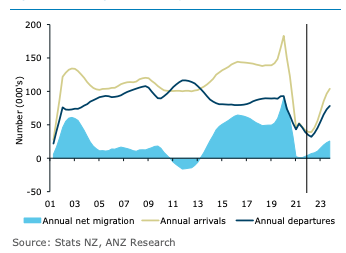
The above graph shows annual net migration along with annual arrivals and annual departures. It also provides a brief projection into 2023.
Obviously, immigration has been very low and stable, with borders closed into New Zealand.
2022 will likely be different, with many Kiwis waiting to head overseas once they know that they will be able to return without having to go through the drama of MIQ penance.
Although it’s difficult to see what they might be, some government policy changes to immigration could restrict the number of migrants to New Zealand. Some argue that the so-called housing crisis in New Zealand is partly because of unbridled immigration. Everyone has an opinion.
Anyway, depending on the mix of government controls and other flows of travellers, there could even be a net outflow of people over 2022 potentially. It is not ideal from an economic growth perspective, but it may appease those who believe immigration is the cause of rising house prices.
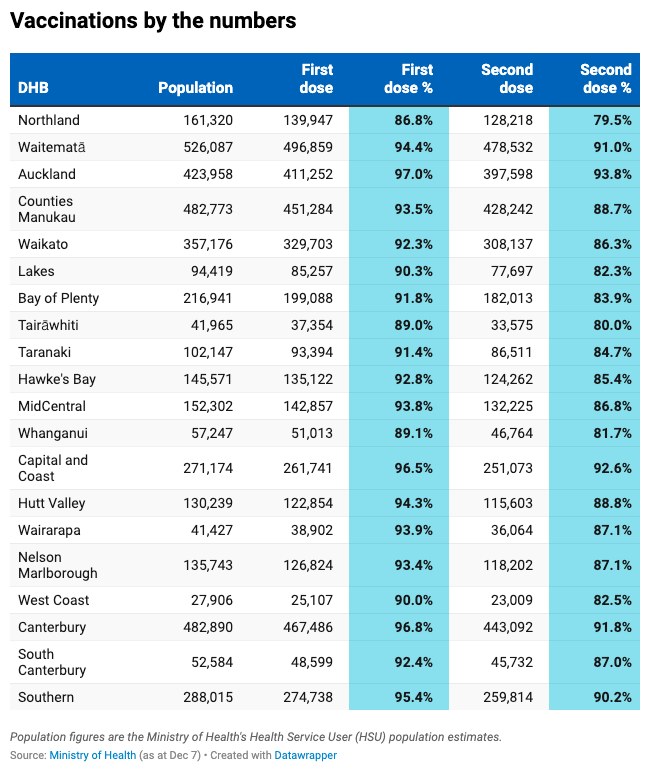
The above table shows vaccination rates across New Zealand. In short, we are getting close (within days) to reaching the much publicised 90% vaccination rate here in New Zealand.
Although vaccinations are not everyone’s cup of tea, they help stabilise the hospitalisation situation and help maintain a sense of order across healthcare services. It would be unfortunate if a seriously ill cancer sufferer was unable to receive proper, timely treatment because another individual was taking up a bed because they were unvaccinated. Life insurance is about the people you love. Are vaccinations about caring for others? I’m not suggesting I am for or against vaccinations – just pondering a question …
To Summarise …
As I reported last month, the global economy continues to grow out of the coronavirus pandemic recession. All things equal, we are on track for ongoing recovery. The US economy continues to progress well.
China has also been making good progress, although headwinds in the property sector could potentially slow down China’s strong economic growth. Evergrande is one example of the problems that the Chinese property market is confronting. However, with government members involved in the management of the business and debt restructuring in that sector, it is possible that there may be an orderly restructuring with perhaps more protracted challenges that are less severe in the short term.
Europe continues to struggle along. It is interesting to watch the build-up of troops along the Ukraine border. Difficult to know right now whether this is simply a test from Russia’s leader, Vladimir Putin, or whether indeed he’s spoiling for a fight. Likely, the former but difficult to know for sure.
The argument between China and Australia continues, and one imagines that the longer it goes, the longer it will continue. Interesting because Australia is right next door to New Zealand.
New Zealand is generally tracking okay. Interest rates are rising, and growth continues in New Zealand. Unemployment is low. Property prices or rather property price rises have been mixed of late, but generally, residential property prices continue to rise.
It will be interesting to see what policies the government applies to immigration into New Zealand over 2022.
More specifically, looking at the markets, rising interest rates to me, would appear to be the biggest item on the agenda at the moment when it comes to risks around trading prices.
I still don’t see a sharp, significant increase in interest rates. My best guess would be another 1-3% on current mortgage rates over time. However, the central bank will need to be careful because New Zealand’s economic recovery whilst underway now is nonetheless somewhat fragile.
As 2021 draws to a close, the New Zealand economy is tracking reasonably well – steady as we go for now.