September and October and A Market Correction?
Monthly Market and Economic Update – August 2021

Peter Flannery Financial Adviser CFP
“If you have one economist on your team,
it’s likely that you have one more than you’ll need.”
Warren Buffett
Key Points:
- What could trigger market volatility this September / October?
- The inflation debate continues.
- Have mega tech stocks had their day?
- The Delta virus is spreading. Will it hurt the global economy?
- China’s crackdown on tech companies.
THE MARKETS
September’s coming…is that a problem for you?!
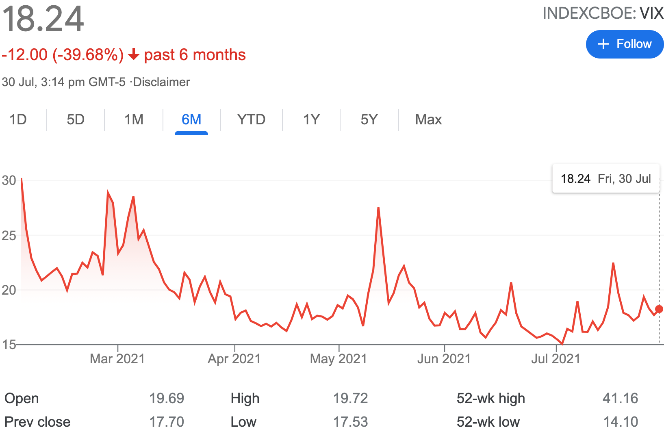
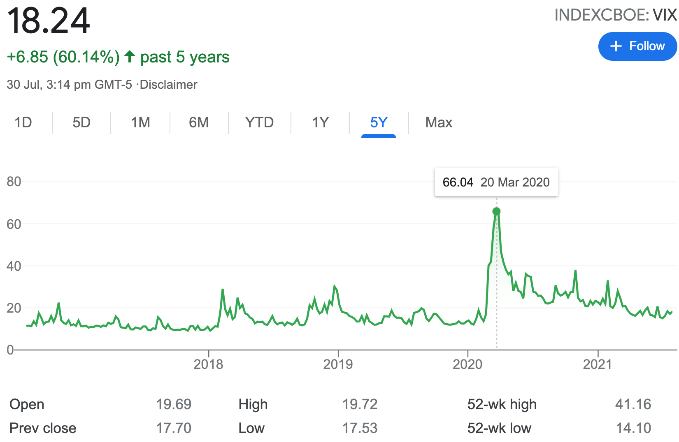
The Cboe Volatility Index or VIX measures market volatility – sometimes known as the fear measure. The graph to the left ( the red line) tracks the VIX index over the last 6 months. The chart to the right (the green line) tracks the VIX over the last 5 years.
Markets, particularly the US market, are becoming increasingly focused on triggers for a correction. There’s nothing new really in the market being almost obsessed with trading prices although of late, particularly over the last month or two, we have seen a slight uptick in the fickle nature of the already fickle market.
For example, China’s unexpected and significant crackdown on many of China’s largest tech companies has created a degree of uncertainty across the markets. Companies such as Alibaba, arguably a very sound business, have seen their trading price drop from around $300 per share down to $170 per share over the last 12 months (more on that later).
Other Chinese companies too such as JD.com, Tencent, Didi Global and a number of others have also seen significant trading price declines as the communist party appears to wield its big stick, as if to let large tech companies based in China know who really is the boss – what do you make of it?
Getting back to the VIX, some see this as a possible indicator of what might be coming up over the next 30 days, although I would be reluctant to look at it that way.
To me, it is a historical measure of volatility and it’s interesting, but not something for me to think of as a forward-looking indicator.
For that, we’re better off I believe to assess the underlying economics of each business in which we invest. That way we have arguably a more reliable way to assess that rare certainty around future profits. Indeed, the VIX to me is a bit like the significant amount of financial analysis that comes from the balance sheet and the income statement of large, listed businesses every quarter. Interesting but of course historical.
Whilst the markets are not wrong about everything, it is important for us to remember that the market is a multi-faceted entity going in all kinds of directions for lots of different reasons.
For example, a sharp correction across the markets may bear little relevance to the businesses that we invest in fundamentally, even though the trading prices of pretty much everything across the board declines, driven by overall market sentiment.
Similarly, when markets are feeling happy, it’s generally for reasons that are quite valid (e.g., an unemployment number, interest rates stay lower for longer, economic growth is better than expected…) but as interesting as it might seem at the time, not necessarily an indicator that is deserving of any more credibility over other analysis / indicators that may offer better clues as to what’s coming.
September is typically a month when the US market dives.
Some argue it’s because some participants across the US market are cashing up some of their shares in order to pay tax. Others suggest it is all about the portfolio rebalancing that takes place this time of the year. Anyway, I imagine if I was to outline the charts and graphs, drilling down in some detail about how this has transpired in the past, you might be convinced that, because this looks a bit like a pattern out of the past, it is something to be concerned about this coming September?!
I know a number of my clients prefer numbers rather than words – the evidence!
By some measures, the Dow Jones Industrial Average has averaged a decline of 0.8% over the month of September in the past, while the S&P 500 has averaged a 0.5% decline during the month of September.
April it would appear, is often the best month from a market pricing perspective. So, what does this mean anyway?
Not much actually. I mention it because it’s ‘out there’ and the reasons given range from, a rebalancing for some fund managers at that time in order to take advantage of any tax losses, some investors take advantage of a vacation before they return to work from summer holidays (minimal trading), some fund managers have their financial year end at the end of September, which can also mean some rebalancing or selling out of losing positions prior to the 30th of September each year.
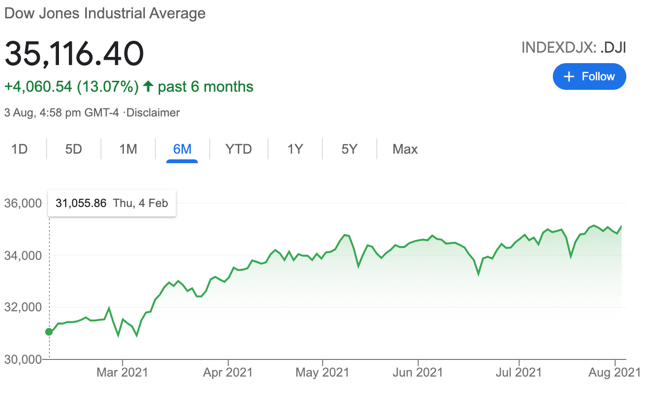
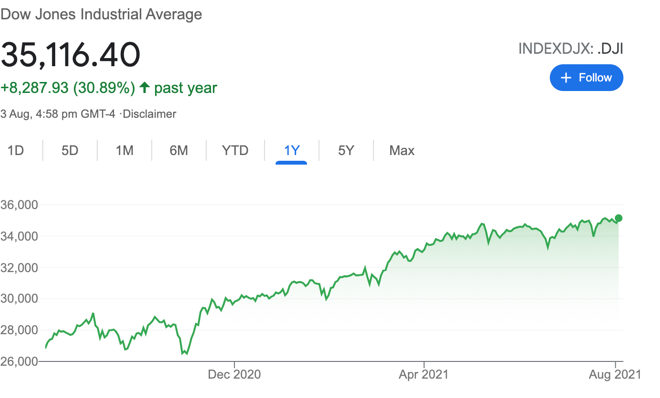
The chart on the left shows the US share market (the Dow Jones) over the last six months. The
chart on the right shows the US share market (the Dow Jones) over the last year.
Markets continue to rise, albeit in a more fragile way it seems to me – can you sense it?
I’m not concerned about a 10% market correction which could indeed turn up tomorrow for all we know.
Let’s face it, those market corrections that suddenly erupt are difficult to predict because of the complexity in markets, the number of participants and the fragile nature of market sentiment that can have a significant impact on trading prices and markets, pretty much in a blink of an eye.
So what should we be thinking about?
Whilst it could be something other than what we’re looking at, obvious indicators would be the likes of:
- FED Tapering – slowing down or stopping the quantitative easing that is currently underway to the tune of US$120 billion per month.
- A spike in inflation causing…
- A rise in interest rates. Indeed, the mere mention of rising interest rates could be enough to sink the markets.
- A miss on the unemployment front whereby employment growth or unemployment decline disappoints the market.
- Earnings across the market start to ease back and reduce. This could be a signal also for the market to decide that it’s time to bail, lock in some profits, and look elsewhere.
- Perhaps less likely is the Delta mutation of the coronavirus. Although it is in the news and we have seen some surprising increases in the infection rate in different parts of America and around the world, as the US Federal Reserve Governor Jerome Powell reported recently, it’s not having a significant impact on the American economy at the moment. Something indeed they will be watching very closely and of course, an item that I imagine will be keeping them from pressing the rate-rise button anytime soon.
But what about inflation?
Inflation has been well-canvassed across the markets. I think that some are suffering from inflation news fatigue!
My view is that overall, current inflation, whilst it has spiked, is transitory (temporary). Notwithstanding this though, things can change and there could be some inflationary forces that emerge that are not evident right now but could show up in say 6, 12, or 18-months’ time. That won’t mean that the Fed is wrong in what they’re saying now. Just that, things may have changed by then.
Against that backdrop though is those deflationary forces that I have mentioned in the past which relate to the digitization of the global economy. In a good way, it does in some areas help to increase productivity, but is quite deflationary as it carves out humans and other infrastructure from the process being disrupted.
More medium term though, as has been the case throughout history, we will “pivot” as they say in the modern vernacular, meaning that we’ll simply upskill and be employed doing different jobs or own and run businesses that add value in a different way.
In the midst of all of that is this disruption that I know we keep hearing about. I suspect it’s early days yet for disruption. Disruption is good for some but not so much for the disrupted!
But what about taking profits and leaving them to one side for a while and just wait?
This is a market timing tactic that is deployed widely across the markets. Interesting because it does not always work out favourably for investors.
As business owners though, we’re less inclined to adopt this tactic (unless you really want to).
Although a simplistic analogy, it’s a bit like a farmer deciding to sell off some land or some of his stock because he’s had a bumper year, put that money in the bank (from the stock and land sales), wait for things to drop, and then buy again.
It’s a nice-sounding idea however when you get into the practicalities of it, it becomes less appealing. Simply, the cost of transactions is one issue although not a major when investing in direct shares as you’ll know. Still, it’s not free.
The real dangers revolve around the timing. Firstly, getting out too soon and missing out on market gains and getting back in too early or too late, which is difficult not to do when you’re attempting to second-guess a fickle market.
It’s not that it can’t be done. It is that those who are tempted can be successful, but just as often not. Where does that leave us at the end of the day do you think? Better off or worst off?
But what about mega tech stocks in the US?
We talked previously about the notion of rotation out of big tech into value sectors such as energy, health care, and for example, travel services. Again, like many things, it’s not difficult to validate the argument.
It is a question though of whether or not it’s right in the fullness of time.
Simply, when we’re investing in good businesses, we’re not just focused on what the market is saying (the noise) or the trading price.
Of course, some investors do start to feel edgy at times. Funnily enough, this can happen when prices decline and that part of our brains, the amygdala, kicks in – fight or flight!
Amusingly, this also in a different way can happen when prices appear to be rising too fast.
In short, at WISEplanning, we are focused on the underlying business which of course does take into account the financials but also those all-important underlying business economics.
Therefore, a bit like the farmer taking the long-term view: we are less likely to be rebalancing, taking profits, buying and selling, attempting to outsmart an emotive market. Hopefully, you can see how illogical that can be.
Admittedly, it does take a certain mindset to ignore the noise and to stick with the methodology that we know works – even if almost everyone else is telling us it won’t work.
Fortunately for us, facts don’t cease to exist because others either don’t know about them or choose to ignore them.
Let’s keep the focus where it should be….
The Global Economy
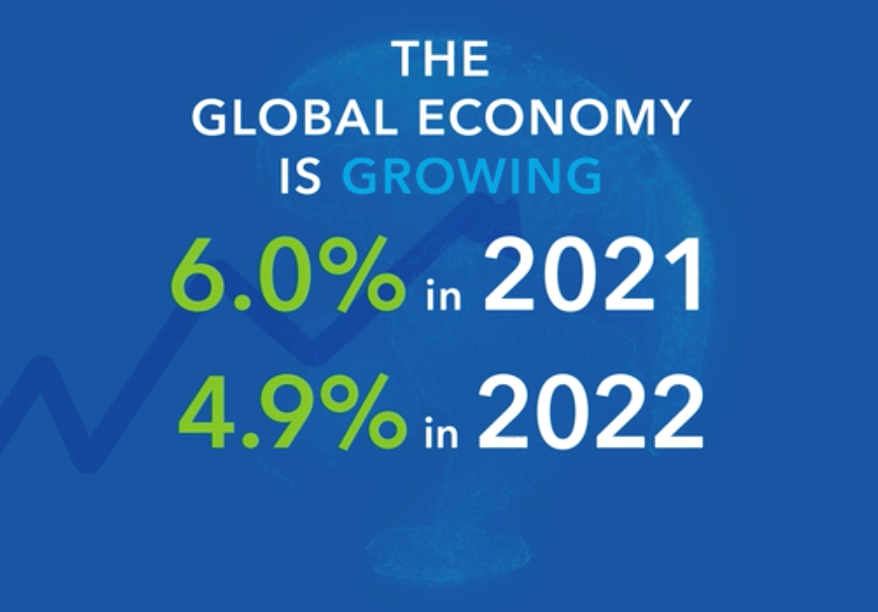
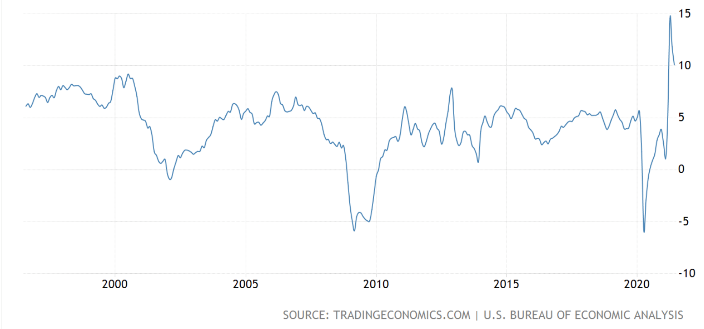
The above image shows economic growth for 2021 and 2022 is projected to track positively.
The global economy continues to emerge from the coronavirus pandemic recession. The coordinated efforts from central banks around the world appear to be working as economies across the world emerge from the recent recession.
That said, there is a clear picture of disparity between those developing economies that may struggle to recover more slowly and the more advanced economies that are progressing steadily.
In simple terms, it is a game of two halves so to speak. So, whilst there are some countries progressing favourably, there are others for whom it is not so easy.
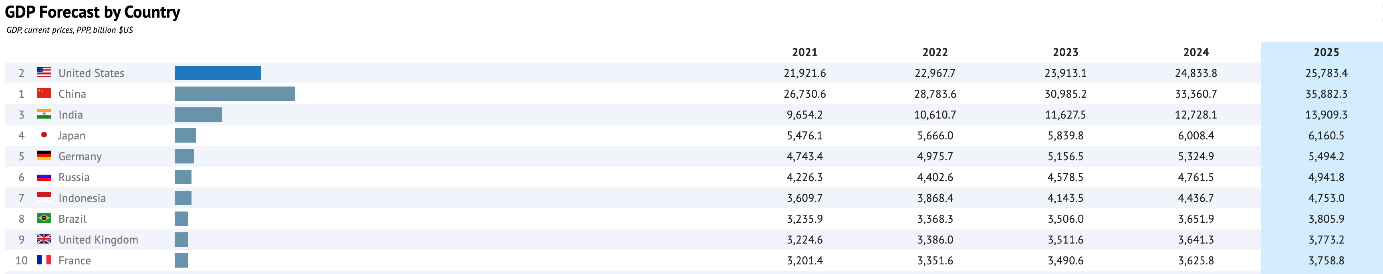
The above table provides economic growth forecasts up to 2025 (this data was released in March 2021).
As you know, estimates are not guarantees however they do provide some guidance as to where things might be heading generally.
For the global economy, growth appears to be continuing which overtime of course is positive for market prices and your investment portfolio.
I highlight this here because it may help to see beyond the current noise about inflation, interest rate risk and the recent emergence of a more determined coronavirus mutation that is looking difficult to shake off.
Jerome Powell, the US Federal Reserve Chair mentioned in a recent update that their information suggests that, whilst infections related to the new Delta virus will increase in the near term, they don’t see a significant impact on the US economy as a result.
Inevitably, it appears that the rollout of the coronavirus vaccine will help to contain the virus. Sure, nothing is guaranteed and there is noise around the fact that mutations may not necessarily respond to current vaccines. It’s equally possible though that the current vaccines with some tweaking can be adjusted to be effective.
Inflation – USA
There has been significant material generated about the inflation debate. Is it transitory (temporary), or here to stay and ramping up?
As you know, I am in the transitory camp because, whilst we have seen a significant spike in inflation, the data that we read pretty much points to pent up demand because of the coronavirus pandemic recession.
We can see this through significant sales of motor vehicles and other manufactured goods. For example, even the price of second-hand vehicles in the US increased by circa 30% since the pandemic started. We also see some of the same evidence with second-hand vehicles here in New Zealand as well.
Anyway, the short of it is that those deflationary forces in an increasingly digitized global economy likely mean that recent spike in inflation, which may take 12 to 24 months to dissipate, may become less prominent as the economic recovery continues to progress.
It is important too to bear in mind that some of the recent data showing large gains (e.g. economic growth, share prices), when compared to the significant contraction in economic growth over 2020 means that there is a ‘catching up’ going on rather than hard core inflation. For example, an increase in travel by 30% sounds significant until you take into account that it’s coming off a very low base.
Another important and interesting piece of data is wages growth…looking around the world, whilst there may be some sharp rises in wage costs in some sectors, overall wage growth appears within the range of normal measures. Nothing much to see here just yet.
Also, unemployment generally remains somewhat high compared to pre-pandemic unemployment rates.
Further, if we look at the employment support measures that have been put in place around the world, a number of those are coming off over the next 3 to 6 months which could also provide some deflationary impact.
That said, this whole event means that we are in somewhat unchartered territory and so the way ahead is not totally clear, although there don’t appear to be any obvious outliers that we need to be concerned about as investors right now.
The global economy remains intact, continues to function properly and continues to grow.
The United States of America
Inflation – USA
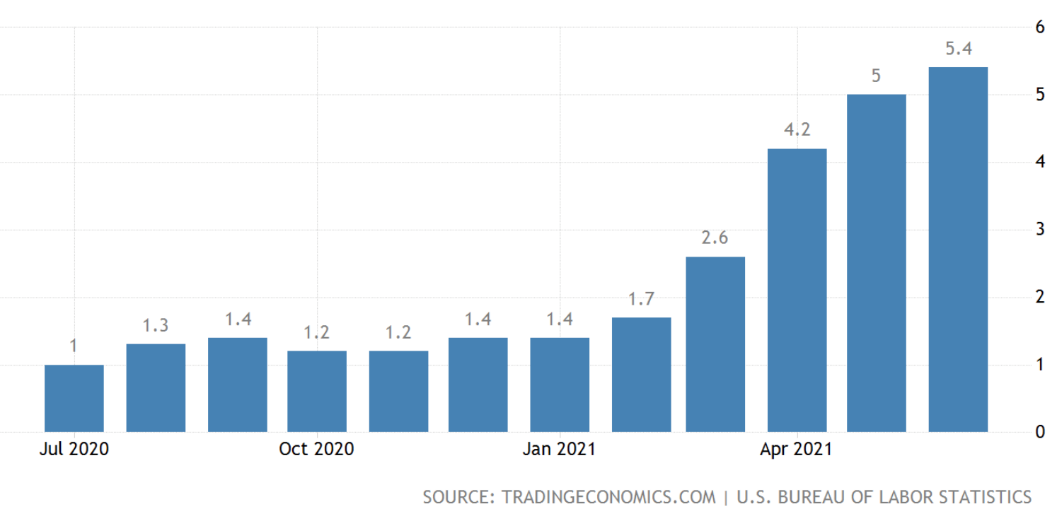
The above graph tracks inflation from July 2020 up to June 2021.
Inflation in America has spiked upwards however at this stage it looks transitory (temporary). This debate continues around the world however, the evidence that looks most credible suggests the spike in inflation is a result of supply/demand imbalances as a result of pent-up demand as the American economy (along with other economies) powers its way out of the pandemic recession.
Wages growth – USA
The graph to the left measures wages growth in America over the last 25 years. This provides some perspective as to what’s currently underway now. The graph to the right tracks wages growth over the last 5 years.
Increasing wages can lead to potentially strong and sustained inflation which of course is why the market watches this number closely. However, at this stage, it would appear that the spike is somewhat of a catch-up from the contraction over the pandemic period. Obviously, if this spike in wages growth continues strongly, then this could suggest that those other transitory factors are only part of the picture as wages growth possibly overrides those other temporary inflationary factors. This is a possibility but not likely at this stage. I will keep you posted.
The US economy continues to progress with increased political stability at the helm, possibly helping to contain the coronavirus earlier than what otherwise might be the case. That said, different states appear to have different views on their approach. For example, some states are making mask wearing both inside and outside mandatory whereas other states are not.
Such is the United States of America!
China
Economic Growth (GDP) – China
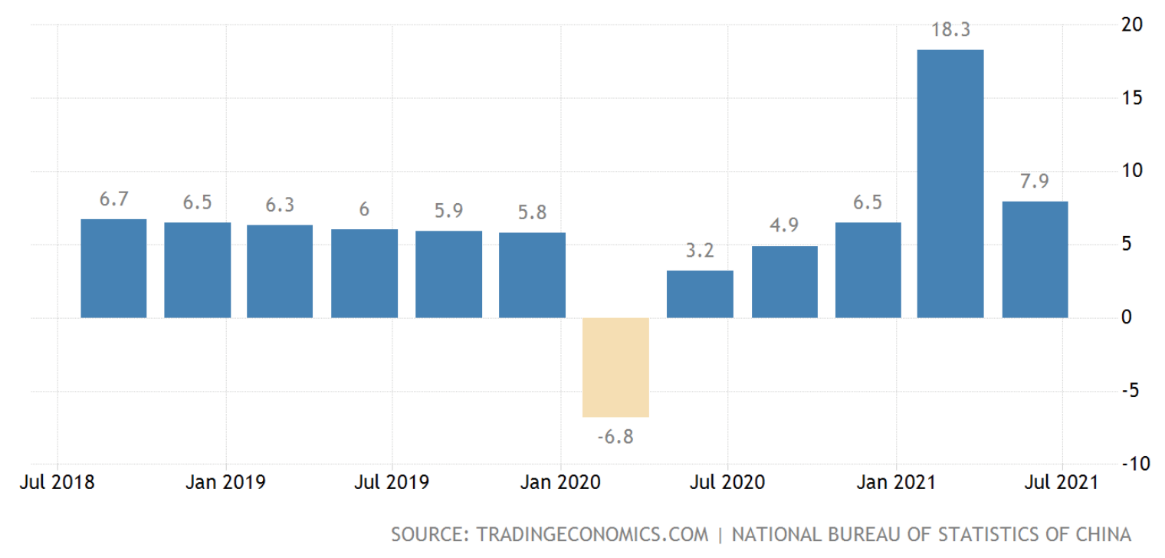
The above graph measures economic growth in China from July 2018 to July 2021.
Economic growth in China continues, even though it has dropped back from the significant growth seen in the first part of 2021. This decline in economic growth is of little concern given the significant increase that was actually making up for the contraction over 2020.
China’s economy is the second-largest in the world by some measures and has been recovering strongly since the second quarter of 2020, helped by strong overseas demand and foreign exports. Growth has been sliding down as a result of some easing of manufacturing activity, increased raw material costs along with some supply shortages.
It seems likely that the pent-up demand supporting growth recovery may subside, giving way to weaker economic growth in the future.
The Central Bank in China must have some concerns about the slow down or more specifically the growth trajectory of the economy moving forward, because it reduced the amount of cash banks must hold as reserves recently, to help stimulate the economy.
Although time will tell, one analyst recently estimated that the 2-year average economic growth rate for the first half of 2021 would be 5.0% – 5.5%, quite a bit below the pre-Covid-19 levels of 6.0% – 6.5% achieved in 2019.
Regardless, China’s economy is strongly managed by the Chinese government and the Chinese central bank and continues to grow (one way or another).
Europe
Economic growth and inflation – Europe
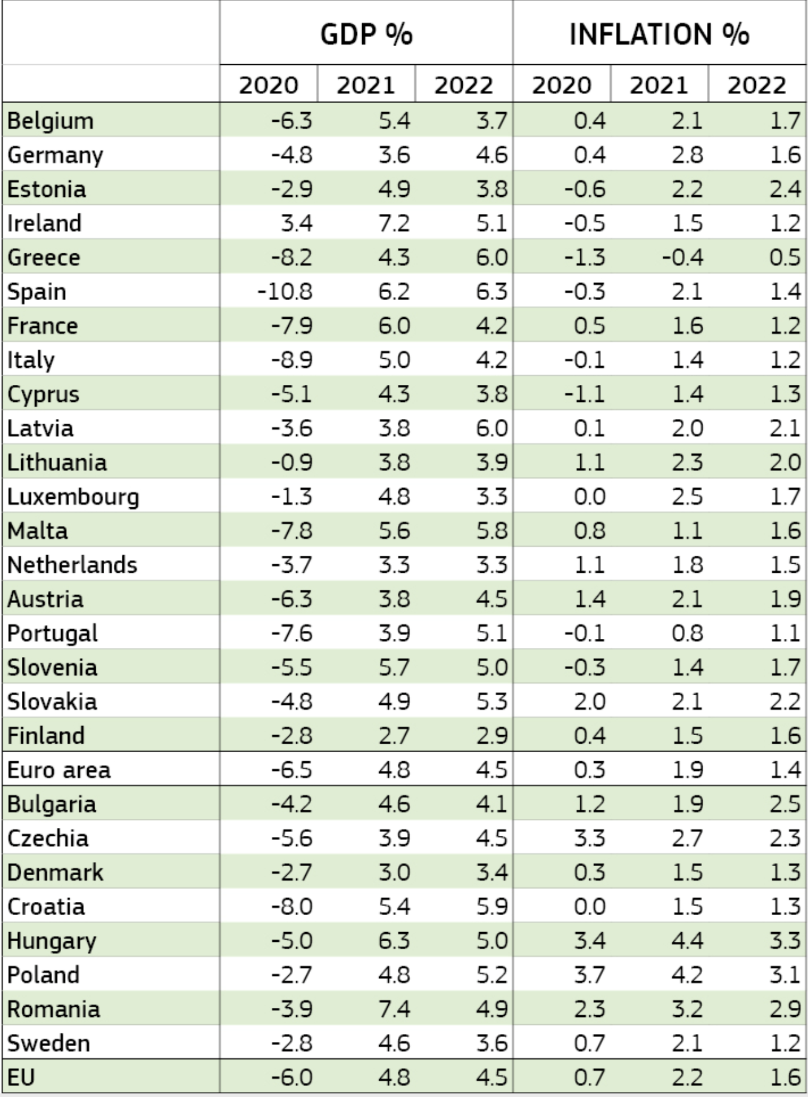
The above table shows projected economic growth and inflation across Europe.
Economic growth across Europe appears to be underway at a slow but reasonable pace. Not bad for Europe, all things considered. The economic contraction in the first quarter of this year was a concern at that time but turned out to be marginal.
The infection rate across Europe has declined which in turn has reduced pressure on the healthcare sector as the spread of the virus has progressively been contained, thanks to the rollout of vaccinations and other measures.
The general mood across Europe, although mixed, is upbeat as mobility tracking data suggests consumption is increasingly helping to support economic activity and growth.
Although early yet, there is some evidence of tourism activity beginning to emerge in some areas. Europe as you may know has developed the EU Digital COVID Certificate.
There are a number of risks surrounding the growth outlook across Europe over the next couple of years however overall, growth prospects appear to be reasonably balanced at the moment.
In general terms, although the rate of progress varies from one country to the next, some member states are expected to return to their pre-pandemic levels by the third quarter of 2021 whereas others who are challenged might take longer.
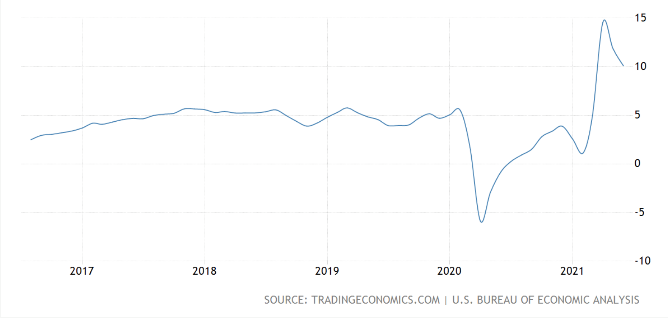
Inflation – Euro area
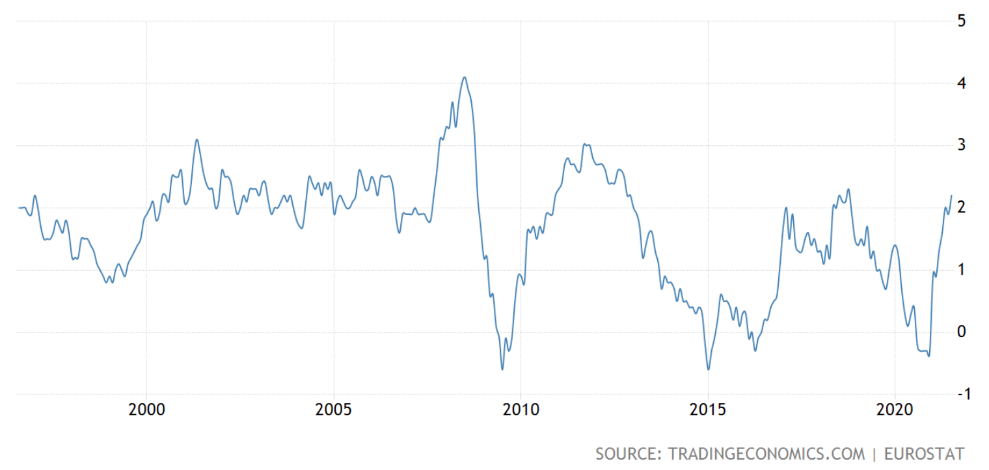
The above graph charts the inflation rate in the Euro area over the last 25 years.
The above graph shows the recent spike in inflation however, the longer-term perspective demonstrates that actually, despite the so-called spike, the inflation rate is within normal parameters – nothing to see here (at least at the moment).
The Euro area economy is recovering from the pandemic recession albeit at a moderated pace. Some positive signs though are emerging.
Australia
Economic growth (GDP) – Australia
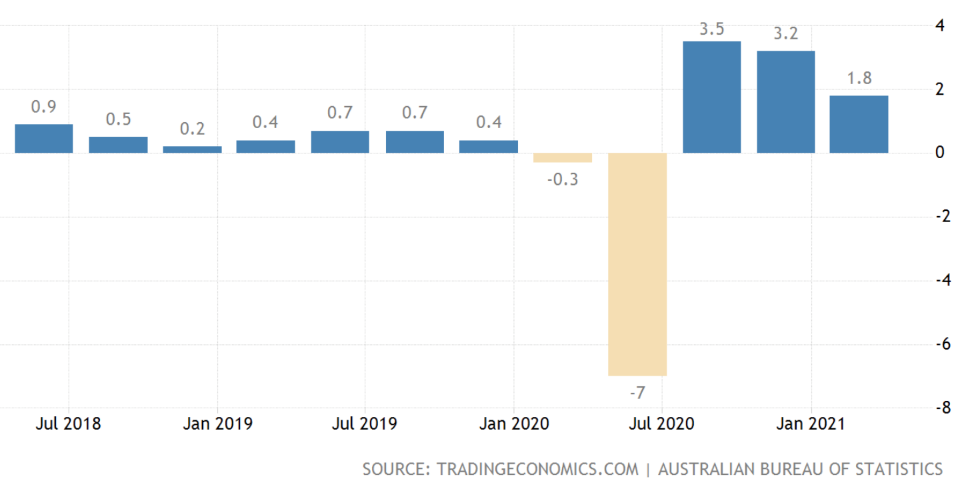
The above graph shows economic growth as measured by growth domestic product (GDP) annualized.
Australia’s economy has continued to grow over 2021 however the much-publicized re-emergence of the coronavirus has meant a return to lockdown in a number of states across Australia. This may have some impact on economic growth as early as the 3rd quarter or the 4th quarter of this year.
The Australian economy has reached AU$2 trillion (annualized) and is now larger than where it was pre-pandemic.
This is due to growth in employment, rising house prices, an increase in building approvals, and of course some increase in consumer spending – it all helps. The Reserve Bank of Australia has estimated economic growth in the first half of 2021 to be around 2.6% year on year – not bad all things considered.
However, more recently the recovery has come under question with around 5 million people in Sydney under stay-at-home orders since late June. That’s about 20% of the Australian economy by the way.
The surprising spread and the highly contagious nature of the Delta strain are causing real concerns for the Australian government, not to mention many citizens across Australia as well.
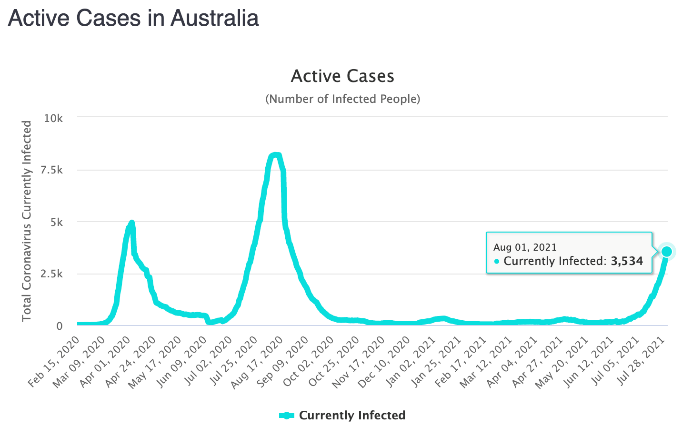
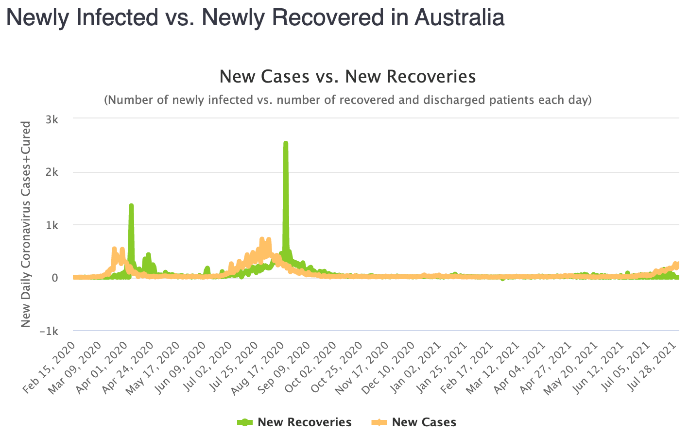
The graph on the left tracks active infected cases in Australia. The graph on the right tracks the newly infected rate versus the newly recovered rate across Australia.
The chart above to the right shows the newly infected rate versus the newly recovered rate in Australia. You’ll notice how the orange line is heading in an upward direction (towards the right side of the graph) and the green line is heading in the opposite direction.
This does not look good although it is due partly to a lagging effect where we may see in due course the green line turns upwards as many of those infected recover. In the meantime, lockdowns, mask-wearing, and other measures along with the rollout of the vaccine will be key to the containment of the Delta virus strain.
It’s always easy in hindsight however, one wonders whether greater determination only a few short weeks ago might have avoided this scenario where we now have Sydney in lockdown and Brisbane also at the time of writing in the midst of an extended lockdown as well.
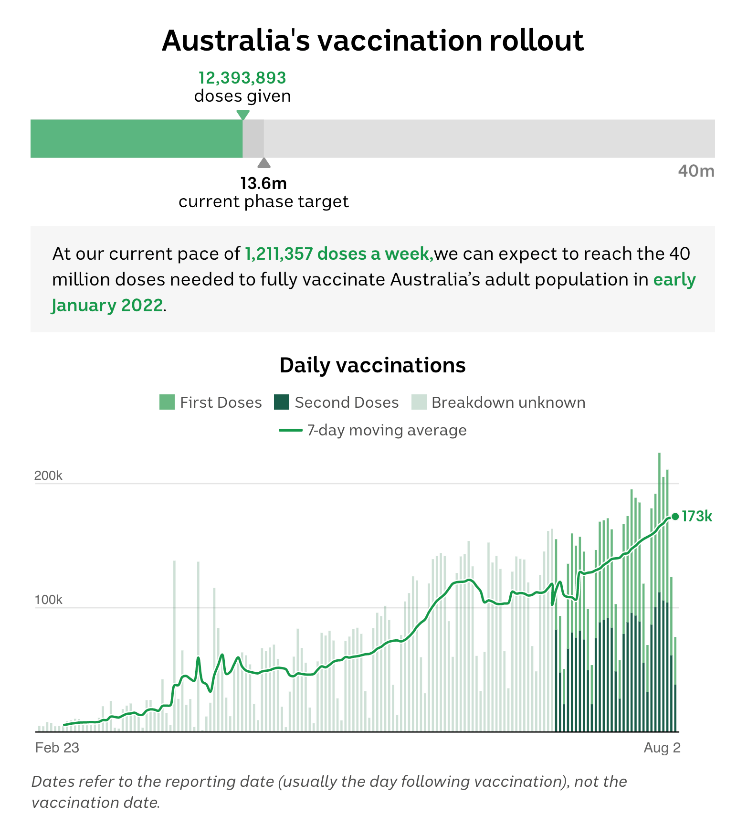
The above chart provides some data on the measurement of the rollout of the coronavirus vaccine across Australia. Although there’s quite a long way to go, as the above chart suggests, by early 2022 sufficient vaccines may have been rolled out across Australia so that hopefully, along with other measures, the virus might be contained by then – all things equal.
Meanwhile, Australia’s economic growth could be affected and slow down which we’ll know about over the next two quarters. There’s nothing to be concerned about for us here in New Zealand but a prolonged slow down would eventually have some negative impact on the New Zealand economy, given the close trading ties between New Zealand and Australia. No cause for concern right now though.
New Zealand
Global dairy auction
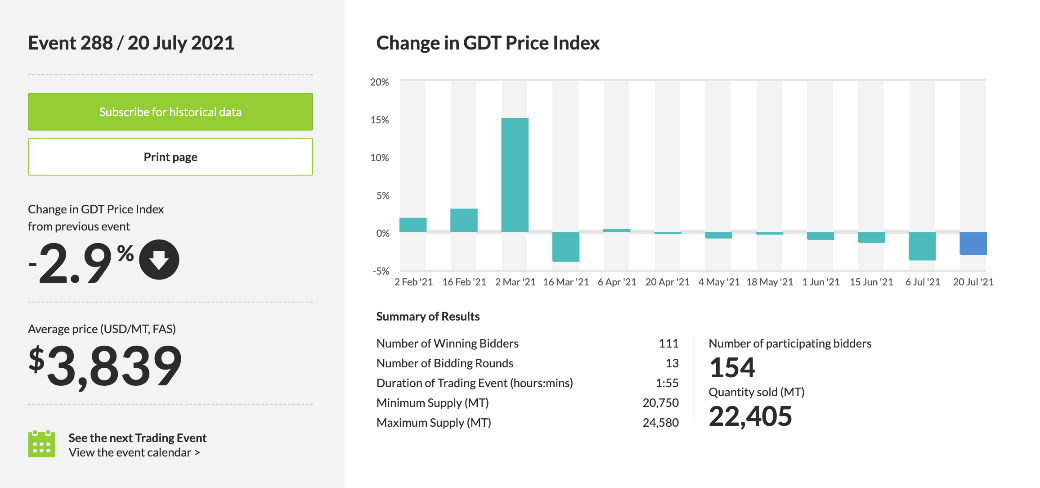
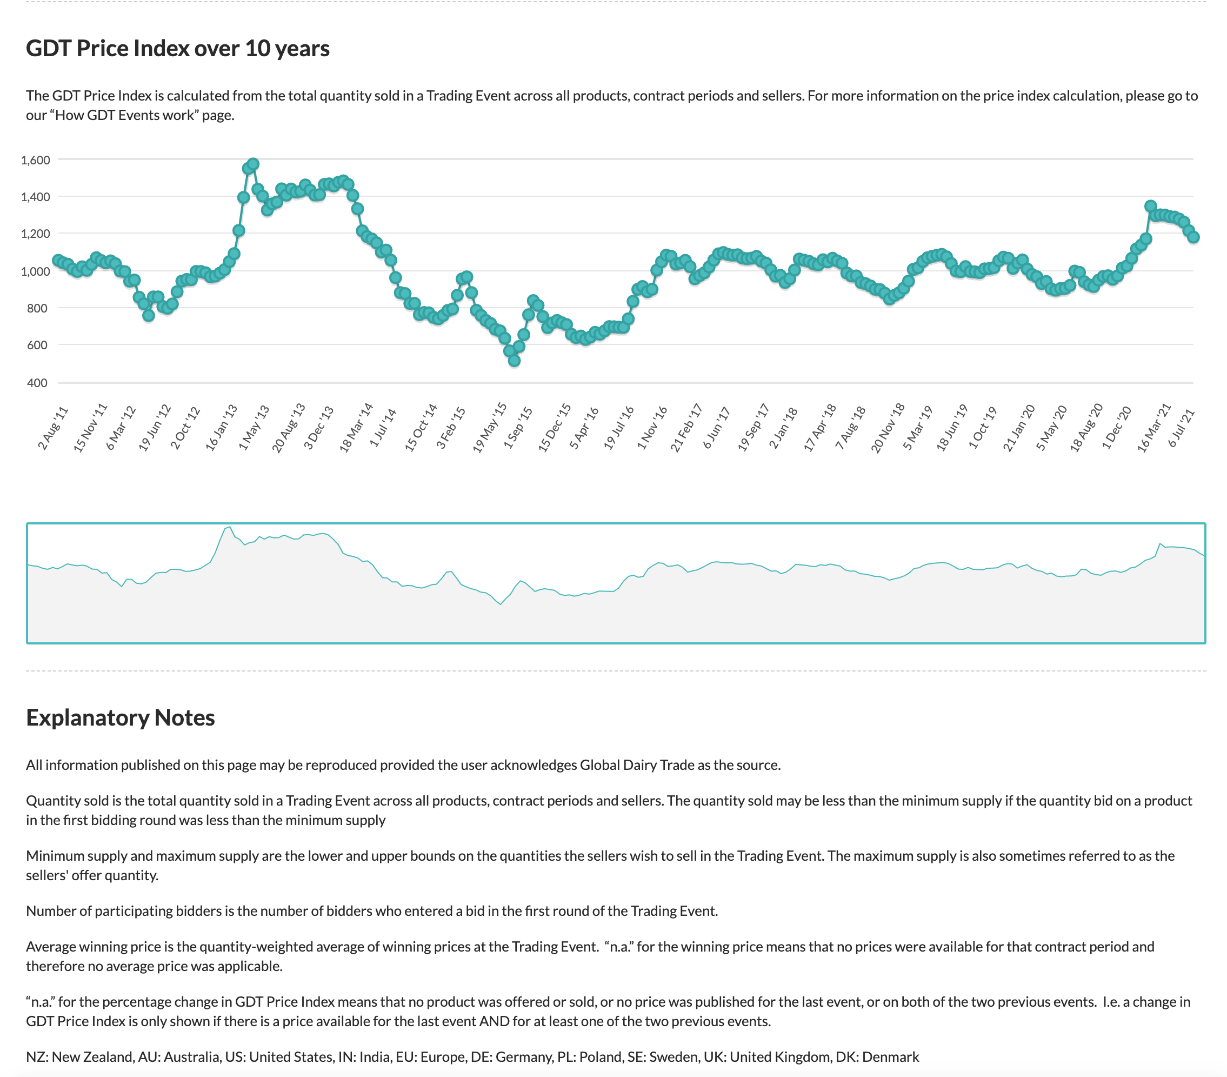
The above dashboard provides a variety of information about the global dairy auction activity over the last several months and in the case of the lower chart a 10-year history of pricing.
Dairy prices remain robust even though there has been some easing back of late. The dairy industry has not been in the news so much of late however it continues to support New Zealand’s economy in a significant way. Anyway, dairy farmers generally will be comfortable with the current pricing.
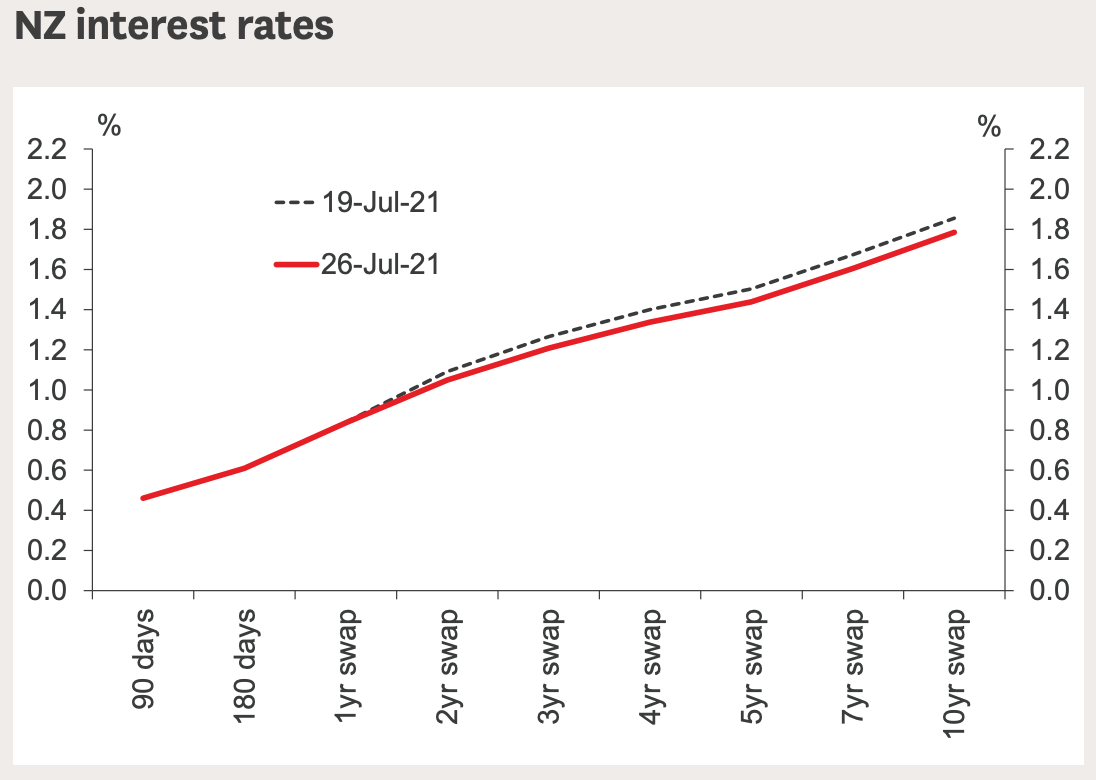
The above graph compares interest rates across several timeframes between July 19 2021 and July 26 2021.
In general terms, long-term interest rates have been rising in New Zealand over the last 6 months or so. However, the increase is limited and certainly nowhere near enough to allow those who rely on term deposits for income to feel any better than they did 6 months ago. Mortgage interest rates of course have increased although again marginally and not enough to have much of an impact on property prices.
New Zealand appears to be in a good place with regards to property prices even though they are among the most expensive in the world by a number of measures. That’s because banks have been dishing out loans based on interest rate service availability of circa 30% higher than prevailing interest rates available on the market. Simply, that builds in a buffer should things unexpectedly turn negative.
Also, whilst those servicing mortgages won’t feel any better about it, this does mean that, fundamentally at least, their ability to service is based on an interest rate that is 3% or so higher than the one they currently pay.
Based on the experience of the last decade, whilst interest rates may well increase a bit, we also should be cautious about many economists who seem to jump on the ‘rising interest bandwagon’ from time to time and get it wrong.
We’ve seen this over the last 10 years on a number of occasions where they have all come out in unison (no doubt using the same models) stating that interest rates are on the up. Then not long after, interest rates declined further!
Of course, if global inflation is ramping up over the medium term, then interest rates will undoubtedly follow. However as stated in this economic update and elsewhere, there is a lot of evidence that suggests that those inflationary pressures are temporary, and therefore what does that mean for interest rates?
Well, we need to keep an eye on it and of course, those clients at WISEplanning who are a member of our planning programs have access to an interest rate strategy that protects them from interest rate fluctuations.
So, interest rates have increased although not much and whilst time will tell, I don’t see significant spikes in interest rates in the near term – what do you think?

The above map shows the increase or decrease in the asking price for residential property across New Zealand.
Next to term deposits, New Zealand’s favourite investment is residential property.
There is some evidence that this is shifting, particularly for those under age 40 who don’t have the experience of 1987 and a different perspective on investing than their parents … interesting.
Anyway, property prices appear to be mixed across the country with the likes of Auckland, Canterbury, and Queenstown have been below trend.
Although residential property investors and Kiwi homeowners hold property as something near and dear to them, rising interest rates at some point I suspect might reduce the shine for property investors and homeowners alike.
On the other hand, it may help with affordability improvement.
Residential property prices in New Zealand have been among the most expensive in the world for many years by a number of measures. This just goes to show that expensive prices do not necessarily signal that a pricing crash is just around the corner. That said, it doesn’t mean that should a pricing correction occur that the risk is any less.
Anyway, it would appear that in New Zealand, the lack of supply and the strong demand is keeping property prices up. Until that changes or interest rates have some impact, property prices may remain at lofty heights for some time to come.
Wages growth – New Zealand
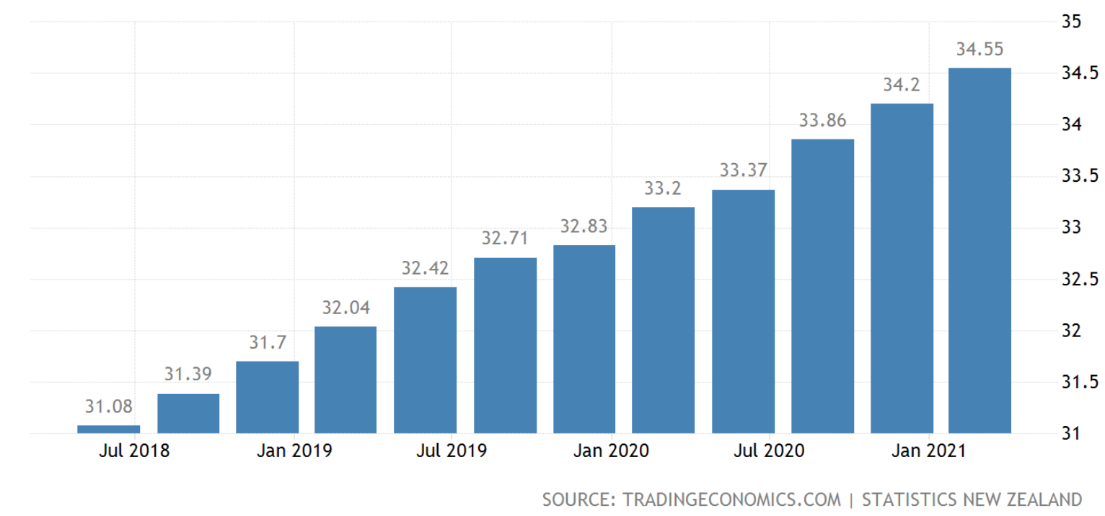
The above graph plots the increase in wages across New Zealand.
I added the above graph here just to mention that debt servicing is one of those key metrics for measuring the value of a residential property. Low wages and high property costs make for a difficult environment for those wanting to get on the property ladder.
Looking at the chart above we can see that wages growth has been minimal since 2018. In the first quarter of 2021 for example, wages in New Zealand increased to $34.55 per hour up from $34.20 per hour in the fourth quarter of 2020.
It will be interesting to see over the next 6 to 12 months with the global economy hopefully continuing to emerge out of the pandemic recession, where wages might be for everyday Kiwis and what this might mean for housing affordability.
To Summarise …
The Delta strain of the coronavirus is starting to create problems for the likes of China, the US, Australia, and other countries.
Although we’ll need to wait and see, the rollout of vaccines across these countries and others may help to contain the spread of the Delta strain, in which case the global economy will continue on its path, which is to emerge from the clutches of the pandemic recession.
It’s not over yet for the coronavirus nor is the global economy out of the woods so to speak.
Even the markets that had shrugged off the coronavirus 12 months ago, suddenly have had a rethink and occasionally worry about the implications of returning to March 2020.
I don’t see that scenario – not that I can predict the future. We’re a long way down the track with vaccines and other measures.
Interestingly, as I said earlier, whilst it is always easier in hindsight and it’s easier if someone else is having the responsibility for the pandemic, however one can’t help thinking that more disciplined measures earlier might have avoided what has unfolded in the likes of Australia, the US, and other countries.
All that said, at this stage, it does not look as though the global economy is heading back down the path again of a severe lockdown and significant economic contraction.
China’s crackdown on a number of their large technology companies was severe and interesting to watch. It is interesting for example to watch how the Chinese government has dealt with Alibaba and more specifically Jack Ma, the founder of Alibaba.
There are conflicting reports as to his whereabouts and even his safety although the actual company itself appears to have been left to be able to continue to function properly and even grow in the future it would seem. However, not without the Chinese government stopping the initial public offering of the spin-off ANT last year at the 11th hour.
There remain complexities around the regulations for Chinese companies raising capital by way of a listing on the US share market. Interestingly, just a few days ago, the Chinese government held a meeting with US authorities in what looked like an attempt to reach some common ground around regulatory requirements for Chinese companies raising capital on US markets as the Chinese government deal with their own security concerns on their own patch (hence the crackdown on large tech companies in China). Is this a backing off by China now?
The challenge for us as investors is that there is a real opportunity for us to invest in some of those Chinese companies however the regulatory risk, whilst a contingent risk, is nonetheless potentially significant. I am watching this space with interest.
I’m not one for playing the markets although I do hear the market whispering about the fragility of trading prices given the backdrop of uncertainty around spiking inflation and rising interest rates, particularly out of the US.
From an economic perspective, I believe that despite the Delta mutation risk, it is largely steady as we go, thanks to the support of central banks around the world along with low interest rates and the like.
However, markets, as they stretch from one market record to the next, particularly in the US, are vigilant and leary about any surprises.
My point here is that the US market in particular, is fragile in the face of earnings surprises (e.g., Amazon’s recent trading price decline), a sudden increase in the spread of the Delta strain, unexpected spikes in inflation and therefore concerns about interest rates rising sharply.
This is all below the surface market noise but worth thinking about because of course, the market is not always interested in the fundamentals, but rather in where the trading price will be in 5 minutes!
The global economy is mixed although stable. Markets have been in a bull phase but are somewhat fragile.
A decent correction (e.g. 10% or so) would be quite nice right about now. You may be aware that over August and September markets tend to become volatile and so we might be in luck soon – hopefully!