Is The Global Economy In Trouble?
Monthly Market and Economic Update – April 2022

Peter Flannery Financial Adviser CFP
“If you have one economist on your team,
it’s likely that you have one more than you’ll need.”
Warren Buffett
Key Points:
-
War.
-
Inflation is sharply up.
-
China and Russia getting cosy.
-
Debt is high.
-
Interest rates on the way up.
-
What does that mean for markets?
-
What does it mean for your investments?
THE MARKETS
Volatility is normal.
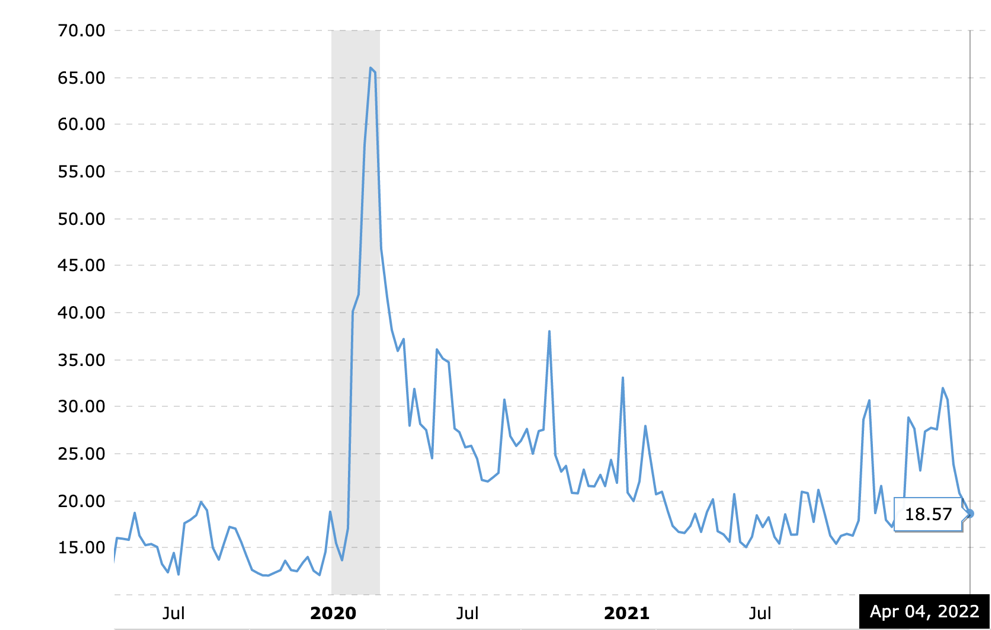
The above graph is the VIX index, which is a measure of market volatility.
Starting in December last year, volatility is still with us and looks likely to continue for some time yet.
That’s because the Ukraine situation has yet to show much in the way of direction, let alone come to an end. Also, inflation has spiked.
With the drivers of inflation being a mix of supply chain constraints and ongoing sticky inflation caused by other drivers such as wages growth, for example, interest rates are likely to continue to rise over the next several months and possibly into 2023.
Interestingly, the US and New Zealand are leading the way with regard to rising interest rates.
Indeed, although not mainstream thinking, there is an emerging train of thought suggesting that interest rates in New Zealand might be reaching a peak over the next month or two.
That could be the case, although we will need to see where those interest rate hikes get to in the US and how inflation behaves over 2022.
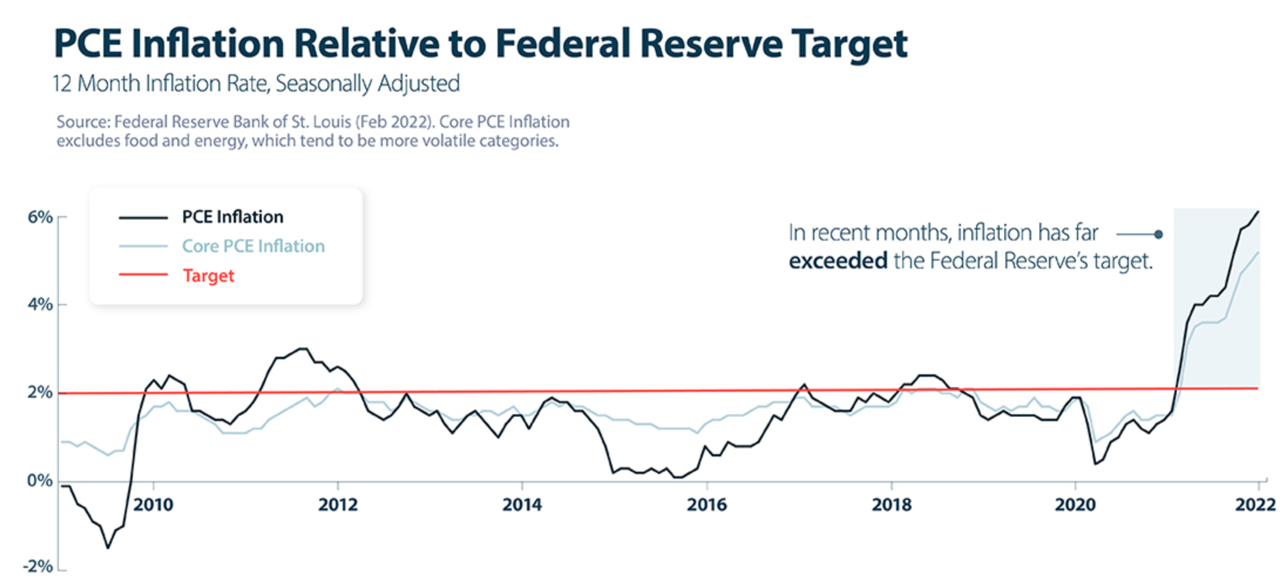
The above graph tracks inflation in the US (the dark black line), core inflation (the light grey line), and the Federal Reserve’s target rate of inflation (the red line).
Inflation has spiked in a number of countries around the world, including New Zealand. However, I think the impact of inflation has yet to be felt in real terms.
It’s also possible that we’ll see the impact of inflation drag on over the next year or two. Part of it is driven by supply chain constraints caused by workers sick with the coronavirus, slowing down productivity.
The standard response to excessive inflation is to raise interest rates, which inevitably can strangle economic growth, which in the end, eventually causes inflation to subside. The trick, of course, is for central bankers to be careful that they don’t cause an economic recession.
Too much in the way of high-interest rates at some point can cause economic growth to slow dramatically. That’s partly where the commentary is coming from here in New Zealand around the rise in interest rates possibly nearing the peak.
The NZ Reserve Bank governor is looking ahead 12-18 months as he considers each move with the official cash rate. In other words, the impact isn’t just in the immediate future but may also impact strongly 12-18 months out.
Central bankers raising interest rates is nothing new. However, transparency about what they are thinking has emerged more recently. Back in the day, they used to raise interest rates overnight and leave the market to work with this new information, which usually amplified market volatility. Markets very much dislike sudden news to the negative and very much dislike uncertainty.
You and I are perhaps a bit more relaxed about it because we know that lower prices mean better buying opportunities.
Your portfolio cash up value?
If you’ve been around for a while as an investor, if you’ve noticed, your cash up value is in much the same place as it was this time last year. You’ll know this happens from time to time and is nothing new.
If you are a bit new to this type of investing, you might be starting to wonder whether or not you have made a mistake investing in “shares!”
Remember, we invest in the business, not the stock.
The trading price of one of your holdings rising or falling is the result of market sentiment around that particular stock (not the fundamentals of the business).
In other words, markets don’t look up the internet, analyse the economics of the business, then look at the price and make adjustments. Usually, market participants look at their set of numbers / analysis and on that basis make decisions. Or, they go straight to the trading price, see it as value, and make a judgment on that basis!
Anyway, lower prices, unfortunately, in this environment does not mean that bargains are everywhere. Still, there is opportunity, and my job is to the point that out to you from time to time as I review your portfolio. Good businesses are still good businesses even though the market as a whole might be in turmoil or expensive.
Volatility and the tide
As one of my clients quite succinctly put it the other day, his portfolio seems like a boat on the tide. The tide goes out, and the boat moves out. The tide comes in, and the boat comes in. We wind up in the same place as where we started!
I had not thought of it this way, but that’s exactly how it is with our portfolios in the short term (prices rise, prices fall and we are back in the same place).
Longer-term though, the economics of each business that you invest in will help drive the growth of that business so that ultimately, the intrinsic value and the trading price line up quite closely in the long-run. The tide (market sentiment) progressively becomes less and less the driver of the boats forward movement.
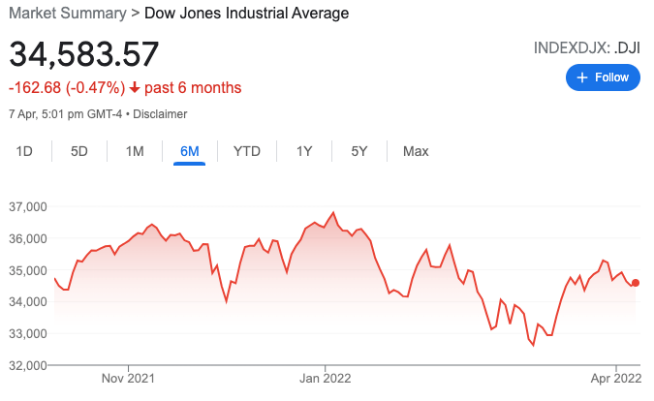
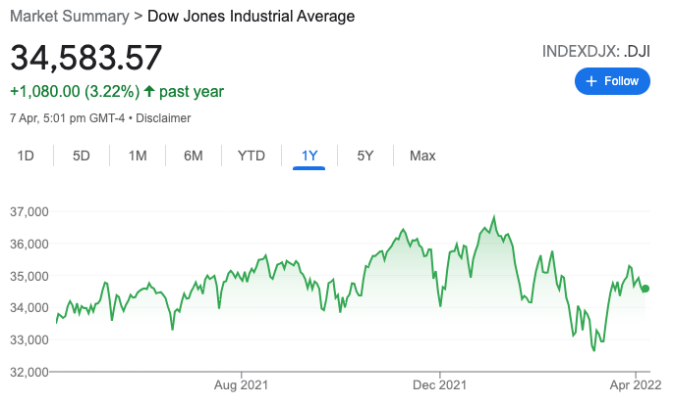
The chart on the left shows the US share market (the Dow Jones) over the last six months. The chart on the right shows the US share market (the Dow Jones) over the last year.
We haven’t really moved much from my report last month with the Ukraine war continuing to create uncertainty along with spiking inflation and the spectre of rising interest rates.
As I outlined last month, volatile markets and uncertainty do not mean that markets won’t rise. I know that many have a craving for certainty and straight lines. This is just not how the markets operate. That’s a good thing, too, because that uncertainty creates volatility which, as you know, allows for better buying.
The trick is not to get caught up in the noise of that volatility.
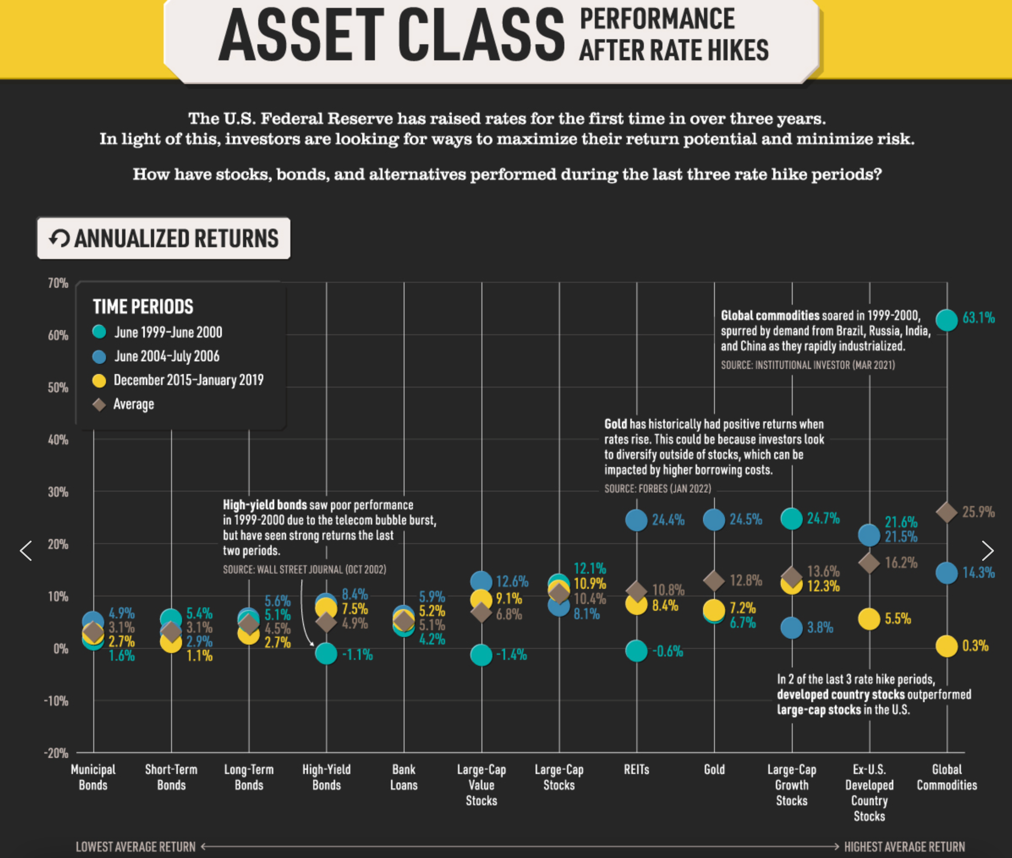
The above graph tracks the movement in asset prices across different timeframes where interest rates have increased. To read this graph, just go down to the horizontal axis, choose your preferred asset, and then look up that line to see the different coloured dots (and the brown square denoting the average return) to see how that asset behaved over the different time frames outlined under the heading TIME PERIODS.
As we know, commodities and growth assets perform best, and income-generating assets such as term deposits and bonds don’t perform that well in that environment.
It’s useful to remember though, that even term deposits and bonds in some situations have a place. The thing is, that place is not generating the maximum compounding wealth for individuals looking to be safe financially in the future, especially when we’re talking about offsetting the impact of the rising costs of goods and services.
Commodities, for example, are not without merit. However, they can also be highly volatile. That’s great on the upside but not so good on the downside. Commodities don’t have an intrinsic value either.
Perhaps the final word on the above graph is to be careful about placing too much weight on historical data. It is interesting, even informative, although it’s far from a guarantee of future performance.
Where to next for markets?
The Ukraine situation continues to drag on. It is horrible, to say the least. From an economic and investment perspective, the impact is unfolding.
More specifically with markets, the uncertainty of the situation ebbs and flows, as you’ve seen. It remains difficult to gauge, but hopefully, there will be some sort of compromise in due course, if nothing else, to put an end to the pain and suffering of Ukrainians who have found themselves suddenly caught up in an unimaginable world of pain and uncertainty.
Six rate hikes were scheduled for 2022 by the US Federal Reserve Governor Jerome Powell. One down, and we thought five to go. Recently though there has been talk of more than six and also bigger rate hikes at 50 basis points rather than the 25 basis points suggested until recently.
I am looking to see where things are and, more specifically, how the market is responding around June or July this year. By this time, these rate hikes will be very real for some participants across the market.
For those chasing rising prices, now is a challenging time for them.
For us, now is the time when we let the volatility unfold and quietly take advantage of better pricing along the way. Patience though, remains important.
The Global Economy
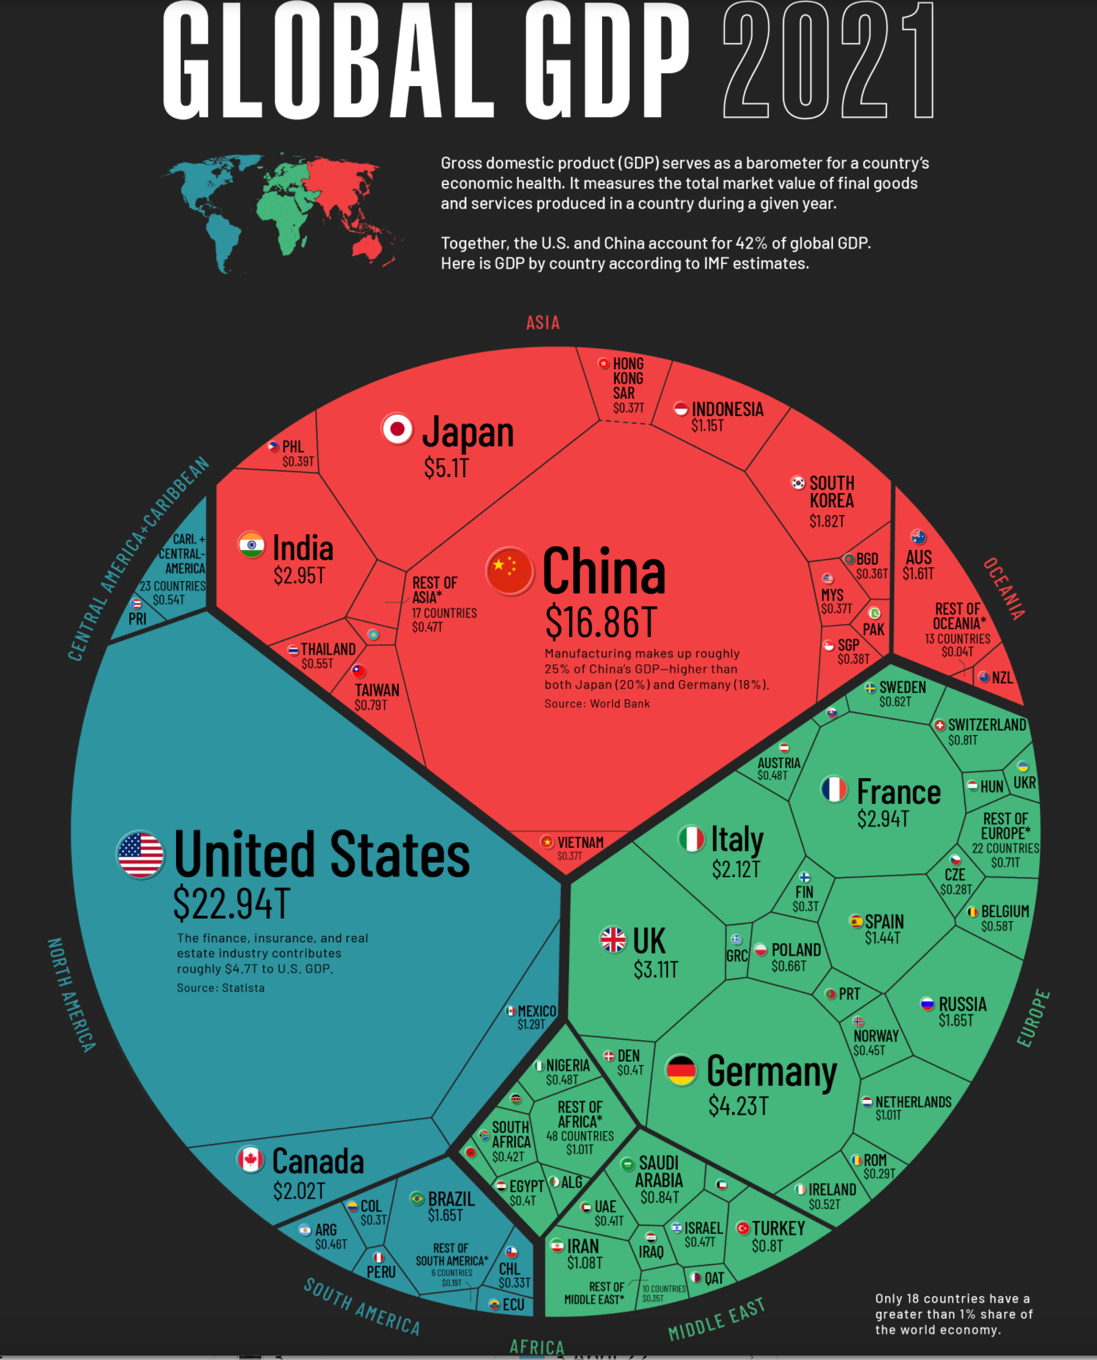
The above map shows how much each country contributes to global economic output.
The global economy continues to grow despite the coronavirus, the Ukraine war, rising interest rates, and rising oil prices, and rising commodity prices, and fear and uncertainty…
Activity continues and is significant as people around the world go about their daily lives. That’s partly what contributes to productivity in each economy.
Unfortunately, whilst activity continues, we have seen productivity decline steadily over many years in many countries around the world. Indeed, the global debt that has been growing over the last 30-40 years or so has in some ways masked that reducing productivity, even though asset prices continued to rise.
That said, the global economy still continues to grow, even though productivity levels may have declined somewhat over time.
The point I’m getting to here, is that those looking for a world of 100% certainty and straight lines on an investing graph will continue to be disappointed. The world is simply not like that, no matter how much people may feel that this elusive certainty is only fair (!). There is always a black swan lurking around the corner somewhere. Still though, there is also opportunity.
Tip: Look at the global economy and the New Zealand economy as an investor – not as an accountant, banker, lawyer, or even an economist!
We can see from the map above that just four countries, the US, China, Japan, and Germany, make up over 50% of the world’s economic output as measured by Gross Domestic Product (GDP) in nominal terms.
Indeed, the economic output of America by itself is greater than the combined economic output of 170 countries.
For example, take a look at around 3.30pm on the above map by Europe, and you will see Russia’s economy at $1.65 trillion compared to, for example, Germany at $4.3 trillion and Britain at $3.11 trillion.
In short, these are economic machines that are significant and continue to roll through all manner of credit cycles.
A Brief Overview – The Global Economy
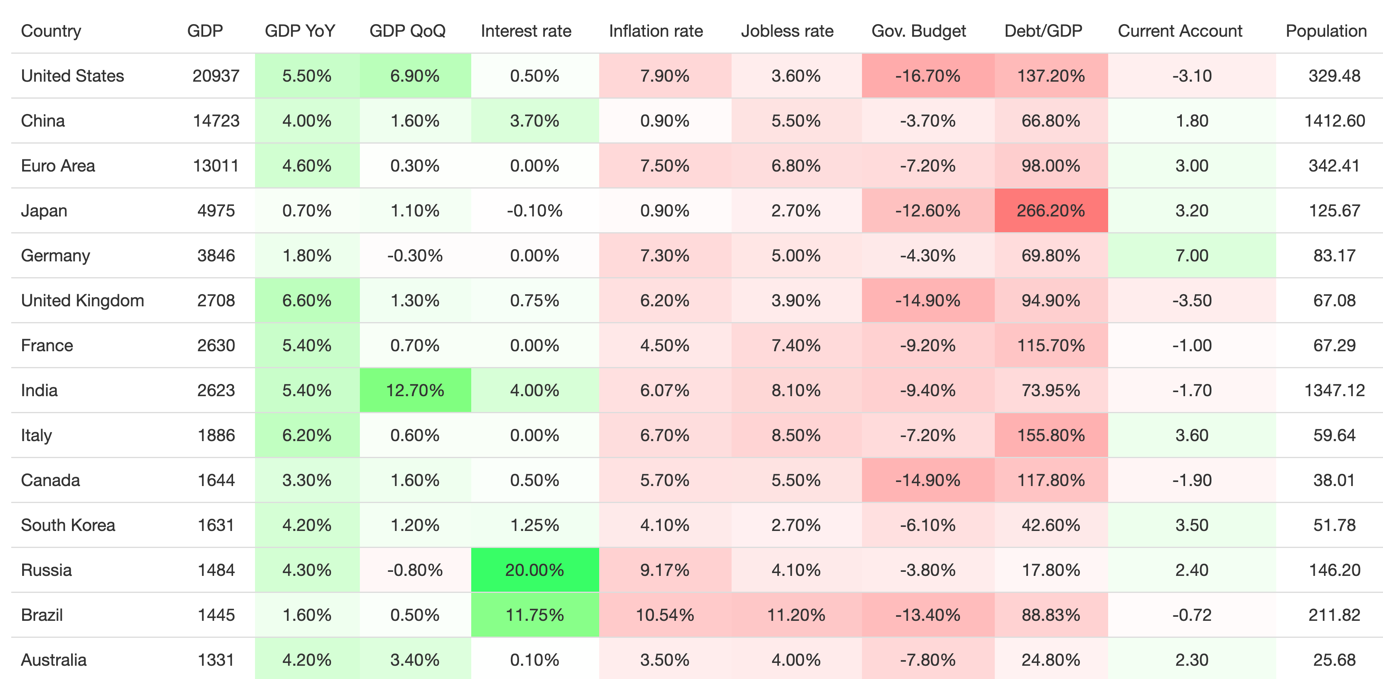
The above table tracks some key economic indicators of major countries around the world.
Looking at the table above, the data becomes interesting when we compare one economy with another.
I’ve heard one or two comments (in fact I’ve heard these comments for decades) that the world is now a dangerous place and the risks are now greater than they ever were, as though somehow, this time, it is different. It is fair to say that levels of global debt in nominal terms, at least by a number of measures, are at all-time highs in a number of countries.
Looking at the table above, across the debt / GDP column, we can see a number of those countries approaching 100% of GDP or above, which is not ideal.
Interestingly, Russia is below 25%, although that may be changing as we speak.
I can’t predict the future, however, in my experience over almost 40 years, watching the dynamics of economies, credit cycles, changing governments, war, and a variety of other events, my conclusion is that it’s not different this time. I continue to struggle to see market and economic collapse.
Indeed, if we want to push that point (global financial collapse), not many people realise that the global financial system actually broke down and stopped on three occasions over 2008 (!). Did you know that?
Anyway, at the time there were some phone calls made by some heads of state and key executives of the banking sector, and the rest as they say, is history. I know I am simplifying it, and I don’t mean to make light of a less than ideal global situation (debt-levels high and other uncertainties).
It is important though, that as investors, we keep our minds clear and avoid overweighting market and economic noise that comes and goes in a variety of forms as credit cycles and market events unfold over time.
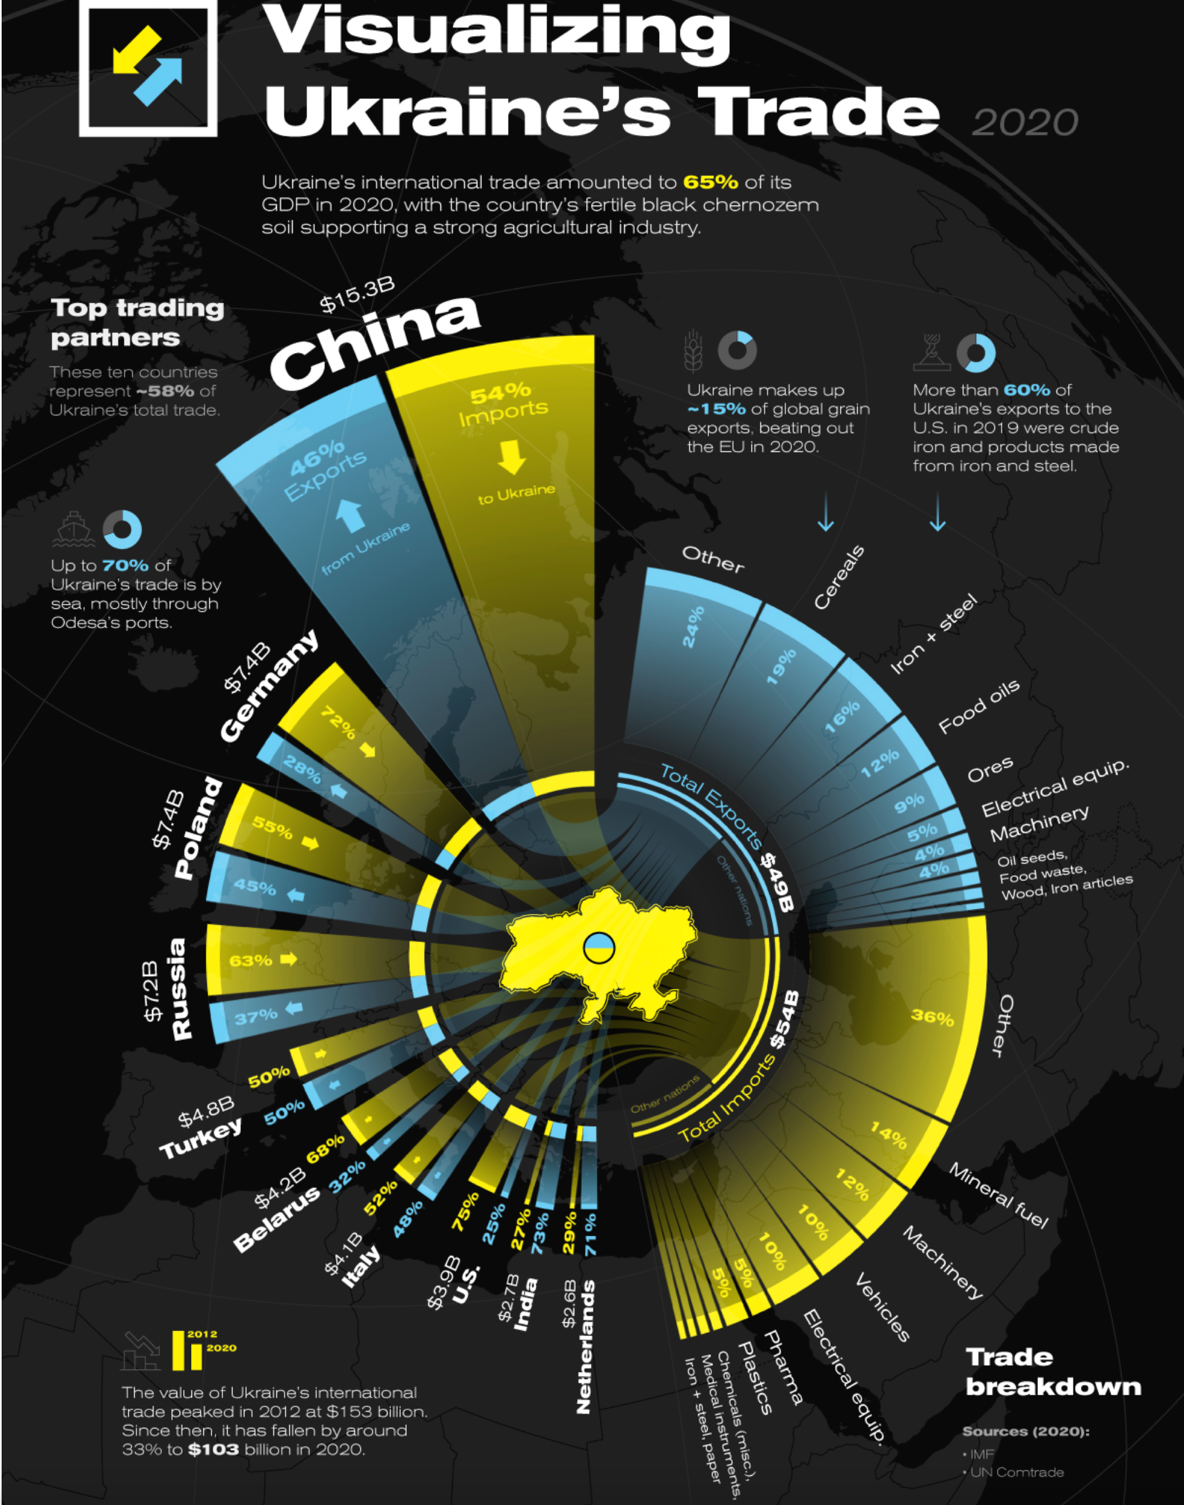
The above diagram shows Ukraine’s top trading partners and products in 2020.
Sadly, that diagram may look different at the moment.
On a day-to-day basis, we didn’t use to hear much about Ukraine here in New Zealand. It has changed in an unfortunate way. Ukraine’s international trade was equal to around 65% of Ukraine’s GDP in 2020, which was a total of $102.9 billion of goods exchanged with countries around the world.
Russia’s annexation of Crimea in 2014 contributed to a 30% year over year drop in Ukraine’s 2015 trade value ($75.6 billion).
Unfortunately, Ukraine’s international trade has been severely disrupted since the invasion by Russia on February 24th of this year.
Although it is still unfolding, this event is reshaping global trade. Also, we now regularly hear comments about de-globalisation, which is starting to emerge. As an investor, I don’t see that as a major risk but rather a change in the dynamic of trade relations around the world.
Elsewhere, commodity prices have also spiked and we are seeing the likes of the UK and Europe now look to raise interest rates as part of their response to spiking inflation.
China’s economy continues to grow, although that growth has slowed somewhat and will be further impacted by the lockdown of their largest cities as they continue to maintain the eradication policy for the coronavirus.
Overall, the global economy continues to grow, although at a slower pace than was projected one year ago.
The United States of America
Inflation – USA
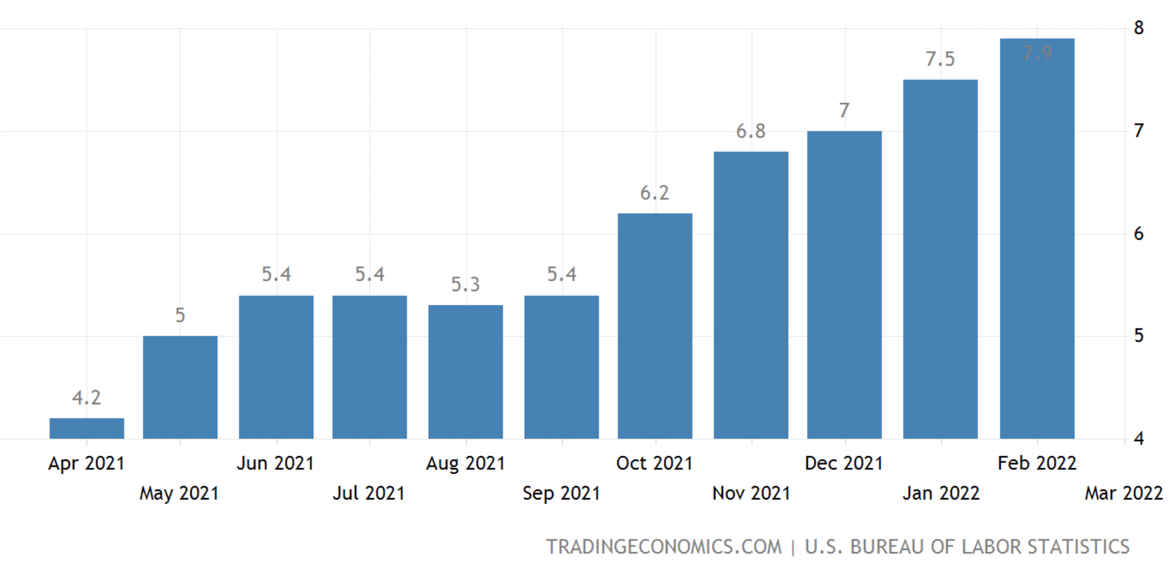
The above graph tracks inflation in America over the last 12 months.
I know graphs about inflation might be becoming repetitive (!).
It’s included here again because, it is a driver of interest rates which in turn is a driver of market volatility.
Inflation in America has accelerated to 7.9% in February this year, which is the highest since January 1982. The biggest contributor has been energy with petrol prices surging 38%.
Also commodity prices as you know, have been surging as a result of the situation in Ukraine.
Looking a bit more closely, when we exclude highly volatile components such as energy and food from inflation, the Consumer Price Index (CPI) rose 6.4%, the most in 40 years.
Interest rates – USA
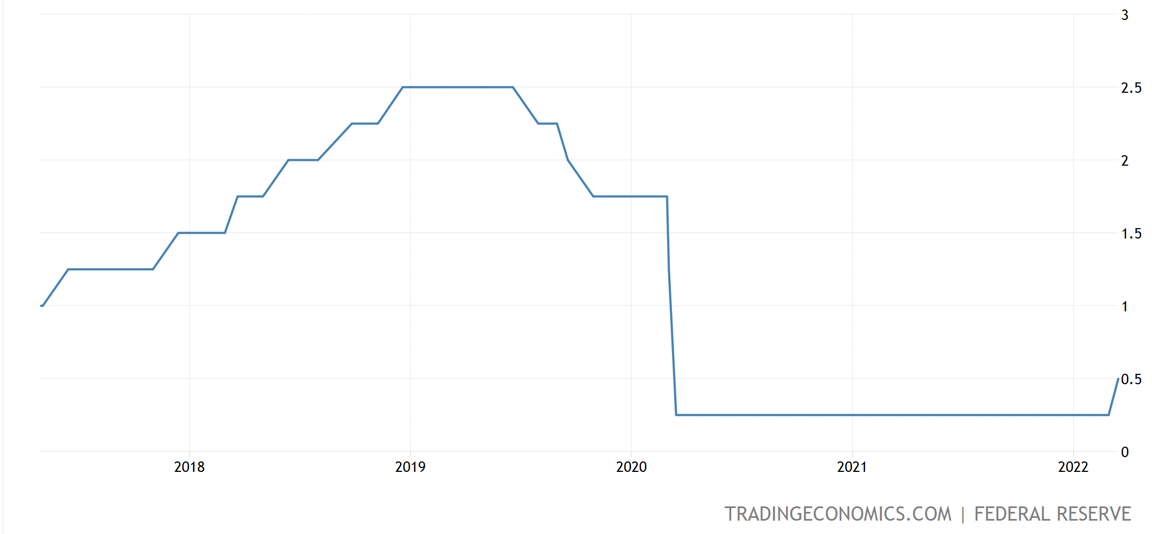
The above graph tracks the Fed funds rate in America.
Looking at the right side of the above graph, you can see a 25 basis points interest rate hike that has now been implemented.
We know that there were six rate hikes scheduled for America, although there is now some debate around whether there may be more and whether in fact, sometime soon, one of those rate hikes could be 50 basis points (1/2 of 1%). Expect the market to be quite focused on this particular item and not to like it if a 50 basis point rate hike is announced.
The bottom line with interest rate rises is that they are a symptom of growth.
They do cause pricing volatility, which can play out over months and even years. For us as investors, we know it creates volatility, and again, it’s important that we ignore the mainstream narrative around how bad rising interest rates are and how it devalues assets.
In addition to those interest rate rises, the US Fed is looking to “taper”. This just means removing some of the stimulus ( approx. $US 9 trillion) that was provided in the recent past. More specifically, they are looking to scale back the stimulus by around $60 billion per month for treasury securities and $35 billion per month for mortgage-backed securities.
This means less liquidity in the system and signals the credit cycle shift that is already underway. That shift means tighter money conditions. More difficult to get loans, which tends to slow down economic growth … which is the idea.
The US Fed wants to slow down economic growth as well as slow down inflation in order to help stabilise the US economy.
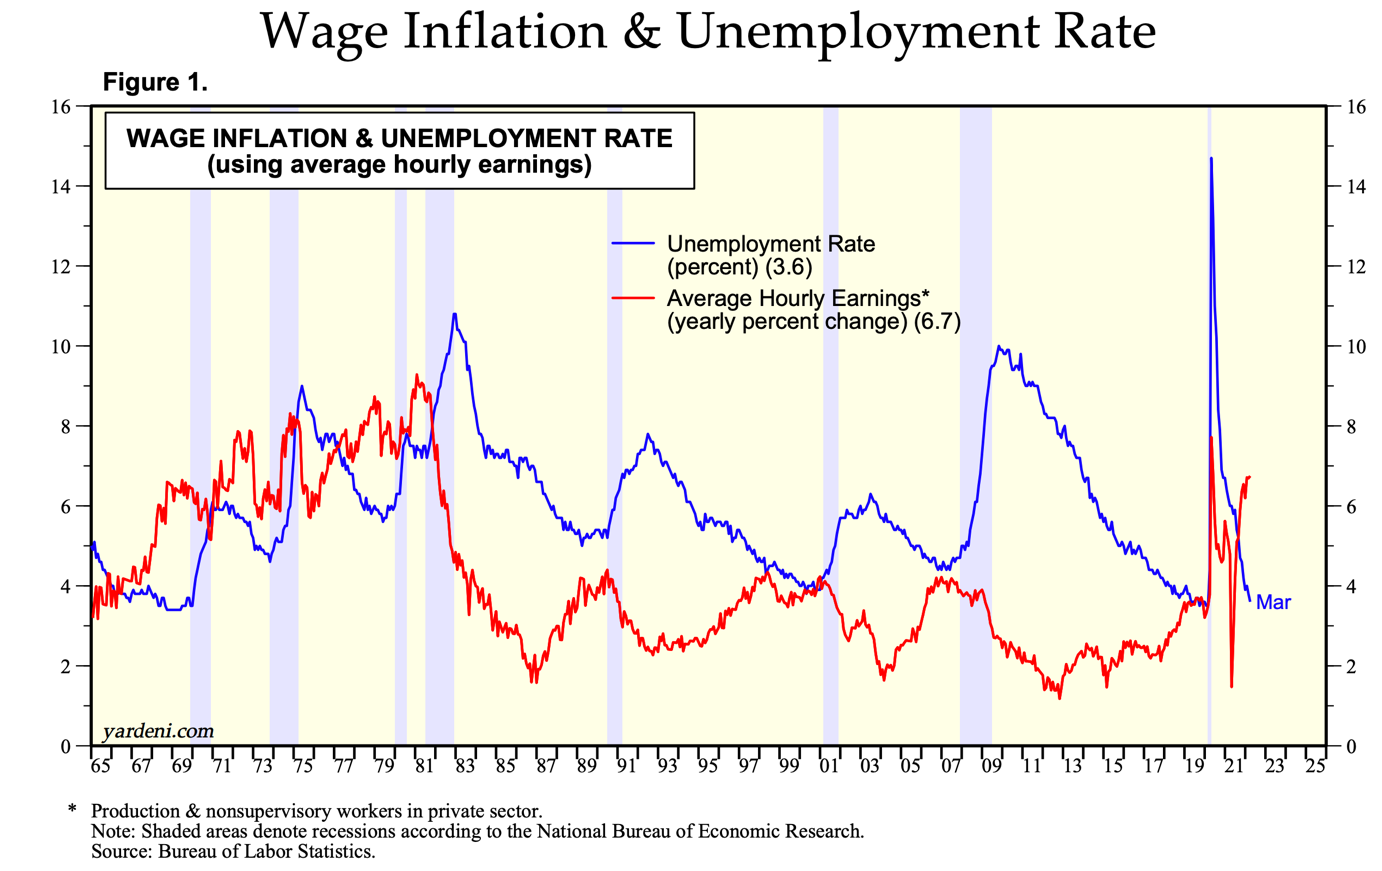
The above graph shows the relationship between wage inflation and unemployment.
Commonly known in economic circles as The Phillips Curve, this is about the inverse relationship between inflation and unemployment. Simply, the idea is that as unemployment decreases, inflation increases. Like most of what we see in the world of economics, this is a general idea rather than a specific methodology.
Although The Phillips Curve has fallen out of favour of late, we are indeed seeing unemployment decline and inflation rise. Some suggest that falling unemployment does not cause inflation, I can’t help but wonder if falling unemployment may lead to a shortage of staff (like we see at the moment), and therefore increased demand by employees on employers for higher pay. It sounds inflationary to me.
Further, given the unlikelihood of employers cutting wages (although, of course, they can reduce staff numbers), this impact can become quite ‘sticky’, causing inflation to stay around for longer and perhaps be more stubborn.
China
Key economic indicators – China
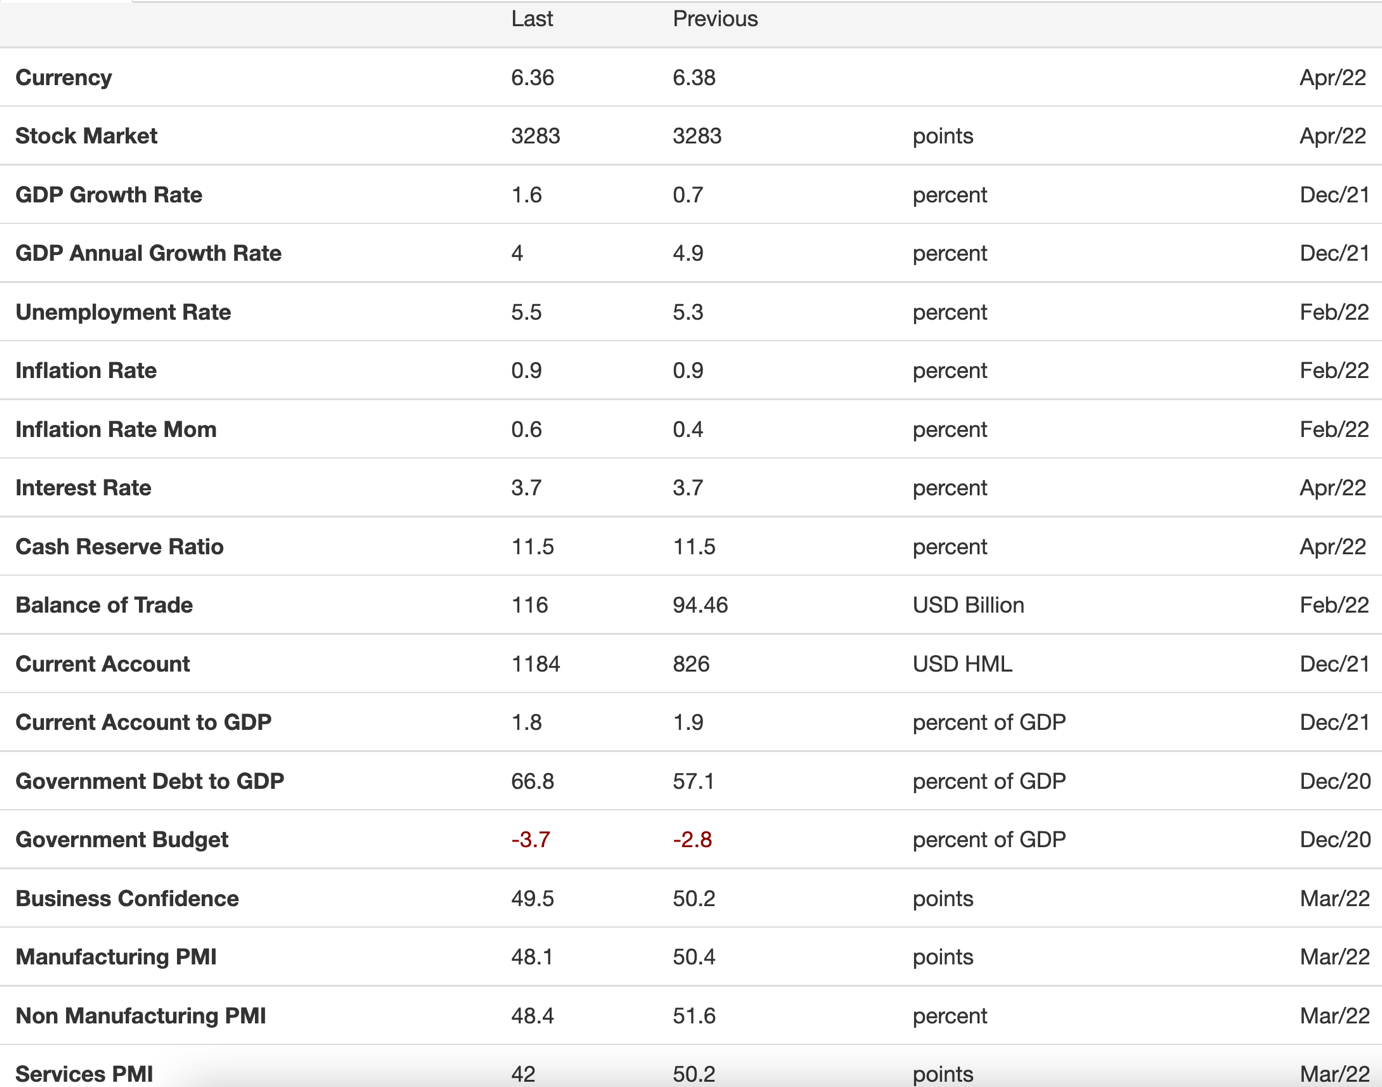
The above table highlights a number of key economic indicators across the Chinese economy.
The Chinese economy continues to grow strongly compared to many other countries, although at a slower pace than previously projected.
Morgan Stanley lowered its 2022 forecast to 5.1% for GDP, down from 5.3% previously. Interestingly, this is below the Chinese government’s target of approximately 5.5%.
The above adjustments were made after China placed the city of Shenzhen on lockdown. With the coronavirus reappearing in China, the government is once again applying lockdown measures which, as I’ve mentioned elsewhere, may impact economic growth in China over 2022 and possibly impact global growth to some degree. That said, it’s difficult at this stage to see a severe global recession because of this right now.
The Caixin China general services PMI slumped to 42.0 in March 2022 from 50.2 in February. That is a significant decline into the contraction zone and is generally considered to be a result of the resurgence of the Omicron virus. In short, the Chinese economy continues to grow but at a slower pace.
China and Russia
On another note, we’ve all been watching China’s response to Russia. Not long ago, they publicly said that they were best mates. Although it’s difficult to gauge, it would seem unlikely that the Chinese Premier will go along with human rights abuses and war crimes that appear to be emerging out of Ukraine. China as always, I believe, will adopt a very, very measured approach.
It’s important to remember as well I think, that China still needs to trade with the global economy even though it is making strong efforts to reduce its reliance, particularly on America and other Western economies. The reality is that China needs the world, and the world needs China to trade with for now.
De-globalisation appears to be underway to some degree, although we’ll see how far this gets. The short of it is that countries like China and the West will look for other sources of trade.
The Chinese government appears to have finalised its overhaul of the large tech industry in China.
Also, the government is in the midst of stabilising the property sector in China.
Although they face ongoing headwinds with the Omicron virus, given their lockdown policy and eradication policy, those initiatives with the tech sector and the property sector bode well for the future of China.
Still, it’s difficult to see the Chinese economy continuing to grow at its current pace of around 5% or so. That said, the Chinese government are very strongly managing the Chinese economy with an iron grip, to ensure that market and economic stability prevail.
New Zealand
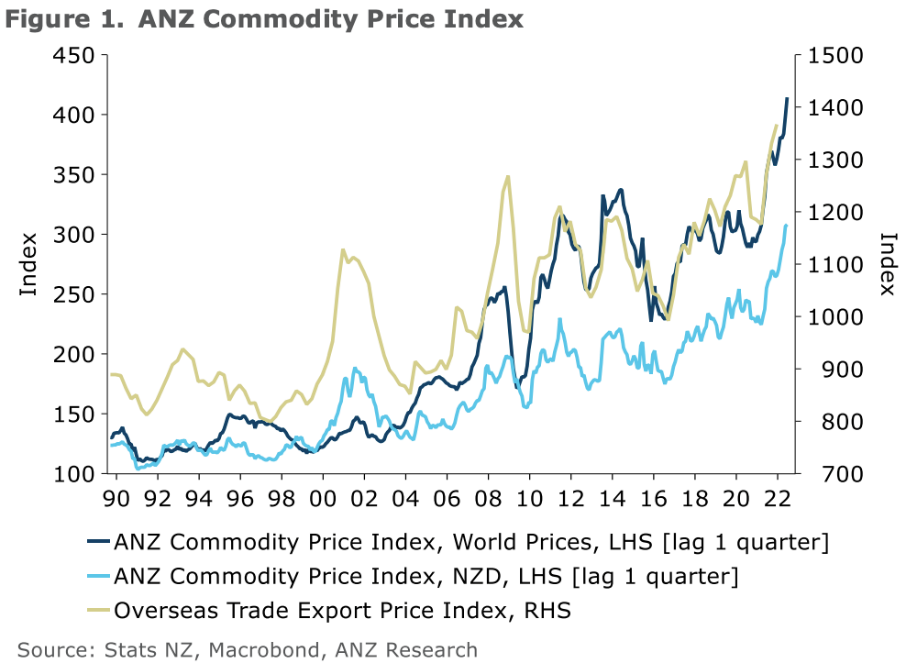
The above graph tracks commodity prices.
Commodity prices have been spiking globally.
The ANZ World Commodity Price Index reached a new record in March this year, rising another 3.9%.
Global shipping prices also appear to be on the rise again as lockdowns in China create logistical problems at critical ports. Shipping costs and delays are expected to deteriorate as 2022 unfolds. This could place unexpected pressure on smaller exporters in New Zealand.
Dairy prices gained 7.6% month on month in March this year, with the Index now just below its record level achieved in April 2013. Information from ANZ economics suggests that milk powder prices are still quite a bit below record levels; however, butter and cheese are both at new records with cheese for example, increasing by 9.4% month over month.
Elsewhere, forestry has seen its index lift by 3.3% in March as market demand picks up.
Aluminium prices have lifted strongly by 8.4% month over month in March.
As you can probably guess, Russia is one of the largest producers of aluminium, which means that, at least in the near term, global supply is much tighter than has recently been the case. Russia may have difficulty obtaining the raw material needed from the global economy to actually manufacture and produce aluminium.
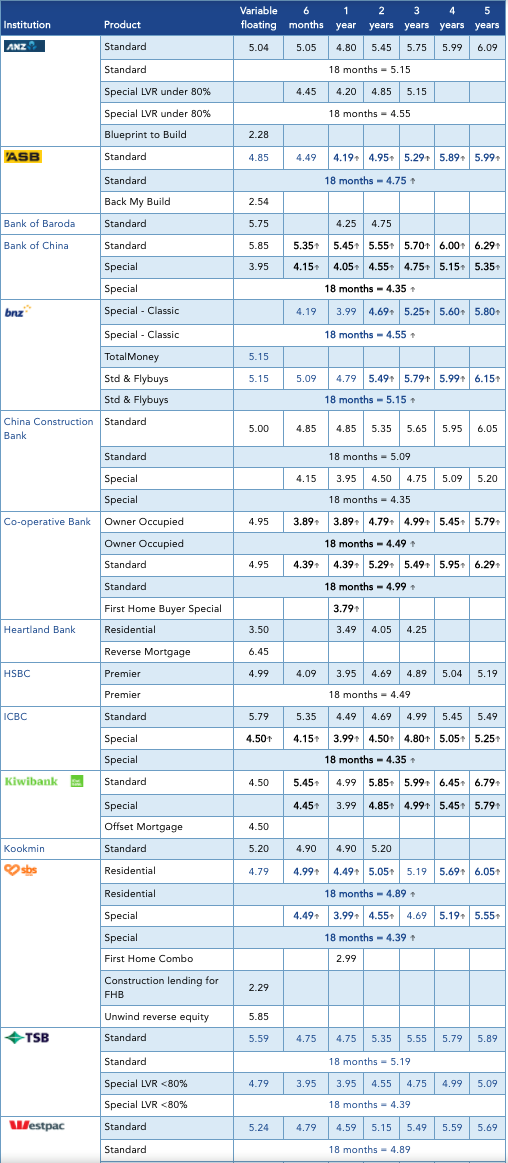
Bank mortgage interest rates
Bank term deposit rates
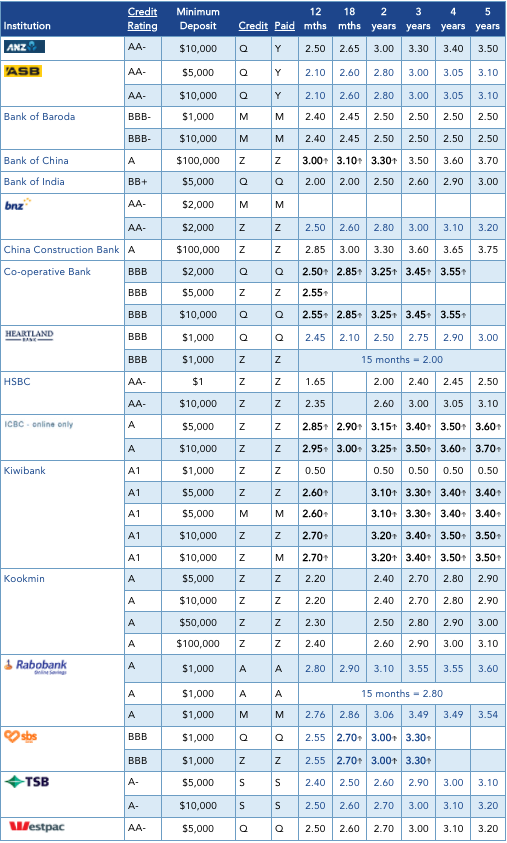
So, interest rates have increased and continue to rise, although there is emerging commentary that we may be getting near the peak of those interest rate rises. I’m not so sure about that because the US Fed has an undetermined number of interest rate hikes still to go over 2022. That will likely impact New Zealand’s interest rates.
Residential property
With tighter monetary conditions underway, thanks to the Credit Contracts and Consumer Finance Acts (CCCFA) along with rising interest rates, we are starting to see property price rises slow down and flatten in a number of areas across New Zealand. I reckon there’s more to come.
The impact of tighter monetary conditions and increasing interest rates have yet to be felt. Property tends to be a lagging indicator anyway.
I am keen to see where things are around June or July this year, not only here in New Zealand in terms of interest rates and the impact there, but also interest rates in the US and how the market is responding.
When all is said and done, the New Zealand economy remains reasonably sound, and although economic growth is not rising as fast as some would like, the NZ economy remains stable.
Some worry about the level of debt now in New Zealand, given the additional $100 billion of debt because of the coronavirus. Whilst New Zealand’s level of debt is now moderately high. It remains manageable.
To Summarise …
The Ukraine situation continues to drag on. Apart from the unthinkable acts that are emerging as war crimes, it also adds to the uncertainty across markets. Still though, as I pointed out last month, markets still tend to rise by the time war’s end comes.
It wasn’t that long ago that the central theme in my communication was about the perils of deflation. That went on for years and years. Now all of a sudden, it is about the perils of inflation.
Inflation has spiked all around the world, supply constraints remain, commodity prices have spiked, unemployment is reducing globally, and interest rates are rising in a number of countries around the world.
The American economy continues to grow in a reasonably solid way.
China’s economy also continues to grow, although perhaps at a slower pace than even they were expecting. They have taken strong action in China around what they believe to be the excesses of bloated tech companies and also the risks the economy faced with an out of control property market. Both of those items are under control. Indeed, there might be a bargain or two in the tech sector in China (Alibaba, anyone?)
Europe is obviously facing some challenges. Their economy as a whole continues to grow, although at the usual snail’s pace. Better than contraction and deflation, though.
In very simple terms, the outlook for 2022 appears to be one of ongoing uncertainty and ongoing market volatility – the more, the better! Higher inflation than we’ve seen in many years and rising interest rates.
The real question around those interest rates, particularly in the US, is how fast will they rise and how far will they rise (I will shed some light on that next time)?
Meanwhile, expect the impact of interest rates to become more meaningful to markets as we travel into 2022. Expect volatility to follow suit.
You know what that means…