The Market Value of Your Home and Your Portfolio
Market and Economic Update – Week Ended 22nd March 2019

Peter Flannery CFP AFA
“If you have one economist on your team,
it’s likely that you have one more than you’ll need.”
Warren Buffett
The Markets
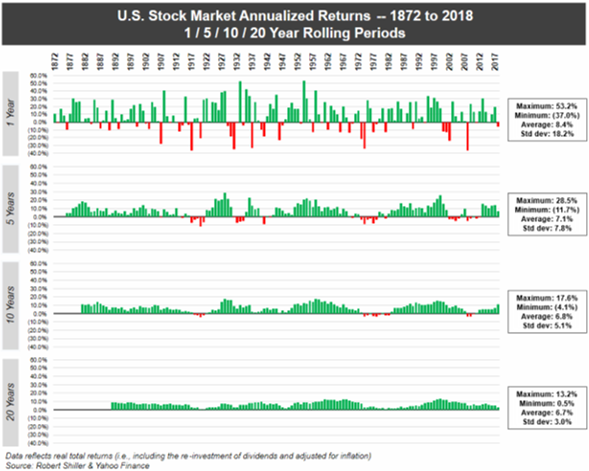
The left side axis shows the length of time in years, the right-side axis shows the maximum increase or decrease in the US market in any one year, along with the average return and the level of volatility, as measured by standard deviation.
Ever noticed how the markets weave to and fro on day to day news? Sometimes the markets move strongly on news that is significant and expected. Other times, the market does not move much when you and I might think it should. The above chart reminds us that, the longer term the horizon, the fewer market related pricing losses occur.
The upward trend in markets becomes clearer. Growth assets grow long term. Shorter term, they bob up and down – nothing new. Yet, the markets get fussy about what it considers to be bad news, creating what it still considers to be losses when prices decline. Value investors, of course, see lower prices as value emerging (the losses are simply academic).
Market prices – down and up
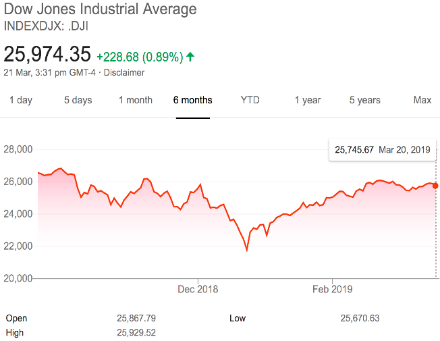
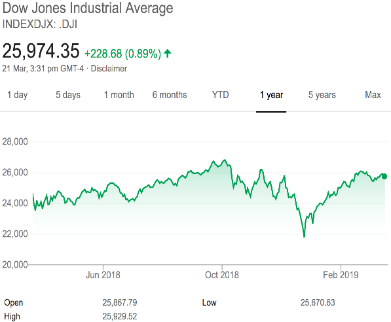
The red chart above shows the trading loss over the last six months based on the Dow Jones industrial average (US share market) and the trading gain over the last 12-months.
There has been limited news of significance to distract the markets over the last week, although of interest to me was the US Federal Reserve confirming a slowdown in interest rate hikes, as well as an end to the quantitative tightening at the end of this year. This is more evidence of what I call deflationary funk. It is not something that will show up from one week or one month to the next in the markets. However, it quietly impacts on market prices in a very stealth way.
Markets and trading prices on direct shares are considered to be related to economic growth in an economy over the long run (but not in the short term). When trading prices on the share market get too excited and rise well above economic growth, there is a good possibility of a correction. We are in that phase now, although I do not believe that trading prices are in bubble territory (ignoring the fact that everything is supported by central bank intervention).
Central bank activity
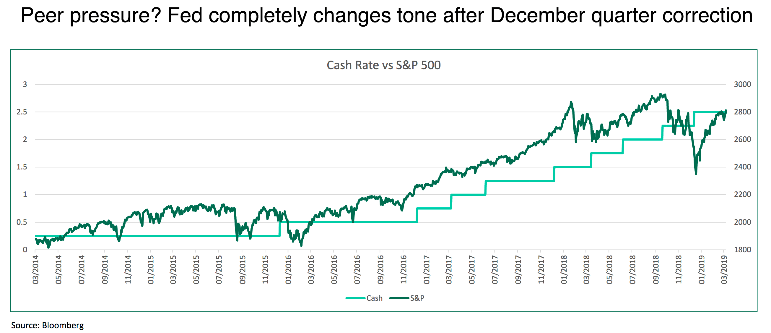
The dark green line shows the US share market, as measured by the Standard and Poor’s index. The light green line shows the cash rate in the US, as dictated to by the US Federal Reserve.
Donald Trump has been strongly against the interest rate rises promoted by the US Federal Reserve in the US of late. I trust that Jerome Powell, the US Federal Reserve Governor, is making up his own mind about interest rate direction and not being intimidated by Donald Trump!
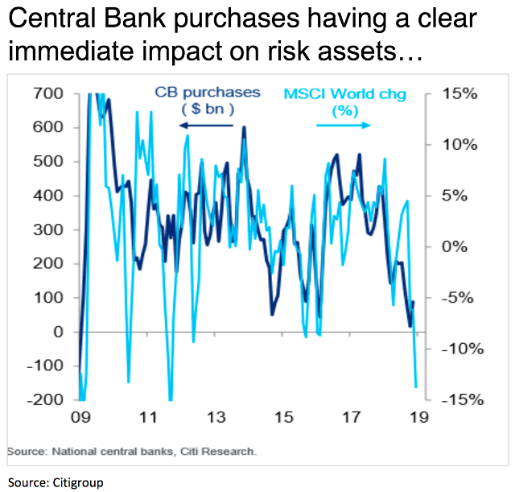
CB (Central Bank) purchases in billions of dollars is shown by the dark blue line on the left hand chart, which is the central bank adding money into the system and supporting markets. Still with the left hand side chart, the MSCI world (chg) change percentage shows how markets respond to that central bank activity. The right side chart, again, shows how central bank credit creation and share markets are correlated (run together).
There can be no doubt that central bank activity supports markets, trading prices of direct shares and also the market value of the house that you live in, along with the market value of those rental properties that you might own. I know, you might think that immigration is driving up house prices.
This is a valid assumption; however, it is not immigration alone that drives house prices in an upward direction. What about interest rates declining over the last 30 years or so? What about the low level of interest rates, not only in New Zealand but in many countries around the world, some of which are at all time lows, some of which are indeed negative (eg Japan)? What about the easy lending conditions over the last 30 years and its impact on the market value of property?
Rightly or wrongly, the central banks are inextricably entwined not only in balance sheets in far off lands in other countries around the world, but also in the price of your house and those listed businesses that you own (shares).
The good news is, this does not mean that we cannot progress and indeed be prosperous over time. However, from an investment point of view, we need to be careful that we do not forget the role that central banks around the world play. They are not the only variable that we must consider but an important one nonetheless.
ECONOMIC UPDATE
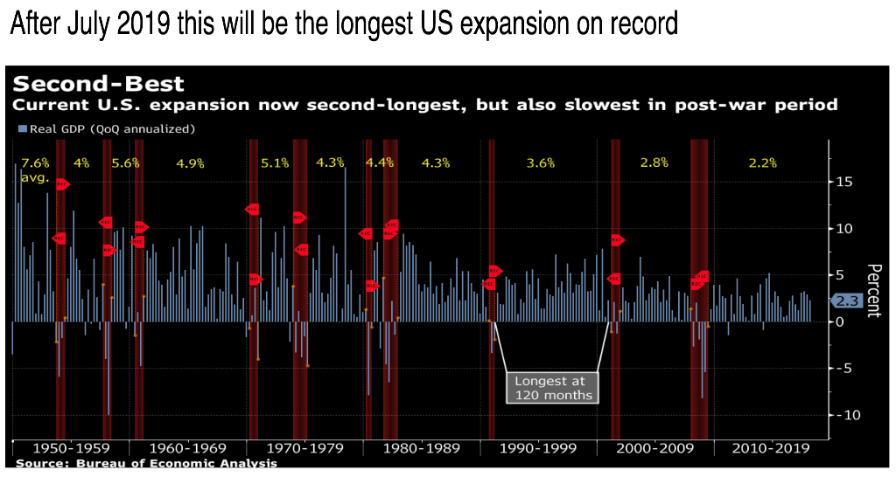
The above chart shows the current expansion in the US economy currently underway, being the second longest in history.
Why are we in the second longest economic expansion in US history? There are other factors however, in my opinion, the main reason is ongoing central bank intervention (the US Federal Reserve). I also argue that the US economy, like most other economies around the world, is better placed than at, pretty much any other time in history.
Sure, there is too much debt sitting around, not only in the US economy but also globally. That debt, however, in my view, is manageable. Granted also, if you simply removed fiscal stimulus, then we would have, I imagine, an economic collapse and life as we know it would change.
At the same time, we have in America, still; strong rule of law, low population per hectare (massive resources), educated population, strong use of technology and innovation. This does not mean that other countries, like China and India, are not catching up. It still means that the US economy is in reasonably good shape. Central bank activity, as I said though, is a strong supporting factor.
The most interesting event over the last week, to me, was the US Federal Reserve signalling that there are unlikely to be any rate hikes in 2019. In addition, what was more surprising to me, was that they said they will stop reducing the $4.5 trillion worth of so-called QE assets (the money they have added into the system over the last 10 years, as a result of the GFC).
What we now have is a situation where interest rate hikes in the US are on hold until 2020 more than likely and the so-called ‘quantitative tightening’ (the US Fed taking back the money they created since the GFC) will stop at the end of this year. What this means is that deflation is lurking, is not far away.
That also means more pressure on house prices and direct share trading prices, slowing down their growth in the medium term potentially. Obviously, share prices rise over time as businesses grow and are sustainable, not because everyone likes those investments because their share prices rise, but because the performance of the underlying business supports the intrinsic value of that business and therefore the trading price. There is nothing like an overexcited and greedy market to drive a share price beyond where it should be. Then, we should not be surprised when their fickle behaviour reverses and the trading price declines sharply.
The word across the US market is that, whilst the US economy seems stable and growing slowly but surely, some business leaders are concerned about softening confidence with hiring plans, capital investment and sales expectations starting to dip. In addition, there is increasing concern that policy mistakes out of the White House may damage the economy in the medium term. For example, the trade talks with China, some suggest, may not see Donald Trump gain the concessions that he is looking for. Therefore, we have an increasingly protectionist US economy, which in the long term is unhealthy. Steady as we go right now though for the US economy generally.

It would be interesting to know how many Brits regret the move to leave Europe.
There is a rising populous ground swell that appears to be increasingly anti-establishment. Many people in Britain do not like the idea of being dictated to by the Europeans. Also, they do not like the fact that people from other countries are coming to live in their country and from their perspective, also taking some of their jobs too. This is not new. I remember living in London in the early 1980s, and at that time, the suburb called Hounslow looked a suburb of Mumbai, India. Indeed, London has been a multicultural society for decades already.
Anyway, Theresa May’s latest deal has been rejected and so the drama continues … not long to go now. A no-deal Brexit would appear to be quite damaging for the UK economy in the short term and simply not the way to go. I doubt it would destabilise the global economy, although markets, of course, will react at the time in a way that is difficult to predict.
The deadline looks like it will be extended but some are now suggesting that Teresa May is happy for the negotiations to extend right to the last minute so that the “nay sayers” are forced to accept her deal in order to avoid a “no deal” Brexit. A no deal Brexit would be uncertain and potentially very messy.
Australia
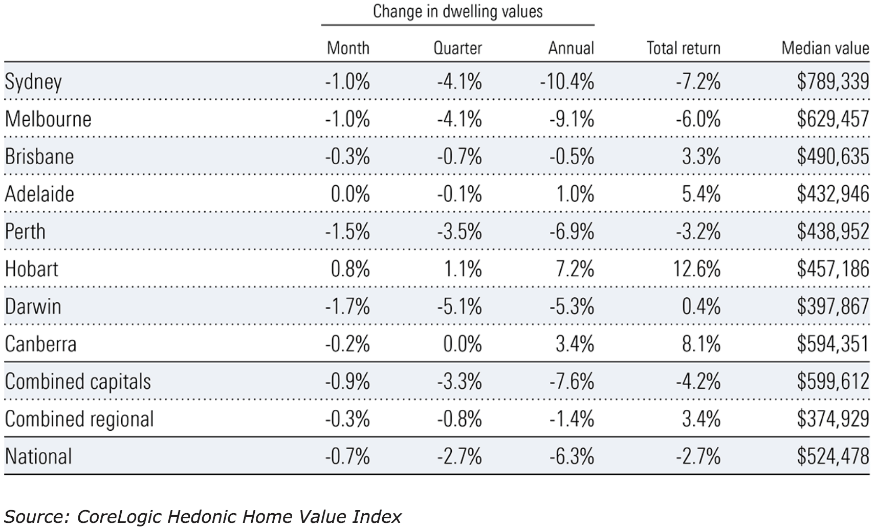
The above chart shows the change in the price of housing across Australia.
House prices do not go up in a straight line forever – Japan demonstrated this many years ago. Now it is Australia’s turn. As you may be aware, housing generally around the world has been expensive for decades. This leads people to think that it is normal. The downturn in housing is creating the so-called ‘negative wealth effect’ which may turn into an interest rate cut in Australia some time this year. Not only that, increasingly, there is a rising sentiment around a second rate cut before the end of 2019. More evidence of deflation. This is not an Australian issue, I believe it is a global issue.
When we look at investors and their behaviour and then we look at how market cycles work, investors generally have a limited attention span. Many investors forget that market cycles and the underlying dynamics take no account of the weekly, monthly or annual calendar. The market just does not care. Add to that central bank activity and intervention, right there you have extended market cycles like we are seeing now. For example, in New Zealand, we have seen interest rates decline for around 30 years. That looks like lengthy cycle.
The financing of houses in Australia continued to fall in January and new housing loans are approximately 25% below their 2017 peak. Investor loans are down by around 50% and owner/occupied lending is down by almost 20%. This appears to be due to some oversupply of apartments in the likes of Sydney, Melbourne and Brisbane, the restrictions placed on borrowers by the banks, who in turn had restrictions placed on them by the Reserve Bank of Australia. These factors have contributed to the slowdown. It all sounds a bit negative, although if you think about it, this is a natural response to stretched prices and a changing set of circumstances that must inevitably impact on prices. Frankly, there is nothing new here.
Perhaps what is a bit interesting is that these falling house prices may be affecting household consumption in Australia. Retail sales edged up slightly by 0.1% from December but was below expectations. The housing weakness in Australia is contributing to the tepid growth in household consumption, along with a lack of real wage increases.
In addition, it appears that the National Australia Bank monthly business survey for February revealed a decline in business confidence and business conditions, with both readings now sitting below average. These are not significant declines but interesting to observe nonetheless. Coming up too in Australia is the federal elections in May. The scuttlebutt evidence suggests that politicians, driven by their own self-interest, are putting together ‘lolly scrambles for voters’ which is the same as spending money they do not have. Of course, in the end, it is the Australian taxpayer who will pay for that.
New Zealand
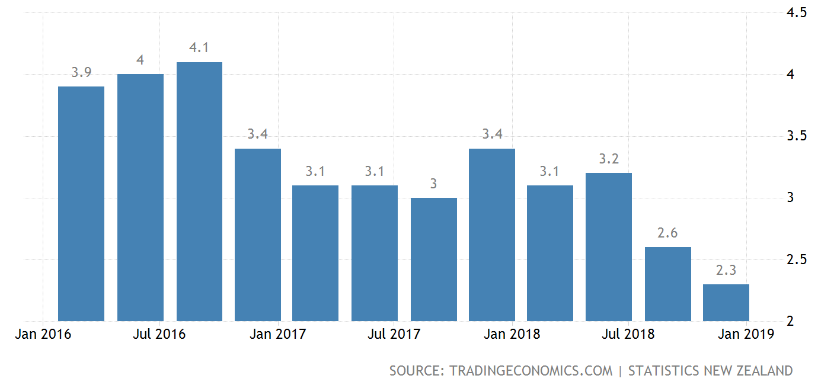
The above chart shows slowing economic growth in New Zealand.
Growth in New Zealand is trending slower, as the chart above shows. New Zealand’s economy expanded as pretty much expected by the market by 0.6% in the December quarter of 2018, according to Statistics New Zealand. The Reserve Bank of New Zealand was looking for growth of 0.8%.
This result was an improvement from the September quarter of 2018, which saw growth of 0.3%. Economic growth in New Zealand increased by 2.3% from December 2017 quarter to the December 2018 quarter. Because the Reserve Bank of New Zealand was projecting growth of 2.7%, some are starting to think that the Reserve Bank of New Zealand may be reassessing its official cash rate outlook.
The average growth rate over 2018 was 2.8%, which is the slowest growth since 2014. Drilling down into some of the drivers, nine of the 11 service industries recorded increases. The growth in the sector was led by a 2.5% increase in retail, trade and accommodation, and a 3.2% increase in warehousing, transport and postal services.
Household spending was up 1.3%. Agriculture, forestry and fishing production, however, fell by 0.6% in the December quarter, with agriculture leading the decline, down by 1.3%. Manufacturing activity continued to decline, down 0.4%.
Economic commentators around New Zealand appear to be divided around where to from here. The outlook right now is stable to soft but of course, it will be significantly determined by what takes place on the global scene.