Markets and The Economy
Market and Economic Update – Week Ending 2nd November 2018

Peter Flannery CFP AFA
“If you have one economist on your team,
it’s likely that you have one more than you’ll need.”
Warren Buffett
You may have noticed over the last week or two, I have included content around markets, as well as economic information. I mention this because markets and the economy are two totally different areas.
The markets tend to relate generally to the pricing of assets and prevailing sentiment, whereas the economic content relates to countries and their individual performance in each area of their economy, eg unemployment, interest rates, economic growth and so on. Markets, by the way, do not always lead us in the right direction or tell the truth. That is because markets are generally a function of sentiment, which as you may know usually has little to do with logic. That is especially so in moments of turmoil and uncertainty. That is why focusing too much on short term market movements is really a waste of time. However, some people believe this is the way forward.
Please let me know if you have thoughts either way about whether I should include market content in the future as part of a mix or whether I should just stick to economic data in the weekly economic update. Just e-mail admin@wiseplanning.co.nz to let me know your thoughts.
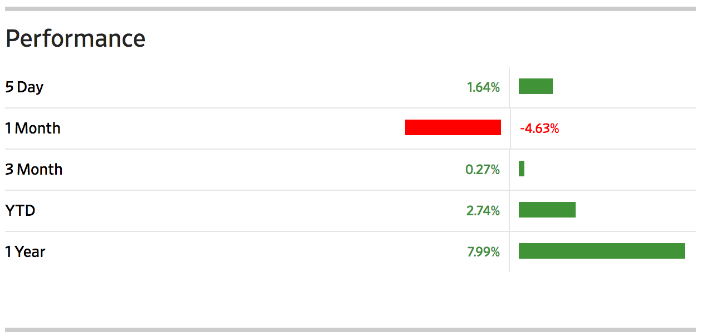
THE MARKET
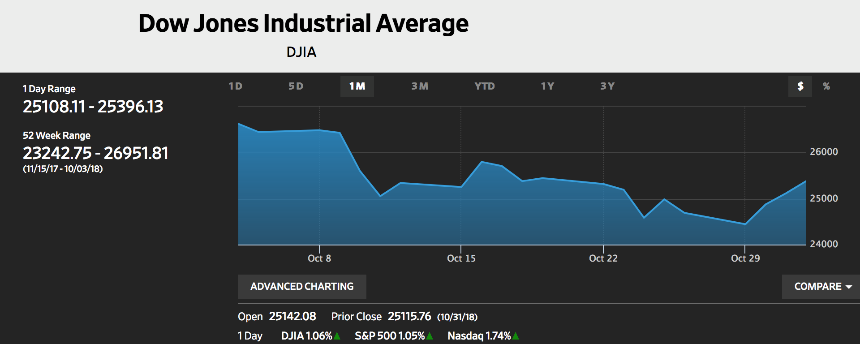
The above chart shows the decline the Dow Jones index over the last month.
Volatility continued across the markets throughout October, which interestingly is often a month of, at times significant downside volatility. What does it mean? I suspect if you worry a lot and focus on short term price movement, this and other measures of share market volatility might be something you would focus on. On the other hand, if you are wise, you will see it as merely “usual / normal” pricing volatility caused by events that I reckon in the next several months, not to mention in five years from now, everyone will have forgotten about. What about you though? Were you worried? Did you see this as opportunity?
The movement in the S&P 500 (share market index). Are you happy or unhappy after looking at this chart?
It is all a matter of perspective really – isn’t it? We know the US economy is reasonably strong. Not only that, over 80% of companies have announced their profits as earning season is now well underway. Indeed, this whole earnings season thing is strongly followed by most participants in the markets, all around the world. Quarterly profit announcements are considered appropriate in order to keep investors informed of what is going on with companies.
That has led to analysts, share brokers and other investors to focus strongly on these quarterly announcements, which are taken very seriously. Indeed, good businesses with sound economics can see their trading prices decline sharply if the market becomes uncomfortable even with a near miss (e.g. actual earnings coming in lower than expected). Sometimes these near misses (earnings miss or revenue miss) can signal troubling times ahead for a particular business. More often than not though, they are just reporting a period of time that was less favourable than expected – there is nothing actually wrong with the business. Of course, the media would not have us let the underlying truth get in the way of a good story though!
ECONOMIC UPDATE
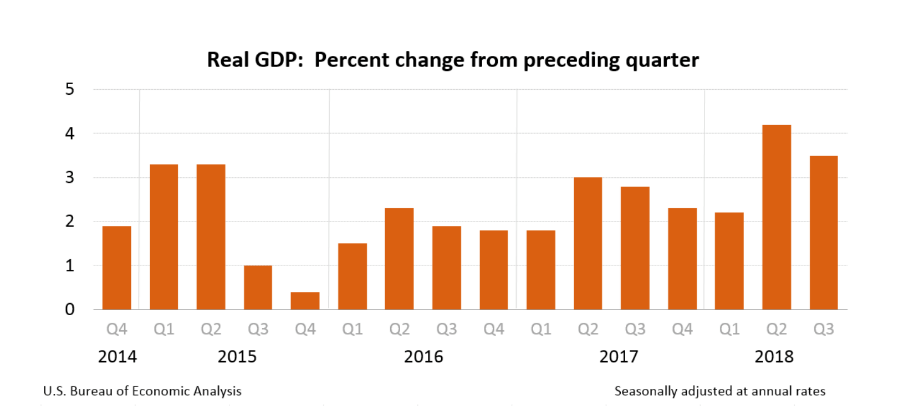
The above chart shows economic growth in the United States of America.
Real gross domestic product in America (GDP) increased at an annual rate of 3.5% in the third quarter of 2018 (see chart above), according to the advance estimate released by the Bureau of Economic Analysist. As you can see from the chart above, GDP increased at a rate of 4.2% annualised in the second quarter – good going by the US economy, at least on the surface.
By the way, a second estimate for the third quarter will be released around the end of November 2018. Increasing growth in the American economy is a good thing, however it is less good when you realise that some of that growth is due to increasing debt. To be clear, the economic growth in America is not all down to economic productivity but rather partly through economic activity and partly through stimulus (increasing debt) – just saying.
I would not lose sleep over it. At the same time, we are not so naïve as to accept the headline number of economic growth published by the popular media without drilling down to take a closer look at what is actually driving economic growth. Although I believe the US economy will cope with the increasing debt and the increased debt servicing, nonetheless debt servicing as a percentage of economic productivity is increasing every year. Just to push this point home, take a look at the chart below.
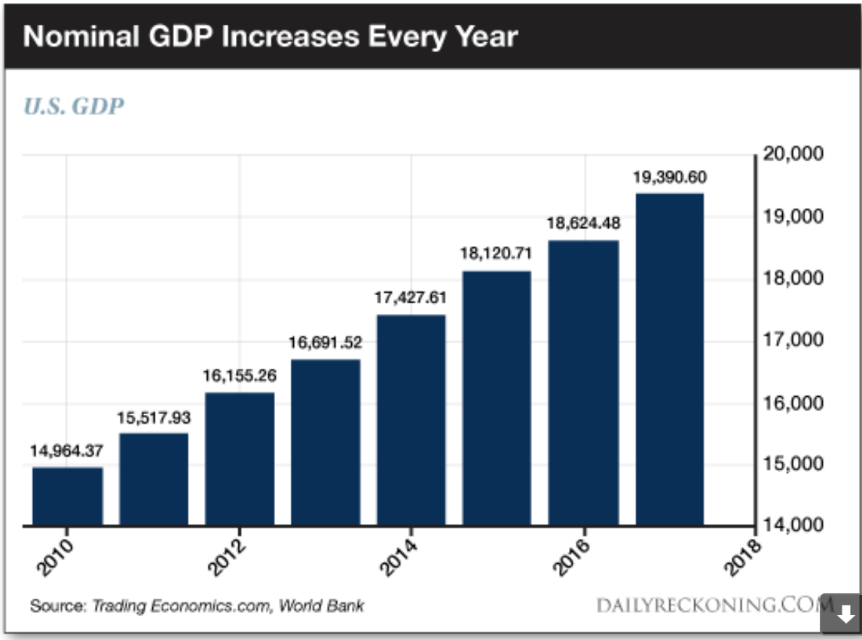
The chart above shows nominal GDP increasing every year since 2010.
The point of the above chart and the point I am making is that whilst the chart above shows nominal GDP increasing every year, the reality is that national debt by comparison has doubled since 2010. Of course, it is old news but just a reminder that the US Federal Reserve has significantly increased its balance sheet by nearly $4.5 trillion as it battled against significant economic head winds out of the 2008 global financial crisis.
Don’t worry. As I pointed out in both of the roadshows that I have conducted this year, America has an economic package that is unique. It will cope with current and future head winds, just like it has done for over 200 years. There is nothing wrong with being aware of what is going on at the moment. It is sometimes useful too, to put it all into perspective and to realise that whilst the “flavour” of the challenges and difficulties facing the US economy are different to the past, they are nonetheless challenges that the US economy, because of its ‘unique package’ is well positioned to cope with. Let’s face it, there are lots of books that have been written and many articles floating around the internet that have suggested over the last 30 years that the American economy is heading for a major crash any time soon. Yet, here we are, still …
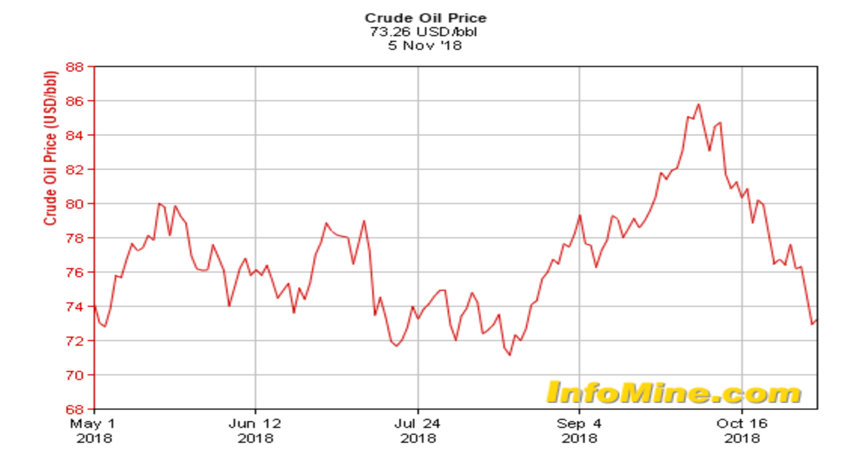
The above chart shows US oil price movements.
President Donald Trump, in May this year, announced that he would end their participation in the Joint Comprehensive Plan of Action, a 2015 agreement aimed at putting pressure on Iran’s nuclear activities. This was signed by Iran, five permanent members of the United Nation’s Security Council and the European Union too. This put the United States on a path to reimpose sanctions on Iran. This, of course, created concern around the world and as a result, oil prices climbed to their highest level since 2014. Interestingly, since then, the concern across markets has dissipated.
Back here in New Zealand, the latest QV house price data for October shows that prices across New Zealand are up 5.4% over the last 12 months but only up 1% over the last three months. More specifically, in Auckland, the change in house prices over the last 12 months increased only 1.1% with an actual decline in house prices over the last three months.
Interestingly, www.realestate.co.nz released data for October showing an increase in the number of unsold properties. Nationally, with the current number of properties available, there is 20 weeks’ worth of sales up from 17 weeks in September. In Auckland, the level is up to 25 weeks, which by some measures, is the highest since 2011. In theory, this means ongoing head winds for house prices in some areas around New Zealand.
Did you know that New Zealand is one of the few developed countries that does not have a protection for those investing in term deposits in the bank? In Australia, for example, there is a guarantee for depositors up to $250,000. This is interesting because whilst it is not common for banks to fail, it has happened in New Zealand in the past (remember, the BNZ).
Those who worry about investing in property and shares invest in bank term deposits because they believe their money is safe. In short, with no government guarantee, their money is safe until it is not. That time comes when there is a significant credit crunch globally, along the lines of what we saw in 2008, or when inflation returns, making the real value of their capital worth less and less as each year goes by and of course, the income off that capital also worth less and less. In an extreme situation (e.g. global debt at record levels) potentially “worthless”.
Finally in currency news, the New Zealand Dollar spiked up against the US Dollar from 0.6427 on 8 October to 0.6662 as at 2 November 2018.