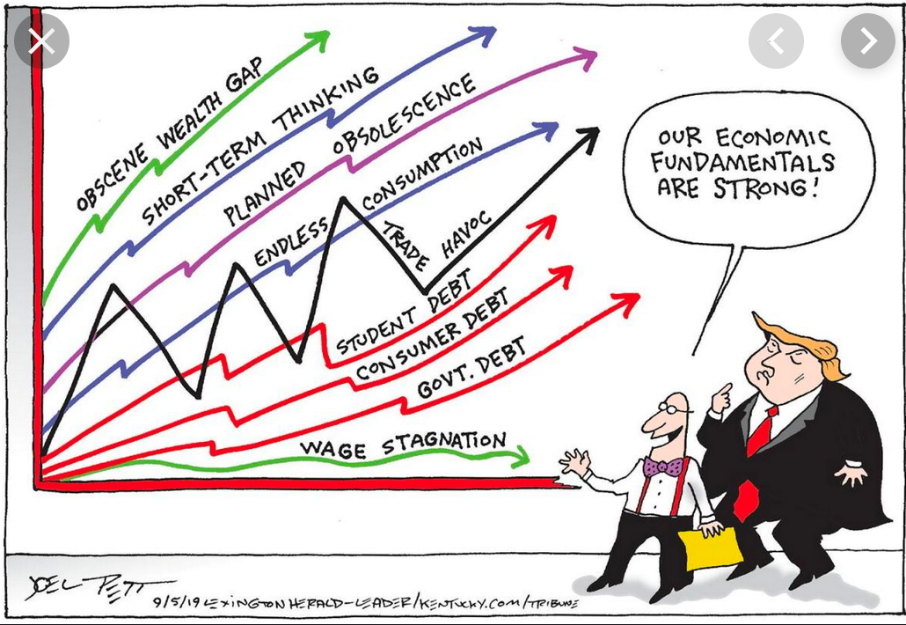
Does a Trade War = 0 Growth!?
Market and Economic Update – Week Ending 18th October 2019

Peter Flannery CFP AFA
“If you have one economist on your team,
it’s likely that you have one more than you’ll need.”
Warren Buffett
THE MARKETS
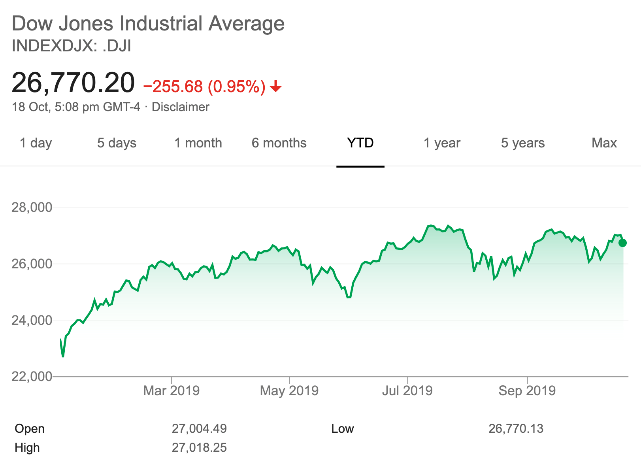
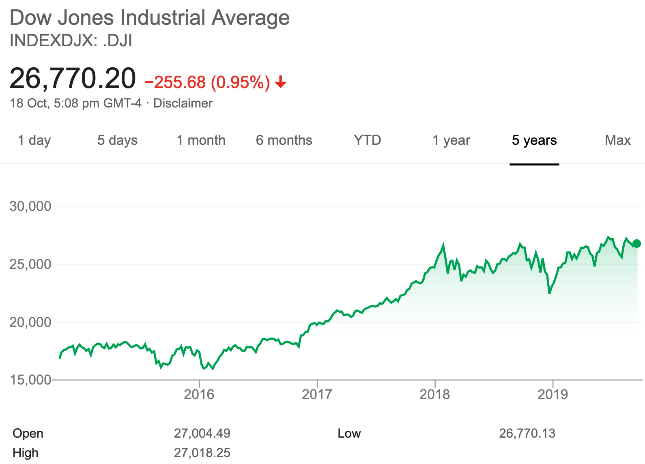
The chart on the left hand side shows the Dow Jones Industrial Average movement year to date. The chart on the right hand side shows the Dow Jones Industrial Average over the last five years. Both charts are notably green.
Experienced investors know that the longer you invest the smoother that line, indicating the movement in the index you are looking at or, for that matter, the cash up value of your own investment portfolio.
In the short term, that line looks particularly jagged.
Actually, the jagged nature of that line can work for us or against us.
It works for us if we understand that lower prices mean better value, but against us if we lament lower prices or, worse still, we worry about those lower prices.
Anyway, despite the doom and gloom that seems to surround the markets with regard to the likes of Donald Trump, Brexit, riots in Hong Kong, slowing Chinese economic growth and so on, markets continue to rise. The US market and the New Zealand share market in particular have continued to increase steadily, whereas the Australian market by contrast has not fared so well.
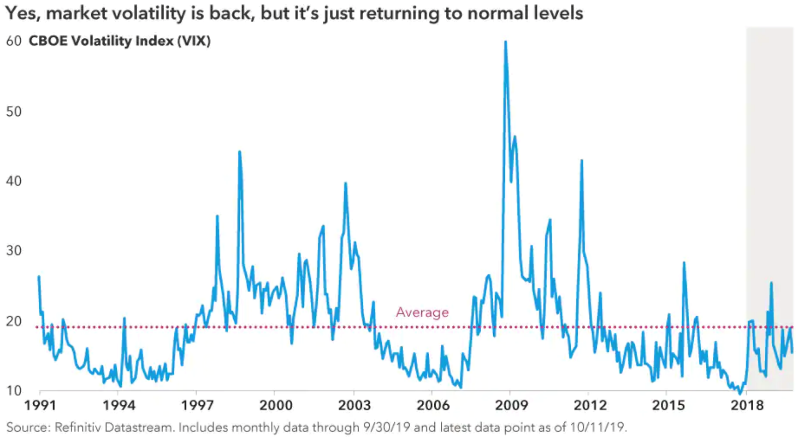
The above chart measures the volatility of markets.
The VIX Index is a well known indicator of market volatility. I always find it interesting to reflect back during times when the VIX Index peaked (see 2009 for example). Those that were worried or scared about crashing markets can now look back and see that actually, everything is okay. The lower prices indeed do mean better buy prices, providing we select quality investments. Anyway, it looks as though there is an increased level of volatility over 2019, which is more about volatility getting closer to normal levels than it is that markets are particularly uncertain.
Volatility is desirable for us as value investors. However, just because prices drop a bit does not necessarily mean that value has emerged. In this environment, whilst prices are not in my opinion excessively expensive, they are expensive enough that it takes a sizeable pricing drop (20%+) for value to emerge across markets. That is why it might look as though my recommendations are somewhat flatfooted when I have said that when market prices drop is the time to buy. Lower prices in this environment usually mean that prices are just less expensive rather than cheap. That said, taking a longer term view and if you are happy to ride through the volatility, there can be some merit in just adding to positions in any case. Still, we need to be mindful of the fact that prices are generally expensive. The reason to be mindful is that if the market becomes strongly negative, there will be a significant decline in trading prices and therefore the cash up value of your portfolio. Again, nothing to be concerned about. Indeed, it is an advantage if you have sufficient cash to take advantage of those low prices. As I have mentioned on many occasions, when markets are rising, any amount of cash is too much. When markets decline, any amount of cash is likely not enough!
ECONOMIC UPDATE
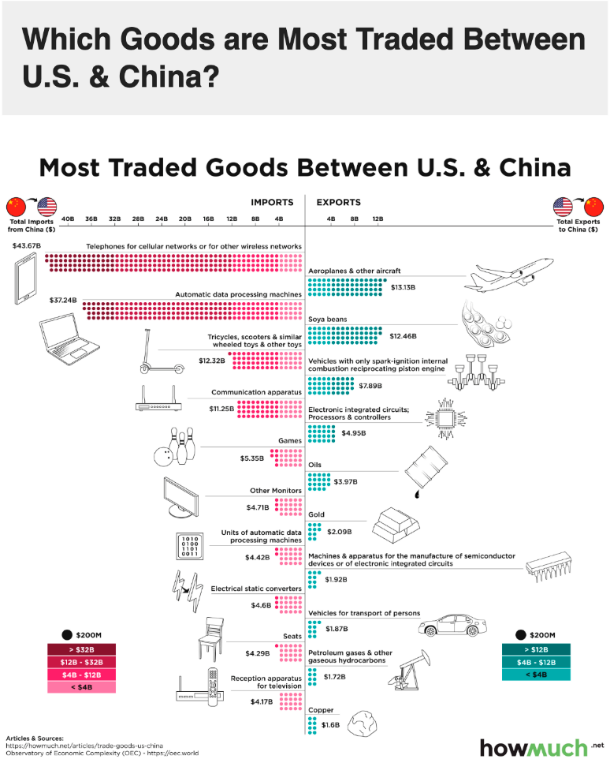
The above chart shows the trading mix between the US and China.
The trade dispute between China and the US is often called a trade war. I see it as more of a trade adjustment. This is where Donald Trump is looking to even things up a bit so that the trading deficit that has emerged over the last 10 years is brought back into line from America’s perspective. That trade deficit has doubled over the last 10 years and arguably, Donald Trump is right to address it (his approach to it is his approach and not necessarily how others might address it notwithstanding!).
It is interesting that China used to be America’s number one trading partner and has now fallen since to only their third largest trading partner. For example, US soy bean exports to China are also expected to be about one third of what they were only one year ago.
The latest round of negotiations offer limited detail right now however it appears that Donald Trump is looking to potentially continue these negotiations with the current talks labelled as “phase one”. Donald Trump says that if things are not tidied up, they will look to initiate phase two and phase three in order to secure a good deal for America. In general terms, the agreement seeks to address intellectual property and financial services concerns along with the purchase of about $40 billion to $50 billion worth of agricultural products by China, Trump said. He sees this as a ‘tremendous deal for farmers’.
Interestingly, when Donald Trump was asked what was different about this deal from prior discussions, Donald Trumps answer was that this deal is “bigger”.
When Chinese Vice Premier Liu He was asked the same question by CNBC, he said the difference is ‘cooperation’.
It sounds as though they are both still on quite different pages, as it were, however possibly heading in the same direction?
Global Economic Growth
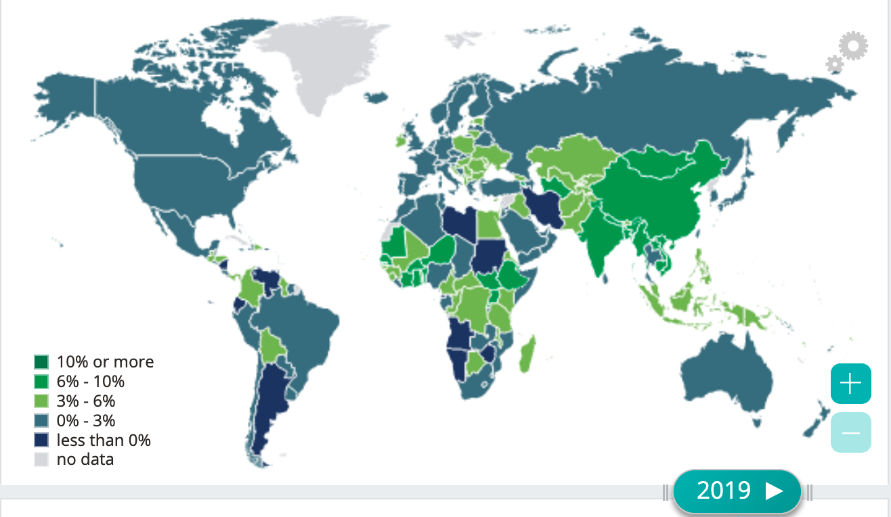
The above chart shows estimated growth around the world over 2019.
The short of it is that global economic growth continues to run at between 3% and 3.5% per annum but is being scaled back over the next year or two.
The short term outlook is approx. 3.00% global growth. I have seen no prediction or estimates looking at zero economic growth.
Although Europe continues to struggle along, it remains stable.
The US economy continues to grow at somewhere between 2.5% and 3% and the Chinese economy continues to grow at around 6%.
At least from an economic perspective, it is steady as we go with regard to global economic growth.
Interest Rates Australia
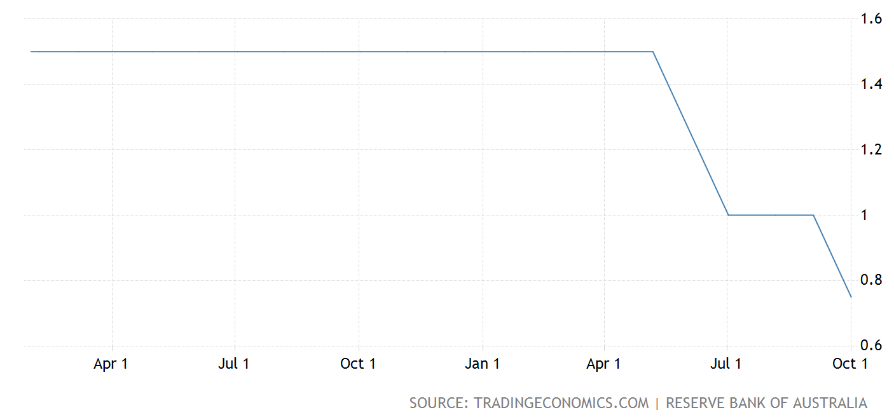
The above chart shows the movement in the official cash rate in Australia over the last 12 months.
The Reserve Bank of Australia lowered its official cash rate by 25 basis points to a new record low of 0.75% during its September meeting. This is the third rate cut this year which aims to support income growth, employment and to provide broader confidence that inflation will be in line with its medium term target.
The ongoing talk around interest rates is that policy makers are prepared to lower interest rates further if need be. Although it is always difficult predicting the future however, I suspect there may be a need to do so. The global economy continues to grow at around 3% (as measured by Gross Domestic Product, GDP) however, global deflationary funk remains.
Economic Growth New Zealand
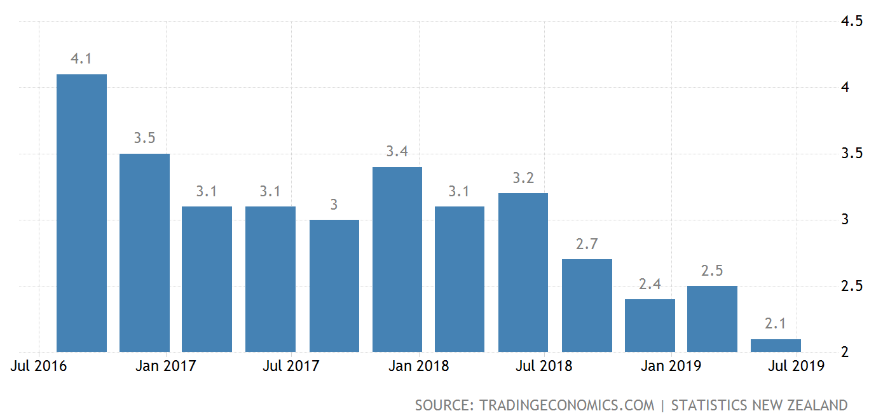
The above chart shows economic growth in New Zealand from around mid-2016.
You have probably noticed the banter across the media about slowing economic growth in New Zealand. We may not be the Rockstar economy anymore however nonetheless economic activity in New Zealand continues to expand, albeit at a slower rate.
As an aside, the recently announced $7.5 billion surplus, the highest since 2008, is a short term indicator that things might be improving fiscally as far as the crown accounts are concerned however, some of that 7.5 billion dollars was due to one off revaluations. For example, Kiwi Rail contributed two billion dollars to that surplus because of the way it is now valued. Anyway, the government books show employment, wages growth and corporate profits were higher than expected in the 2019 budget with tax receipts from wages, for example, up 7%.
This all contributed to tax revenue coming in at around 2.1% above forecast. Compared to other economies around the world, NZ government debt is reasonably low, which does provide the economy with some “wriggle room” should things get difficult offshore.
Here are some of the numbers for the period ending June 2019:
- Surplus – 7.5 billion dollars, up 2 billion dollars compared to the 2017/18 period;
- Net debt – 19.2% of GDP, down from 19.9%;
- Tax revenue – 2.1% above forecast;
- Unemployment – 4.1%, down 0.3%;
- Inflation – 1.7%, up 0.2%;
- Average pay – $31.84 per hour, up 3.5%; and
- Real GDP grew by 2.6%.
Interest Rates New Zealand
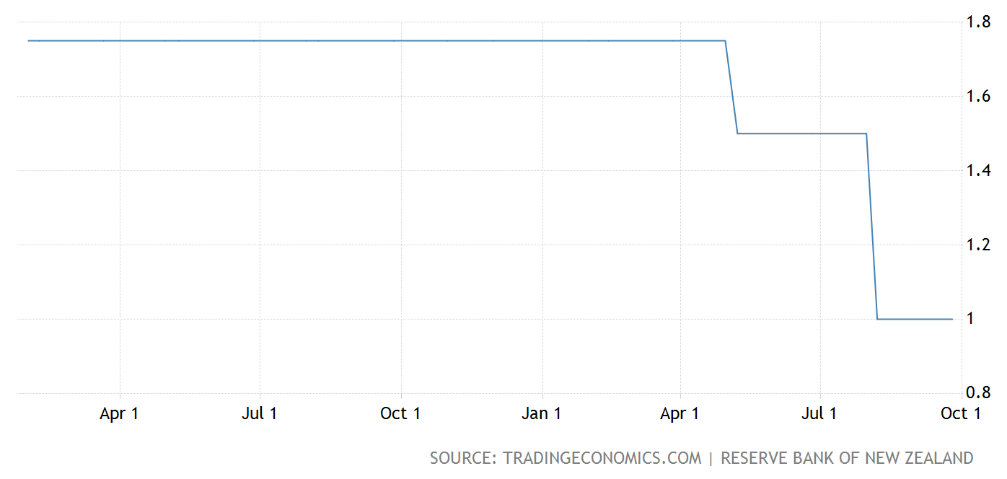
The above chart shows the movement in the NZ official cash rate over the last 12 months.
Interest rates have continued to decline over the last 12 months, and it is entirely possible that we will see another two or three rate cuts over the next 12 months – time will tell.
As the chart above shows, the Reserve Bank of New Zealand left its official cash rate unchanged at the record low of one percent in September as widely expected. The Reserve Bank have made it clear that they will take action if required by not only reducing interest rates, but also adopting other fiscal initiatives if needed.
Like other central banks around the world, the New Zealand Reserve Bank remains focused on global trade and other political tensions around the world, which continue to impact on global growth and also dampen demand somewhat for New Zealand’s goods and services.
Low interest rates and increased government spending are expected (in theory) to support a pick-up in household spending along with construction activity. As you may have noticed, a decline interest rates is usually followed by a weakening in the New Zealand dollar.
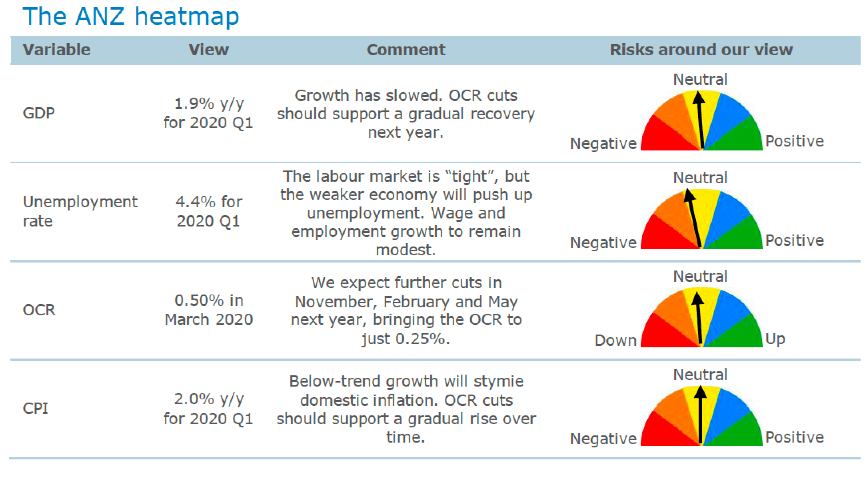
The above chart shows ANZs heat map indicators.
The above is a great representation of that phrase you have heard many times, ‘steady as we go for now’. The New Zealand Reserve Bank, like many others around the world, is charged with the responsibility of stabilising their economy and reducing unemployment, among other initiatives. It is fair to say, in general terms that this has been achieved. The ANZ heat map above confirms this to be the case.
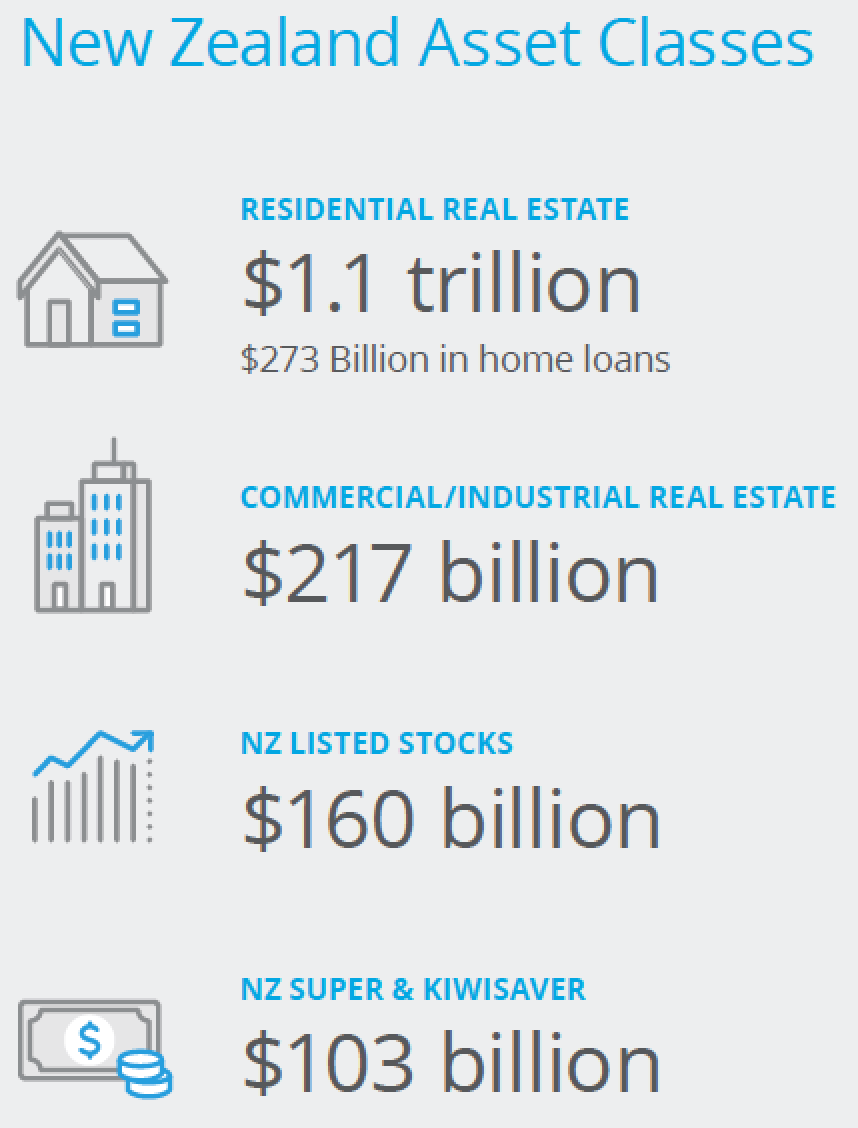
The above diagram shows the varying popularity of real estate, direct shares and NZ super/Kiwisaver schemes.
The total value of residential property remains above $1 trillion with mortgages secured against 24% of this value. That represents a high level of equity.
That said, another important measure is debt servicing and the way we can look at that is to compare household debt, which is relatively high compared to incomes or the ability to service that debt. Banks look closely at the debt servicing ratio when lending out funds.
Interestingly, recent data shows that lending flows are being driven by larger, average sized loans. This is likely sustainable in the current low interest rate environment, although tighter bank capital requirements, and the possibility of some rising mortgage interest rates as a result, could be a test for those borrowers on the fringe at some point.
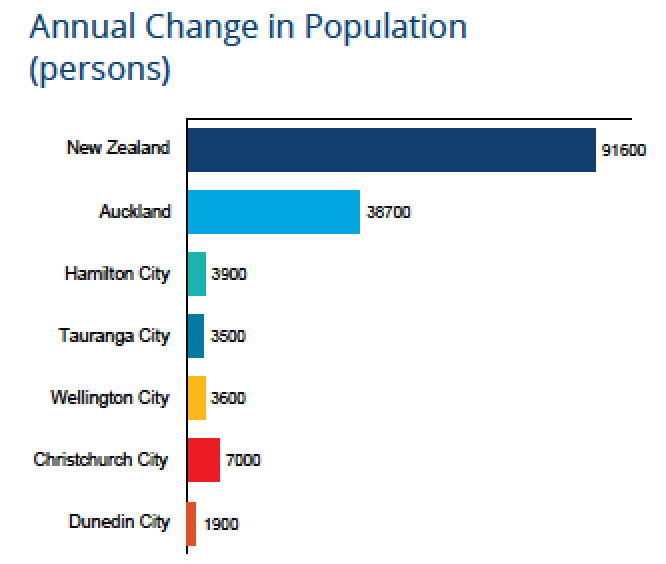
The above chart shows the increase in population in each centre.
Obviously, increasing population and low interest rates are two key contributors to stable residential property prices. Although the increase in residential property prices in Christchurch do not appear to reflect the population intake, note that Christchurch City has the second biggest intake of immigrants next to Auckland, who is number one.
Population growth held steady at 1.6% annually for the second quarter of 2019 with the new total now a bit over 4.9 million. This is a slower pace of growth compared to three years ago when population growth was tracking a bit faster at 2% annually.
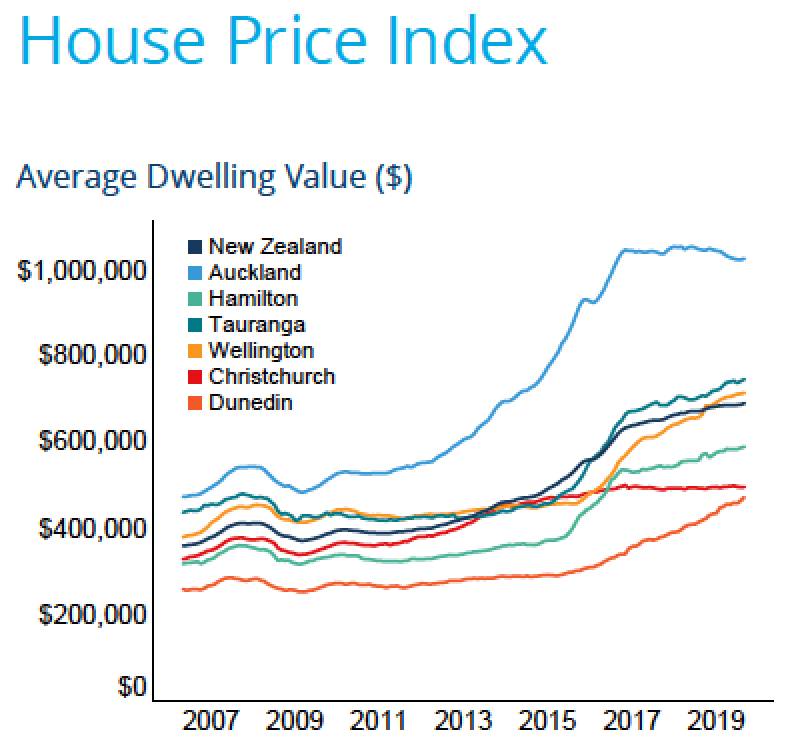
The above chart shows the change in property trading prices since 2007.
Dunedin remains one of the most buoyant main centres with the average property price rising by 12.8% for the year ended September 2019. Demand in Dunedin remains strong and listings relatively low. Wellington shows a similar pattern although recent evidence suggests Wellington’s residential property price rises are starting to flatten.
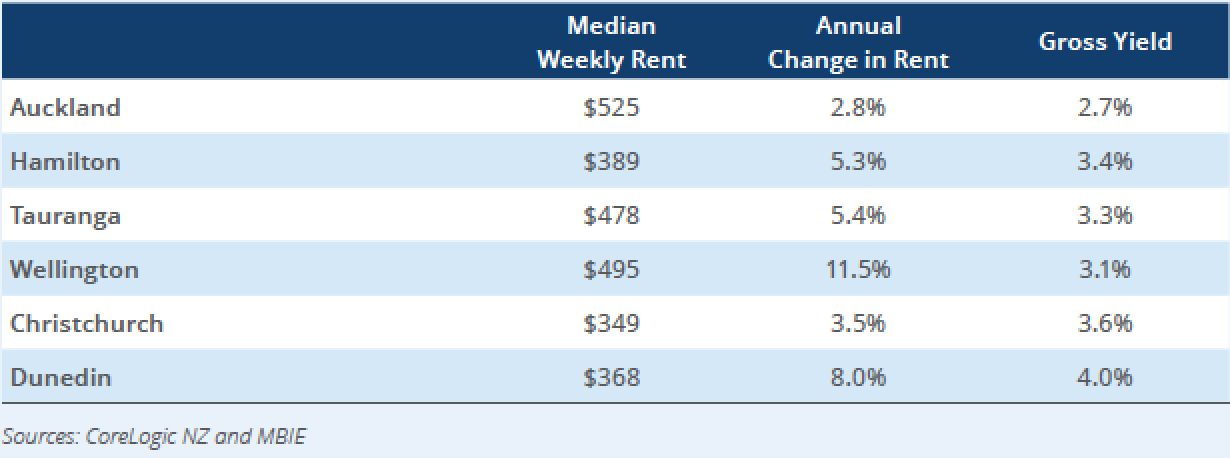
The above chart shows the gross yield and the annual change in rent across the main centres throughout New Zealand.
The big picture macro trend continues with property prices rising, although a bit slower than previously. Rental yields are low but interestingly the last 12 months has seen an increase in rents across New Zealand.
Rising rents may help support residential property prices although the major contributors remain interest rates and supply/demand tensions.
Of course, as I also mentioned on numerous occasions, residential property, apart from the fact that people live in houses which makes them popular for that reason, from an investment point of view they tend to be more of a “religion” rather than a logical investment. The facts are that a gross yield of between 3% and 4% does not leave much room for the payment of interest (for properties funded by debt) plus rates, plus insurance, not to mention maintenance costs over time.