The Global Economic Slowdown Looms and Here in NZ…
Market and Economic Update – Week Ended 15th March 2019

Peter Flannery CFP AFA
“If you have one economist on your team,
it’s likely that you have one more than you’ll need.”
Warren Buffett
The Markets
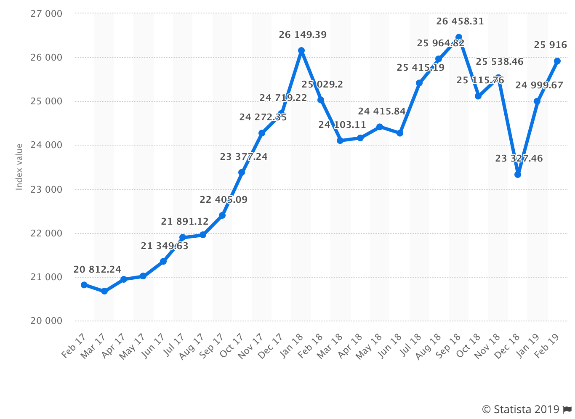
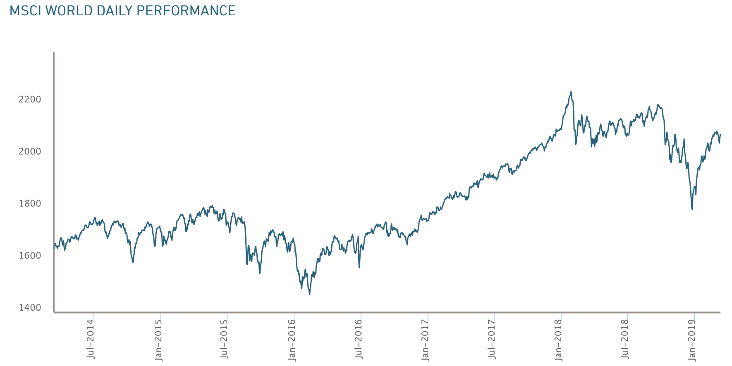
The left side chart is the US share market, based on the Dow Jones Index. The right side chart is the Morgan Stanley capita index, showing price movement in global markets.
The volatility over the last quarter of 2018 was due to a number of factors, a major one being the market’s perception (myself included at the time) of the impact that ongoing interest rate increases in the US, along with fiscal tightening (taking back the ‘printed money’ from the last 10 years) might have on the market. At the time, the markets seem to be bounce from interest rates, fiscal tightening to Brexit, to trade tensions between the US and China and back again. Since January this year, the markets appear to have concluded that actually, there is nothing to worry about, although the Federal Reserve Governor saying that he may be slowing down interest rate hikes, in my mind, was a key factor, allowing the market to take a sigh of relief. Otherwise, I believe the market, as it sometimes does, worried about itself worrying and then realised that there was no need to worry.
The outlook, as I have been suggesting over the last month or two, is for a global economic slowdown, which the market is keenly aware of but so far it has not created significant concern. Evidence of this, I think, is the fact that there was a surprising decline in the number of new jobs created in the US, but the market appears to have shrugged it off. From an economic perspective, rising unemployment can signal tough times ahead. Therefore, from a market perspective, the markets can worry that other participants will worry and in an attempt to beat others to the exit door, they can sometimes start the selling the process as a result of that kind of indicator. As you know, it is more than difficult working out in advance just which way the market will swing as surprising data emerges. For us, of course, as value investors, this type of event is favourable. Lower prices mean better value, although the caveat to that is, as we saw over the fourth quarter of 2018, lower prices sometimes just mean less expensive, rather than real value emerging.
As I have already mentioned previously elsewhere, I was reluctant to recommend significant buying over the last quarter of 2018, not because I was concerned about the markets but more because at that time, I was waiting for the ongoing hike in interest rates to eventually impact (it always does and always will), creating a sharp decline in prices. In other words, there is little point in buying investments that are slightly less expensive when they could well be actually starting to look cheap and represent value in a bigger decline in the future. I know … how long do we have to wait?! Well, with the slowdown in US interest rate hikes, that wait could be pushed further out into the future. Otherwise, I was expecting something over 2019. Still, there are lots of moving parts to the global economy and a slowdown in economic activity can easily see surprisingly negative data emerge, which in turn can trigger a sharp decline across the markets, hopefully bigger and a bit longer than what we saw over the last quarter of 2018. The longer the current environment continues though, the more it will start to look as though I was flat-footed in the last quarter of ’18!
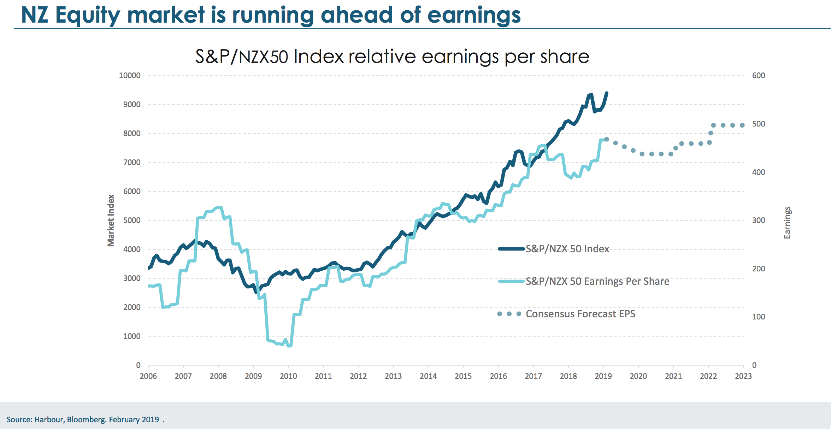
The above chart shows New Zealand’s share market prices compared to their potential earnings.
As the above chart shows, like many other markets around the world, New Zealand’s share market is expensive. This does not mean that the markets will be crashing and burning tomorrow but rather that if we are buying investments, we are paying more than they are worth. That can work but requires time and everything to go well. It is also a difficult way to maximise returns.
ECONOMIC UPDATE
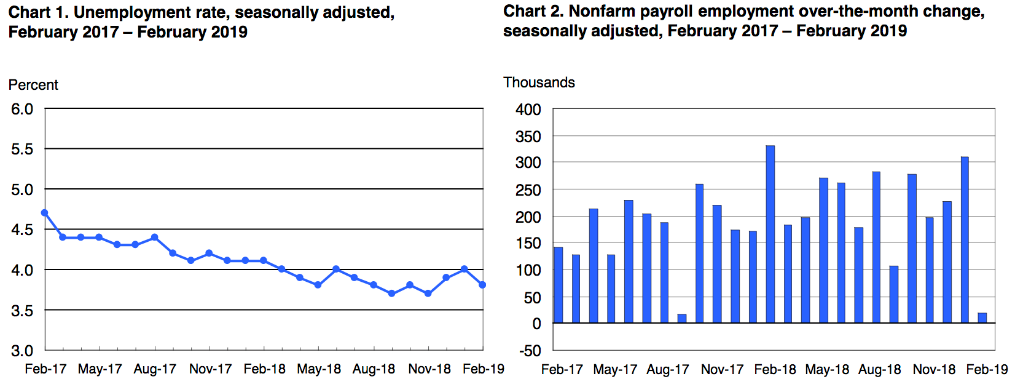
The above charts show the unemployment rate from February 2017 to February 2019, including the bar chart on the right, showing the month over month change.
Unemployment in the US has been declining steadily for some time, which is an indication that the US economy is getting on the right track. Although unemployment fell to 3.8% in February this year, job growth pretty much stopped dead in its tracks, with the now Nonfarm payroll number up just $20,000. That is not much. Indeed, it was the lowest month of job creation since September 2017, although somewhat offset by a reasonable increase in wages. That increase in wages is a good sign. It is just a question, of course, of how sustainable that increase in wages might be moving forward or whether in fact it is just a one off blip. It will also be interesting to see whether that small job growth number (the $20,000) is a one off number or whether it is the start of a new trend. I am not that concerned about it and I notice the market is not either, however it will be interesting to see what the numbers are next month.
The so-called ‘trade war’ between the US and China is undoubtedly having an impact on both the US and China. However, we are a long way from a global economic recession because of any trade war between the US and China. Of course, it is possible, however drama out of the popular media and the markets worrying about it does not always equal global economic recession. There has been some talk of Donald Trump and Xi Jin Ping meeting soon in what is being called the formal stages of negotiating a deal that may involve the lowering of Chinese tariffs on a range of US goods if the Trump administration removes some sanctions against China. Although it is somewhat anecdotal, the word is that both sides believe talks have progressed far enough that Trump and Xi Jin Ping could reach a formal agreement at a proposed meeting toward the end of this month. Trump did mention, in a media briefing recently, that the two sides were getting very close to a deal but let’s wait and see.
Interest Rates Eurozone
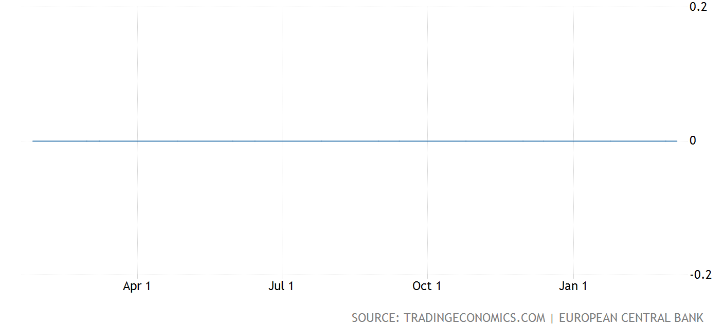
The above is a funny looking chart. It shows a flatlining of interest rates at zero over the last 12 months.
The European Central Bank (ECB) recently pushed back interest rate hikes and also announced new funding for banks at the same time. It looks as though they will be keeping interest rates on hold, at least until the end of 2019 (where have we heard that before?). The ECB is looking at a new series of quarterly targeted longer term refinancing that will be launched, starting in September 2019 and possibly ending March 2021, each with a maturity of two years. Basically, these are cheap loans to banks in the Euro area, in order to maintain banking liquidity and economic stability. The idea is that lenders are able to provide better lending conditions to customers, which in turn allows those customers to borrow money to get busy and stimulate the real economy.
This is now the third injection of stimulus of this type from the European Central Bank. Interestingly, if and when the commercial banks lend this money into the real economy, they receive cash rather than having to pay interest on the loans. This arrangement was first introduced in 2014 and for a second time, in March 2016. This latest decision comes at a time when there are increasing concerns about growth across the Eurozone (not to mention the global economy). As for the Eurozone economy, it continued its slowest pace of growth in four years during the final three months of 2018, according to data released in January. The European Central Bank appears to be concerned about what it calls protectionism (trade tariffs, etc), along with some vulnerable emerging market economies creating negative sentiment across the markets. In other words, the markets are worried that some of these vulnerable emerging market economies, that are dependent on cheap debt out of the US, could stumble unless conditions for them remain ideal. Basically, European economic growth has been slow and fragile, though slow and fragile growth is better than the alternative by far.
Also, giving what appear to be worsening economic conditions across the Eurozone, the SEB has also lowered its inflation forecast for 2019. Inflation was estimated to reach 1.2% this year, which is not a bad level of inflation. The December forecast, however, had pointed to a headline inflation target of 1.6%. Interest rates in Europe remain low (zero, in fact) and the economy remains supported by fiscal stimulus, those low interest rates and low oil prices.
Property – Australia
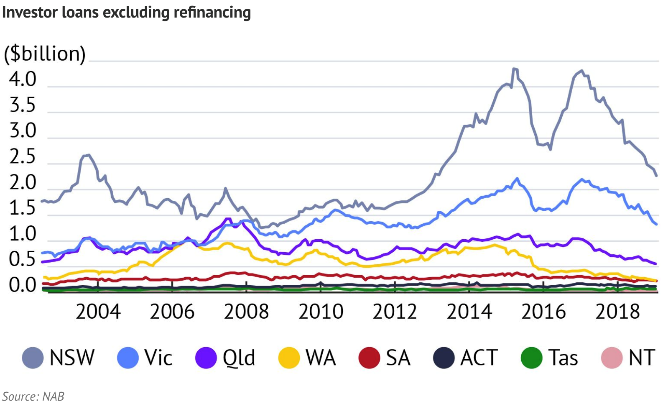
The above chart hints that new investor home loans issued have declined.
As the above chart shows, the value of investor lending in New South Wales and Victoria has basically collapsed, which goes some way to explaining why total lending to investors across Australia has fallen by nearly 50% over the last year three years. The so-called ‘macro prudential restrictions’ which is the government tightening up on how banks are able to lend, on investor and interest only home loans in Australia, is clearly having an impact. Although this may not be replicated in New Zealand, it is none the less a big FYI for Kiwi homeowners and investors. In late 2014, Australia’s banking regulator introduced a 10% annual cap on housing credit growth to investors. That was followed in early 2017 by a 30% limit on interest only lending as a proportion of all new loans (in other words, the regulator placed restrictions on the banks as to how they were to lend). Interestingly, what we now have is negative sentiment building across the market. Although perhaps massively generalising, the average Australian is probably not too different to the average Kiwi. They look at how prices have risen over the last 30 years and see that as normal, overlooking the fact that there is a specific set of conditions that have come together to create that rising house price scenario over such a lengthy period of time. Change some of those conditions and of course, it is unlikely that house prices will continue to rise just because they always have. The reality is though, that when prices are rising, even if you show that average Kiwi or Aussie the evidence, they just do not believe it. They need to see it and experience it before it is true.
New Zealand
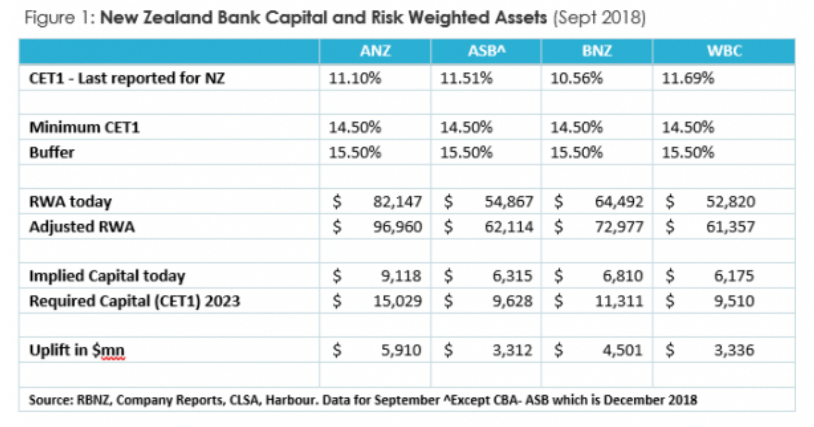
The above chart looks complex. It is just showing current and implied future capital requirements for banks.
The increase in capital requirements looks significant. At the risk of over simplifying things, the proposal by the Reserve Bank of New Zealand (RBNZ) to increase the capital required by New Zealand banks will have some implications for the economy in New Zealand. Although there are a number of organisations offering lending facilities across New Zealand, most of the lending is done by the four main banks, although one of Australia and regulated, you could say, jointly by the Australian Prudential Regulation Authority (APRA) and the RBNZ. In short, Adrian Orr, the New Zealand Reserve Bank Governor, is proposing that New Zealand banks lift their level of capital held to limit risks around bank failure by a significant level. Although we will really need to wait and see if this is implemented and if so, what the impact actually is, it would appear that the impact may well be lower deposit rates (bad news for the hundreds of thousands of Kiwis who rely on interest off the bank to live off in retirement) and less money available to lend to investors and homeowners. This could actually have a significant impact on housing prices. As we have seen in Australia, when the regulator effectively slows down lending, then house prices decline. This would be an interestingly development in New Zealand, that I will update you on again once there is something more material to discuss.