Should We Be Worried!?
Investment Perspective – October 2018

Peter Flannery CFP AFA
“Neither the investing method nor the fundamentals of the business are right or wrong because the mood of the market is favourable or unfavourable toward the “stock”. That is because when you really think about it, “stocks” (shares) are all about the financials and the trading price, the share price…the cash up value. What matters more is the economics of the business”
Peter Flannery
THREE REASONS TO WORRY
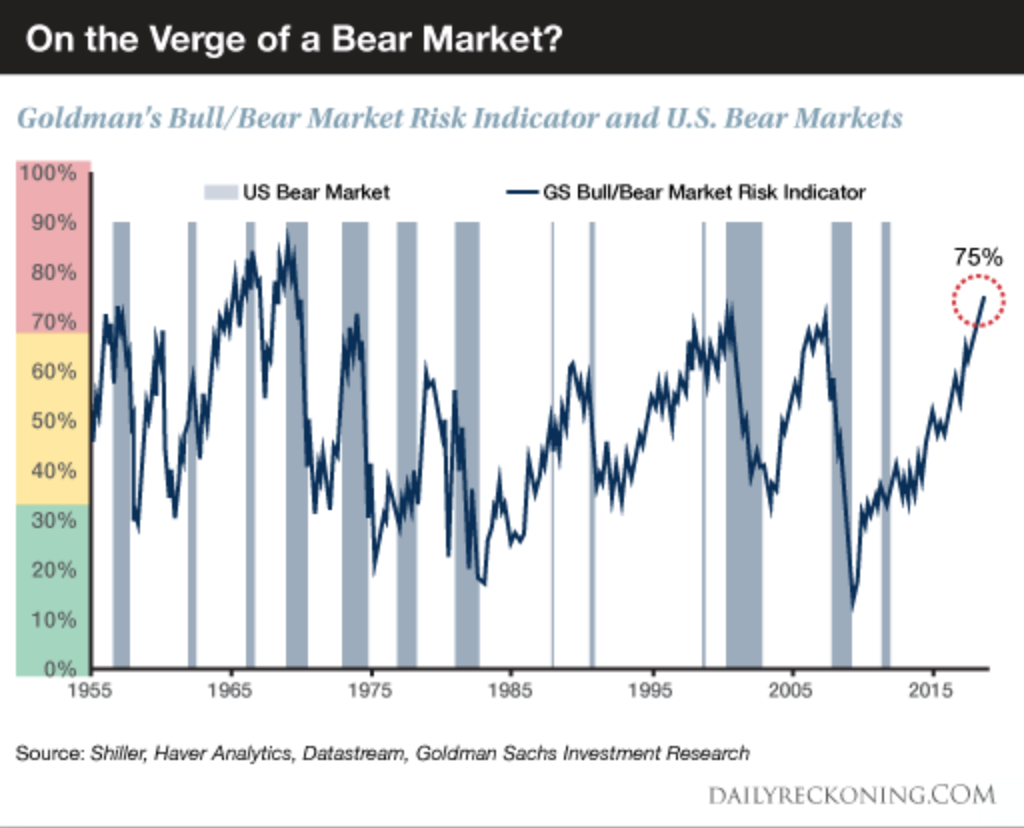
The chart above highlights one indicator signalling a 75% chance of recession (the above chart is suggesting that when markets rise too high, they inevitably correct and a recession follows – the grey bars).
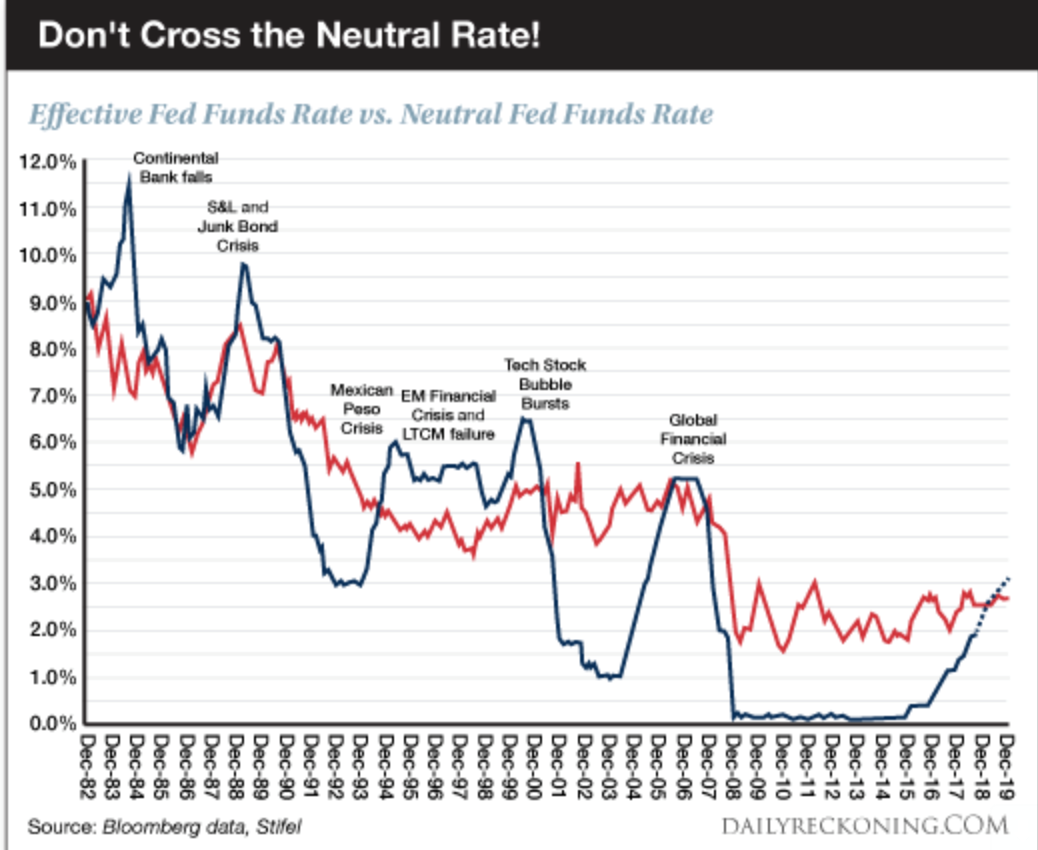
The above chart suggests when those two lines cross, economic trouble is imminent.
There are a number of measures involving long term and short term interest rates that can signal general market direction. The chart above uses the so-called Effective Feds Funds Rate versus the Neutral Fed Funds Rate (not something that Kiwis would look at usually).
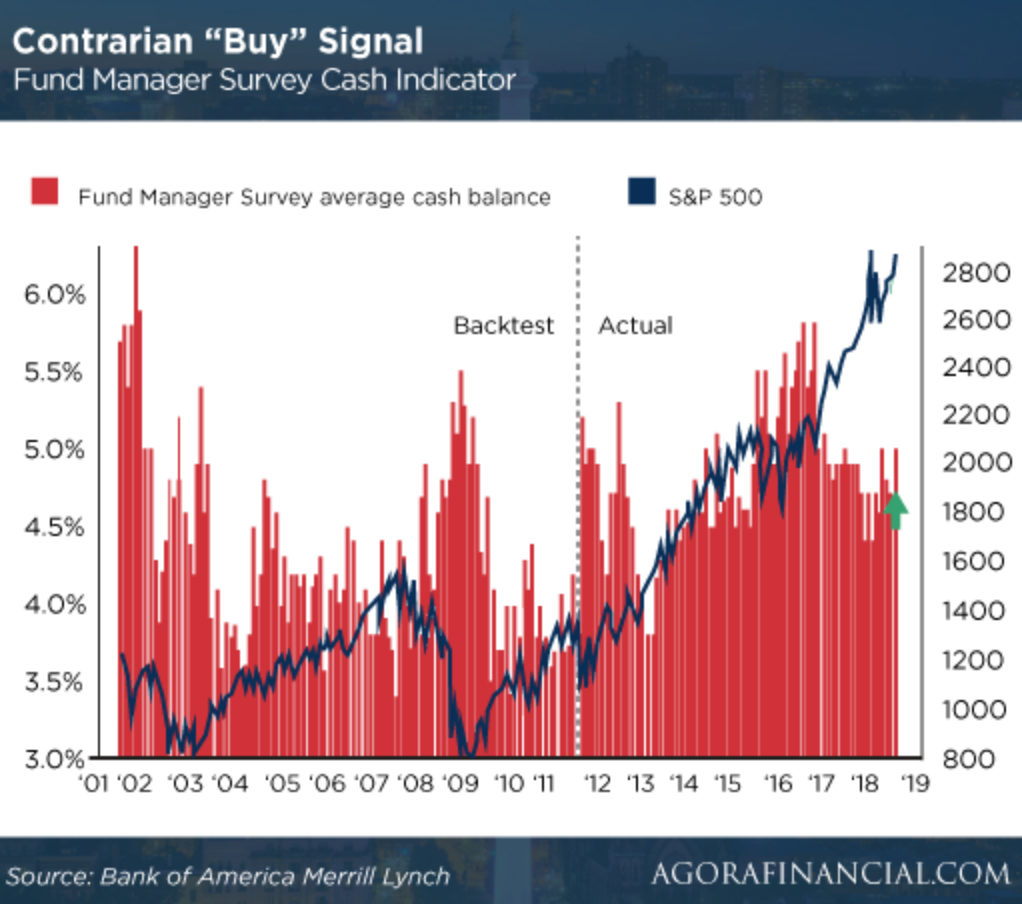
The above chart shows the rising share market (the blue line, right axis) and a spike in cash levels (red bars, left axis) held by US fund managers.
This chart was actually promoting the idea that because fund managers have increased their level of cash (see the green arrow and the red bar spiking to the right) that this could be a contrarian buy signal rather than a sell signal. In other words, because the fund managers across the board are felling bearish and building levels of cash, a contrarian investor can take the opposite view and continue to see a bullish market ahead.
Of course, the other way to interpret chart no. 3 is that because fund managers are building levels of cash, combined with the share market line chart continuing to go up and up and up, relentlessly almost, that they are concerned about a market correction and therefore the idea is that others should also beware of that potential market correction.
That is two interpretations, one chart. Notice also how the blue line stretching outside the red bars may give the impression (wrongly) that prices are in extreme bubble territory.
“There are three kinds of lies: lies, damned lies and statistics.”
Benjamin Disraeli
Another saying you have probably heard is that, pictures are worth a thousand words. The challenge is to know which of those thousand words are relevant!
As I have often said, much of what you will read about and see on the internet and in the popular media always has some degree of validity, however just because it is valid, does not mean that it is right.
THREE REASONS NOT TO WORRY
You may be familiar with the FEAR acronym, which goes something like this:
Fantasised
Experiences
Appearing
Real
Reason No. 1: The trading price and the underlying intrinsic value are not the same thing. The trading price is determined by the market. It will rise and fall depending on whether the market is feeling brave and happy or scared and sad. Intrinsic value is based on the underlying performance of a business and can be measured by return on equity and return on capital – fact.
Reason No. 2: We invest in businesses, we do not play the share market. Rather than putting together a collection of shares or stocks that we hope will rise, rise and rise in the future, we build investment portfolios, business … by … business, investing in the underlying economics (see reason # 1 above) – fact.
Reason No. 3: Lower prices means better value (I know, I know … others don’t see it that way). Lower prices enable us to build in better returns longer term. Lower prices also help us to do so with less risk. Assets are risky when they are expensive, much less risky when they are cheap (prices low). Share market crashes, unhappy markets and significant market uncertainty equals opportunity for us – fact.
Sorry, no pictures to make it look nice – just the facts.
Hey – the cash up value of your investment portfolio will bob up and down, especially in the short term. Longer term though, those “bumps” disappear and the growth line on the graph becomes smooth.
“I have worried about a lot of things in my life – some of them actually happened !”
Oscar Wilde