What’s Up With The Global Economy?
Global Economic Update – Quarterly Update – October 2018

Peter Flannery CFP AFA
“If you have one economist on your team,
it’s likely that you have one more than you’ll need.”
Warren Buffett
It must be October!
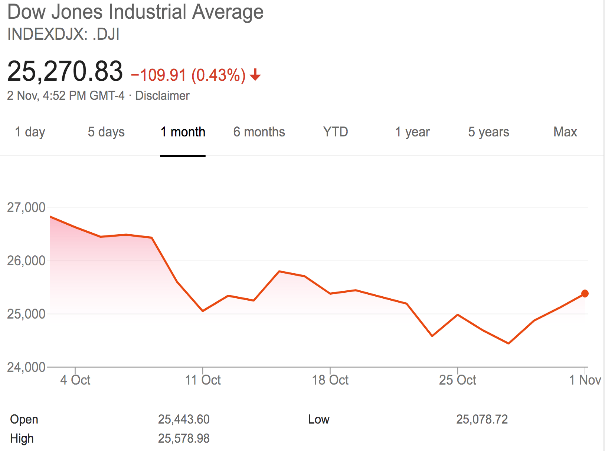
The US share market as measured by the Dow Jones Industrial Average declined from 26,828 to 25,115 as at 31 October 2018.
The market and the economy are separate and different things. In simple terms, the market relates to asset prices, current news and the markets’ reaction to news as it is released and current events. The economy is about a country’s performance in various areas, such as economic growth (GDP), unemployment, interest rates, trading position and so on. Although there is no rule about which one drives the other, economic events and / or the announcement about certain economic specifics can make the markets react and therefore drive asset prices, particularly in the short term. That said, the market’s reaction to economic data can create a severe loss of confidence that in turn can spin off into an impact on specific sectors of a country’s economy or indeed across the whole economy.
Extreme examples of this, of course, are obvious events, such as the 1929 share market correction in the US followed by a significant recession. More recently, the 2008 share market correction and resulting Global Financial Crisis.
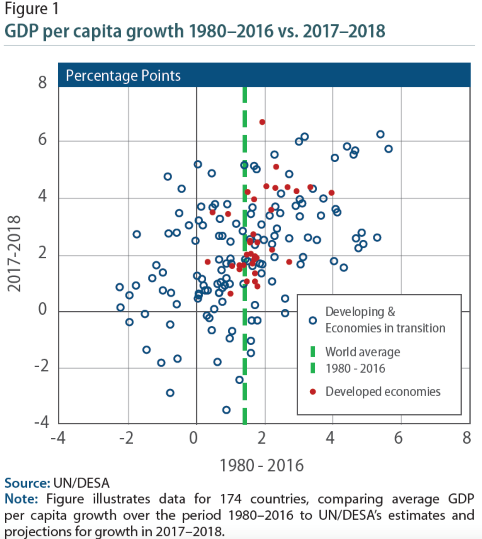
The above chart compares global economic growth per person from 1980 through 2016 versus estimates for 2017 and 2018.
In 2016, economic growth per person (GDP per capita) declined in a significant 49 countries, the highest number since the 107 countries in 2009. Recent favourable economic conditions around the world generally have helped the number of countries with declining GDP per capita to reduce. Those countries mainly responsible for declining GDP per capita are Africa, Western Asia, Latin America and the Caribbean. What does not help some of these countries is their over-reliance on commodities. In some cases, commodities makeup over 80% of total exports. It does not help that commodity prices can be variable and therefore impact in the extreme from time to time. The deep recessions that can sometimes result can involve a painful and slow economic path to recovery.
Some of these countries (approximately 17) are considered the least developed and have significant barriers to economic progress. They sometimes suffer from limited resources to invest in crucial areas such as infrastructure, social programmes and healthcare. The short of it is that those least developed countries will likely continue to struggle for some time to improve their economic performance.
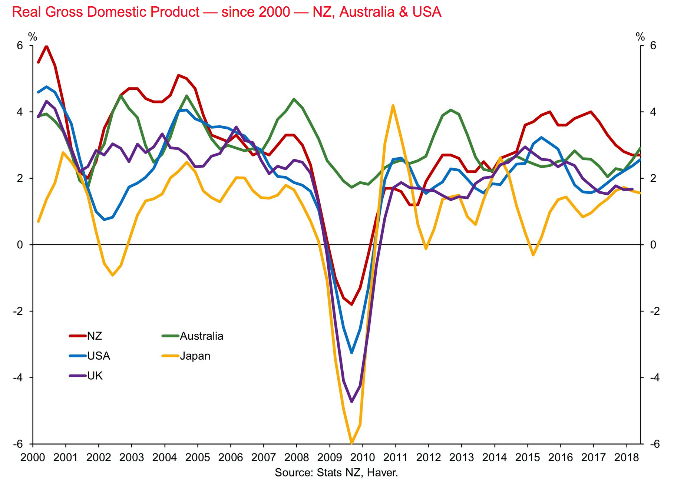
Over the last two years or so, the global economy has experienced a broad-based upturn. For example, over 2017, global economic growth reached 3.1%, which is the fastest pace since 2011. At this stage, underlying growth projections look as though they will exceed 3% over 2018 and 2019, however it will be interesting to see if the ‘trade skirmish’ between China and the US has an impact.
Although global growth is projected at 3.1% over 2018 by some estimates, there are some head winds, which include global trade, rising interest rates out of the US, as well as tightening monetary conditions in some countries around the world, creating fiscal head winds for many emerging economies reliant on debt out of the US. This debt, of course, becomes much more expensive as their currencies decline, making the debt servicing out of those emerging economies a greater burden. Economic activity then channels towards servicing debt is essentially money that cannot go into much needed infrastructure and healthcare programmes for those countries’ citizens.
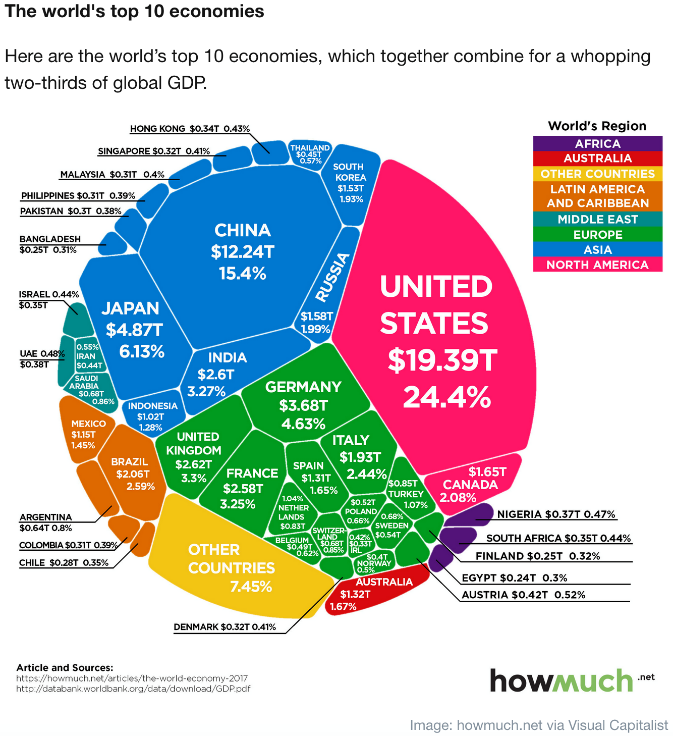
The world’s 10 largest economies make up a significant proportion of the $80 trillion global economy.
The above chart measures the size of each economy by way of annual economic productivity (GDP). The US is a $20 trillion economy, whereas China is a distant second at $12 trillion but at least in theory, catching up on the United States of America. Japan, who used to be the second largest economy in the world, is now the third largest at just short of $5 trillion.
What I believe is more interesting is that when you compare, for example, the productivity of the United States of America with China, there is a significant difference. GDP per capita for America is sitting at around $57,220, whereas GDP per capita for China is only $8,240. That is a significant difference.
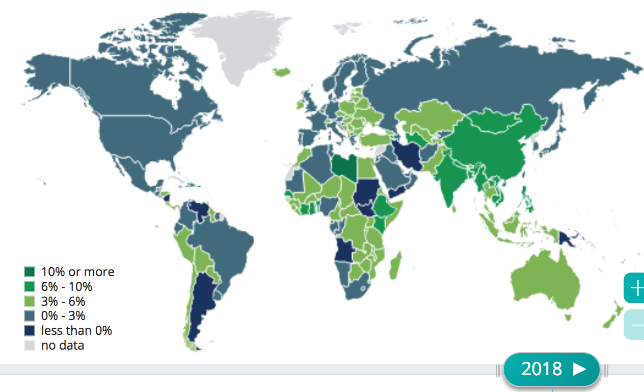
Economic growth around the world.
Notice how the majority of the world is growing at less than 3%. However, there is still a proportion of the world that is growing at 3% or more and overall, the global economy is growing at approximately 3% on average.
I have mentioned Italy over the last few weeks because its debt continues to grow, and their political situation is unusually unstable at the moment. Essentially, to stay in the Euro zone, they need to modify spending, which of course the current populous government is pretending that they will not do. Although this may take time to play out, inevitably Italy will likely knuckle under and introduce austerity measures or else they will leave the Euro (less likely in my opinion). In my view, the Euro zone needs Italy, however Italy needs the Euro zone more. As we have seen with Brexit though, this does not mean that logic or common sense will necessarily be applied to Italy’s membership of the Euro zone.
As touched on previously, some emerging economies and those less developed are worthy of mention because the debt levels of some of those countries is reasonably significant compared to their ability to grow and also compared to their ability to service that debt should their currencies decline under stress. So far so good, however, let’s watch this space.
The United States of America
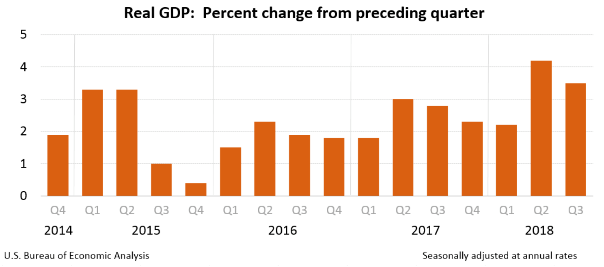
Economic growth in America continues.
The US economy continues to expand with the third quarter number coming in at slightly over 3%, which is a decent result. On the surface, the main contributions were from personal consumption and expenditure, private inventory investment, government spending and non-residential fixed investment. The second quarter number came in at an annualised rate of 4.2%. The deceleration in the third quarter reflects a slow down in exports and a deceleration in non-residential fixed investment. As mentioned in my most recent weekly economic update, when we look below the surface, we can see that debt is a significant driver of economic growth in the US economy. This is less than ideal but simply the reality.
Unemployment
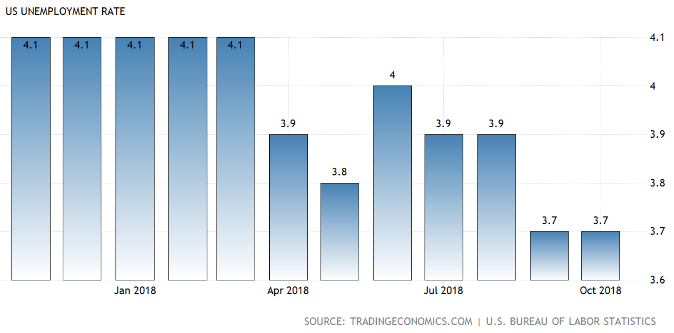
Unemployment in the US, based on government data, is now sitting at 3.7%.
Although shadowstats.com has a different view of how to measure unemployment, based on government data, unemployment in the US is now down to 3.7%, which is unchanged from the previous month’s 49 year low and in line with market expectations. The number of unemployed actually increased by 111,000 to 6.08mln and employment rose by 600,000 to 156.56mln.
This brings us wages growth, which particularly in nominal terms is showing signs of improvement. US workers have seen the largest nominal increase in wages in over 10 years, with businesses across America now starting to compete more for employees compared to a few years ago. Wages rose 2.9% from September 2017 to September 2018, according to the Labour Department’s employment cost index. Bearing in mind though, this does not take inflation into account. Adjusted for inflation, workers’ wages grew 0.6% over the year, still making the increase the largest since 2016. Wages appear to be grinding slightly higher as the labour market continues to tighten. At this point, wages growth appears to be on target to breach 3% in nominal terms again in the near future.
Interest Rates
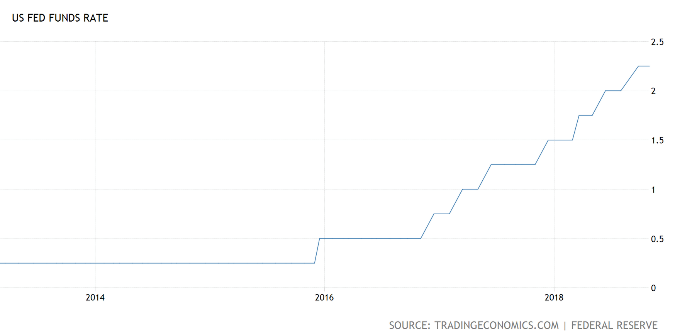
Interest rates in the US continue to rise.
The US Federal Reserve, much to Donald Trump’s annoyance, continues to press forward with interest rate rises. Interestingly, Janet Yellen, the previous Reserve Bank Governor (the current governor is Jerome Powell) recently stated that she would expect Jerome Powell to continue increasing interest rates in order to head off looming inflation. As for Donald Trump, he knows that rising interest rates will hit Americans directly in the pocket by way of increased servicing costs on any debt. Remember, Americans are used to mortgage rates well below 5%. Indeed, 3.5% is common. This means that many Americans have a significant amount of debt because of those low interest rates and any increase in interest rates is likely to see Donald Trump get the blame. Of course, another reason for the Americans to be interested in rising interest rates is their significant and growing amount of government debt that is going to require more and more economic productivity and growth to service. This is not the end of the world for America because they can reduce healthcare spending, for example, if need be. Of course, that is an unpopular decision but one that is available. They can, of course, continue borrowing money and kicking the can down the road as it were too.
Inflation
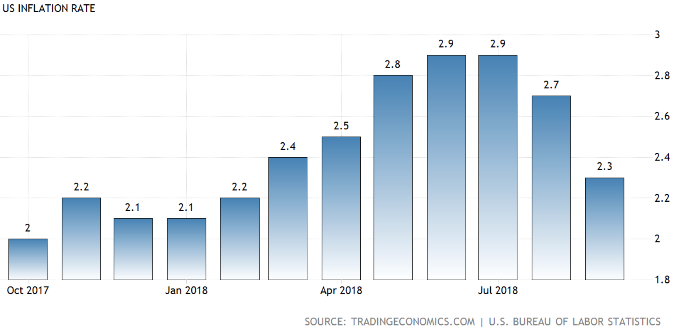
Inflation appears to be taking a breather.
Annual inflation in the US fell to 2.3% in September 2018 from 2.7% in August and below market expectations of 2.4%. This is the lowest inflation rate since February, due mostly to the slowdown in fuel and housing costs. Excluding food and energy, core inflation was steady at 2.2%, the same as in August but below forecasts of 2.3%.
Tax
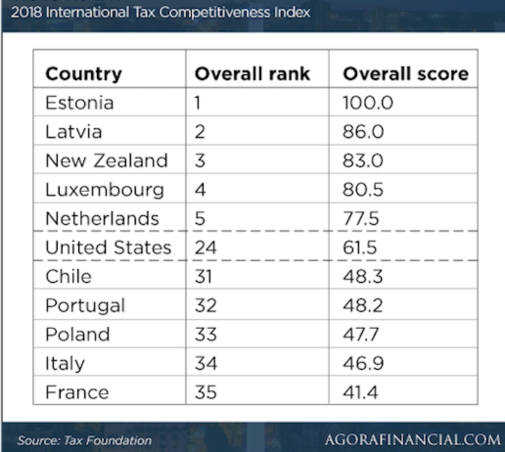
The United States of American ranks no. 24.
The recent tax cuts for businesses and mums and dads across American, initiated by President Donald Trump leaves the United States of America polling at position no. 24 in terms of their tax competitiveness. There is a couple of ways to look at this. If their economy is fully laden with debt, then this would suggest further tax cuts are actually only going to increase government debt in the medium to long run – not useful. On the other hand, there is still plenty of ‘gas in the tank’ so to speak whereby those recent tax cuts still leave room for further tax cuts in the future. Polling at position no. 24, the United States of America has room to move in terms of further tax cuts = stimulate the economy. By the way, note New Zealand polling at no. 3 – good on us, eh! Do you still think you are paying too much tax?
Mid-term Elections
At the time of preparing this quarterly economic update, we are less than one week away from mid-term elections. Some polls are showing that the democrats have a good chance of taking the house, however the senate looks likely to remain in republican control and in the final run up to the elections, Donald Trump is hitting the campaign trail hard – something he is actually quite good at.
Regardless, the American economy, whilst stimulated by debt, continues to grow and is also in the process of unwinding the $4.5 trillion balance sheet blow out that came out of the 2008 global financial crisis. Remember though, whilst that $4.5 trillion will not be sorted without some pain, when compared to annual GDP of $20 trillion, it is an amount that will be dealt with at some point, providing the US economy can remain on a growth path. Of course, the government will also need to balance the books and at some stage, slowdown or stop the increase in debt overall that is causing an increasing drain on economic growth each year. Whilst not without its difficulties, the US economy is okay and, in my view, not facing economic Armageddon anytime soon.
China
Economic Growth (GDP)
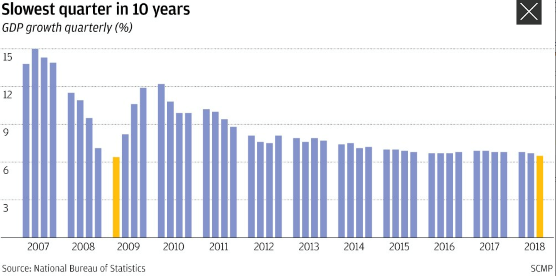
Economic growth in China continues to ease.
Economic growth across China increased more slowly than expected at 6.5% in the third quarter of this year. This is down slightly from the 6.7% in the second quarter, according to recent data released by the Statistics Bureau in Beijing. By some measures, this is looking like the slowest quarterly growth since the global financial crisis around 10 years ago (see chart above). Further evidence of the slowdown can be seen with industrial production slowing down to 5.8% from 6.1% in August, the slowest growth rate since October 2015. Also, fixed asset investment remains reasonably weak with the January to September growth rate rising only to 5.4% from the 5.3% rate posted in the first eight months of the year. Property investment growth slowed to 9.95 from 10.1% while infrastructure investment growth slowed to 3.3% from 4.2% even though the government has initiated a new campaign to promote this type of spending and to support economic growth. Perhaps it is worth mentioning that whilst these numbers may not be moving necessarily in the right direction, they nonetheless represent ongoing growth. To be clear, growth whilst slowing somewhat remains ongoing in the Chinese economy.
Let’s keep it real
There has been a significant amount of information about China’s slowing economy, increasing debt and imminent crash that might engulf the whole world. Anything is possible, however where is the real evidence to support that line of thinking?
China’s economy is slowing down, which is partly the reality of significant growth that cannot continue forever and also a controlled economic slowdown, managed fiercely by the Chinese Government. China’s real GDP peaked in 2007 at 14.2% and has been on a downward trend since then. The interpretation of this trend is that the growth will slow so much that at some point, there will not be any and because of the size of China’s economy, the rest of the world is suddenly in trouble. The recent decline of the Chinese share market has seen 20% of market capitalisation erased (the market has dropped by 20%) since the beginning of 2018. The idea is that this signals a slowing economy, which is the result of the so-called trade war between China and the US. The idea is that therefore China is heading for trouble. Unlike the US, China’s stock market is much less strongly linked to the underlying economy. By some estimates, around 80% of the trading volume of the Shanghai stock exchange is accounted for by small retail or individual traders in contrast to a significant 90% of volume by institutional investors in the US. Simply, Shanghai’s index is therefore much more volatile. For example, the Dow Jones took 18 months to recover from the 1987 share market decline, whereas New Zealand (at the time also with a high level of non-institutional investors) took well over 10 years. Also, Chinese listed businesses still rely heavily on bank lending, whereas listed businesses in the US and Western Europe rely more so on issuing new shares. Around 60% of China’s businesses are financed by bank loans versus 20% in the US (according to estimates by McKinsey Global Institute).
Another “myth”, if you will, is that China’s slowing economy is a result of the trade war between the US and China and is also the cause of China’s weakening currency. Again, this is interpreted as difficult times ahead. The Yuan’s 8% depreciation from April to August this year is an example of what is often cited as proof that the Chinese economy is weakening and in trouble. Of course, a closer look reveals that 11 April was the actual peak of the Yuan’s exchange rate value against the US Dollar. Obviously, if you pick the peak of any number, you have a sure fire way to magnify the narrative and justify your point of view. Staying with 11 April and running with the date of 1 August, the Euro also declined 6.6% against the dollar, the Indian Rupee by 7.5%, the Japanese Yen by 6.3% and therefore, we can argue that an 8% decline by the Yuan is not significantly out of line with other currencies.
This brings us to the almost worn out story around China’s debt – I know you read about it every day almost in the popular media. China’s debt indeed has increased since the global financial crisis and has helped to support economic growth. Total debt as a percentage of GDP is a common ratio that I have used and I know others use as well in order to understand where debt levels lie. Anyway, the idea with China is that the government in China has no choice but to deleverage in order to stay solvent but in doing so may cause the economy to crash. Another important point to throw into the mix is the fact that a significant amount of China’s debt is domestic. Most of it is owed by state owned enterprises to state owned banks. In simple terms, the debts are owed by one government department to another. Then, we consider China’s significant foreign reserves. This makes debt crisis comparisons with the likes of Greece almost silly. For example, in 1990, China dealt with what some would argue was a more dangerous debt situation by removing some banks’ non-performing loans and recapitalising those banks. They could do the same again today and are much stronger now than they were in the 1990s, to be able to do so.
Staying with China’s debt, whilst the level of debt is reasonably high, it is not at a desperate level, particularly when we take into account those points outlined above. The key for China will be to ensure that the debt composition is aimed at productivity, which helps to maintain the status quo and support growth. There is some evidence that the Chinese Government is heading down the right path by curbing lending to state owned enterprises, particularly those that may be suffering from over capacity, whilst at the same time, maintaining a supply of credit to more productive borrowers, especially for example those private businesses in the service sector. By some measures they now account for more than half of economic growth in the Chinese economy (as measured by GDP). Anyway, the bottom line here is that a financial crisis out of China because of China’s “debt mountain” could be considered fanciful nonsense.
The Euro Zone
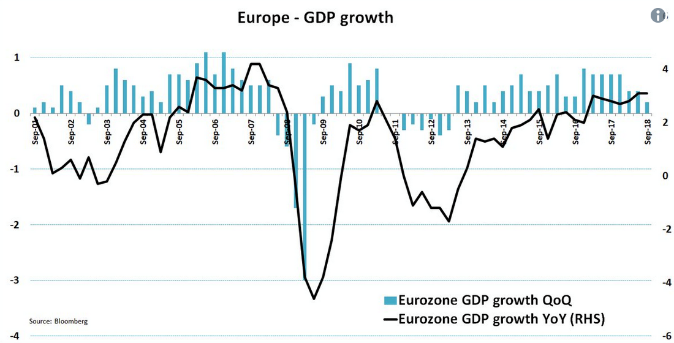
Economic growth is slowing down.
Economic growth in the Euro zone recently slumped to its slowest rate since the second quarter of 2014. The good news though is that economic growth is still underway, although as we all know, supported by low oil prices, low interest rates and fiscal stimulus.
We should always be careful of short-term data, however many put the economic slowdown at the door of Donald Trump’s trade tariffs, although I suspect it is a bit early to tell just yet.
Trade
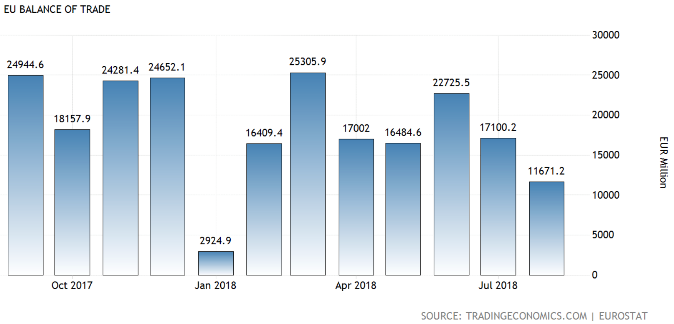
Europe’s trade surplus declines.
The trade surplus in the Euro area decreased to EUR11.7 billion in August 2018 from EUR15.24 billion a year earlier and compared with the market consensus of EUR15.3 billion. This represents the smallest trade surplus since January as imports increased 8.4% year on year to EUR169.8 billion and exports rose at a softer pace of 5.6% to EUR181.5 billion. Trade within the Euro area increased to EUR140.7 billion, up 5.1% compared with August last year.
Interest rates
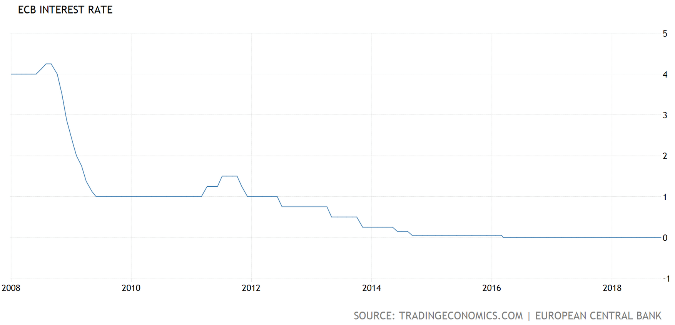
Interest rates remain flatlined at 0.00%.
Interest rates remained at zero and look as though they may stay in this position for some time to come, particularly if the recent slowdown in economic growth becomes a solid trend. Time will tell.
Inflation
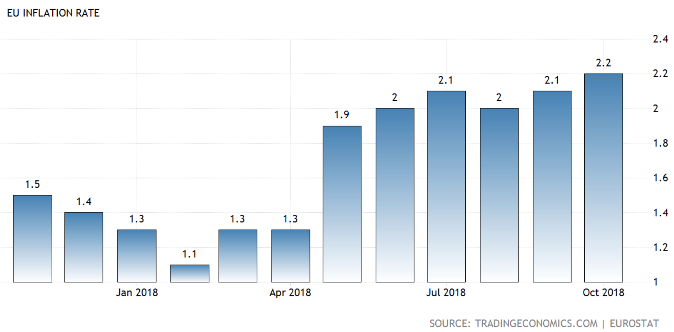
Inflation remains reasonably solid.
Inflation in the Euro area is expected to pick up to 2.2% in October 2018 from 2.1% in the previous month and in line with market consensus. That would be the highest inflation rate since December 2012 on the back of higher prices for services, industrial goods, processed food and energy.
Unemployment
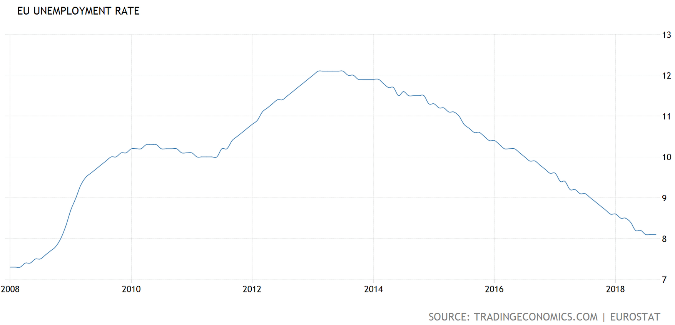
Unemployment has improved over the last few years.
As the chart above shows, unemployment in the Euro area has been tracking down nicely, although more recently the decline in unemployment has slowed down. The unemployment rate in the Euro area was unchanged at 8.1% in September 2018, the same as in the previous month’s figure, below 8.9% a year earlier and in line with market expectations.
Wages growth
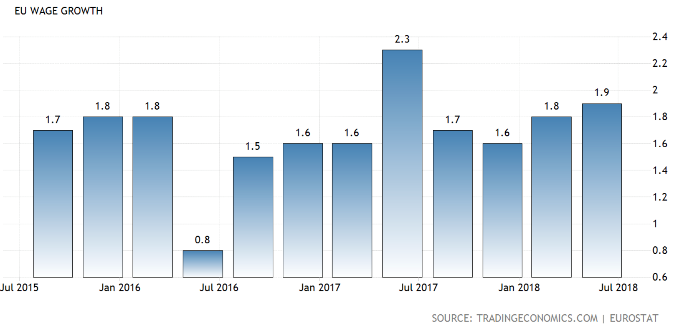
Wages growth remains sluggish.
Wages growth is considered a key indicator that can drive inflation in an upward direction but has been noticeably absent from most economies around the world. The Euro zone is no different with wages growth remaining slow.
Italy remains a problem
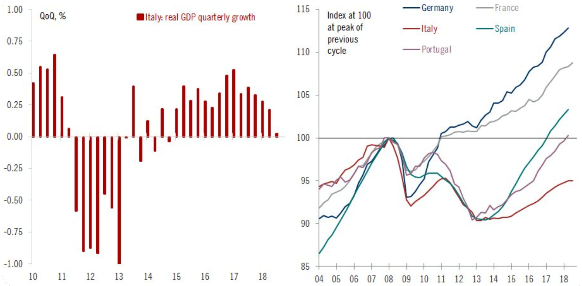
The left hand chart shows Italy’s declining economic growth. Much less growth for Italy and they are close to deflationary mode = NOT good. The right hand chart compares economic growth among the five countries listed on this chart. Italy, as you can see is the laggard.
By some measures, the European economy is progressing satisfactorily, although it remains fragile. Given the Brexit tensions currently underway and other trade tariff issues brewing abroad, there are some concerns that the European economy could strike trouble over the next year or two. Some studies show that the risk of a global recession over the next two years has increased from a 20% chance to a 30% chance. Obviously, if that were to unfold, it would engulf the European economy. The Euro zone has moved from showing promise during 2017 to looking somewhat fragile now. Still, the low value of the Euro and monetary stimulus has helped to support export growth and financial stability up until now. The loss of momentum could be put down to Donald Trump’s trade measures, the ongoing lack of clarity over Brexit and Italy’s problems spilling out over into Europe but with the real damage from Italy possibly yet to unfold. These factors have contributed to a loss of momentum for the Euro zone economy. Still, overall conditions remain somewhat favourable and the economy remains stable but fragile.
United Kingdom
The UK economy is a mixed bag
Economic growth in the UK expanded 1.2% year on year in the second quarter of 2018, revised from a preliminary estimate of 1.3% and then a change from a near six year low of 1.1% in the previous period. In short, Britain’s economy is limping along at a sluggish pace.
UK House Prices
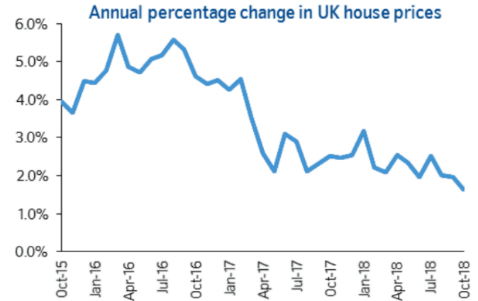
House price rises across Britain continue to slow.
Houses in Britain are rising at the slowest annual pace in more than five years, according to recent data from Britain’s largest building society. The average property value rose 1.6% in October from 12 months ago, down from September’s 2% and the lowest growth rate since May 2013. This is interesting because even though borrowing costs are low and unemployment is at a 40 year low, the squeeze on household budgets and the uncertain economic outlook, appears to be dampening demand. The average price of a home was flat between September and October at £214,534.
Interest rates
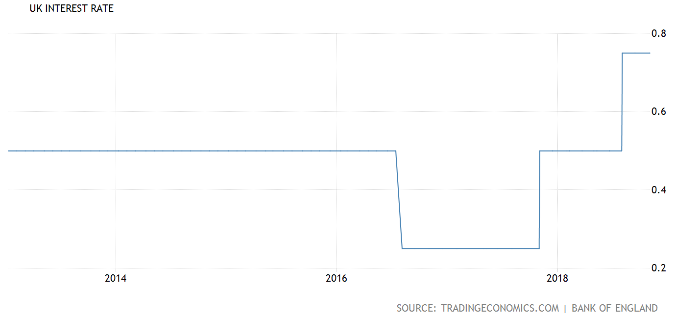
Interest rates have stepped up slightly over 2018.
Although interest rates have increased slightly over 2018, the Bank of England voted unanimously to leave the bank rate steady at 0.75% on 1 November 2018. This was in line with market expectations. Policy makers are adopting a positive view and saying that if the economy continues to develop in line with forecasts, further interest rate increases might be appropriate. Interestingly, the central bank lowered growth forecast for both 2018 (1.3% from 1.4%) and 2019 (1.7% compared to 1.8). Inflation is seen higher at 2.5% (2.3% in the August forecast) in the end of 2018 but lower at 2.1% (2.2%) in the fourth quarter of 2019. Whilst the UK economy continues to grow, growth has softened and become more uneven as downside risks have increased. Financial conditions have tightened somewhat, particularly in emerging market economies and activity has slowed in the Euro area, which impacts on growth in the UK economy. Trade restrictions are also worth mentioning as they have increased and will create further head winds to economic growth in Britain if those trade tariffs escalate further.
The impact of Brexit so far has been a dampening on growth in the UK economy, with the real impact yet to be felt further into the future. The uncertainty is the current problem for the UK economy. Lack of clarity makes large corporates and even smaller business owners nervous. It will be interesting to see what new trade arrangements can be implemented by Britain, as it seeks to smooth the transition out of the Euro zone.
Unemployment
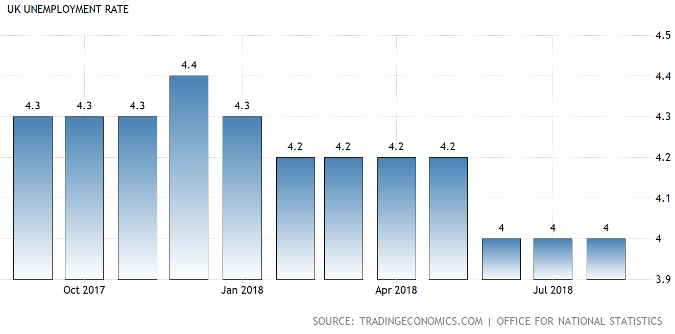
Unemployment remains low.
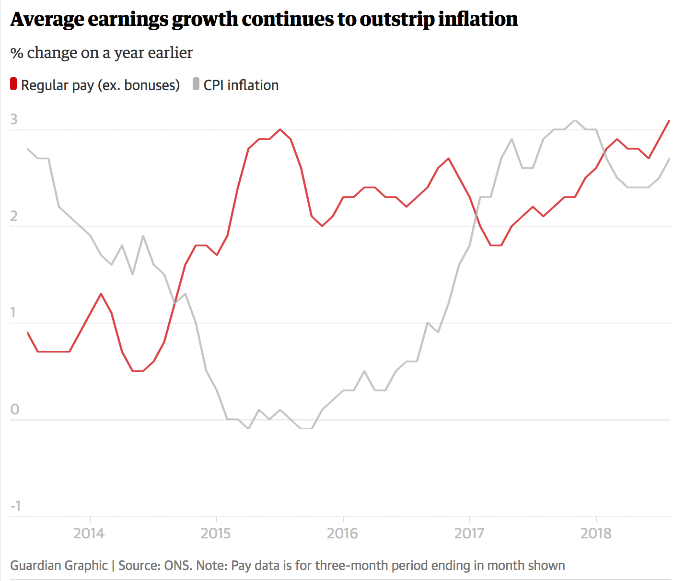
Wages growth increases slightly.
With unemployment remaining below 5%, the expectation is that wages growth should emerge at some point. Indeed, the chart immediately above does show an uptick in wages growth, although it is not significant. Indeed, UK pay growth has increased 3.1%, the highest in nearly 10 years, which could be the result of low unemployment and competition for workers helping to push wages up. Wages growth is sometimes an indicator that can signal increasing inflation and thus rising interest rates, which can be a signal that share market investors use to consider taking profits.
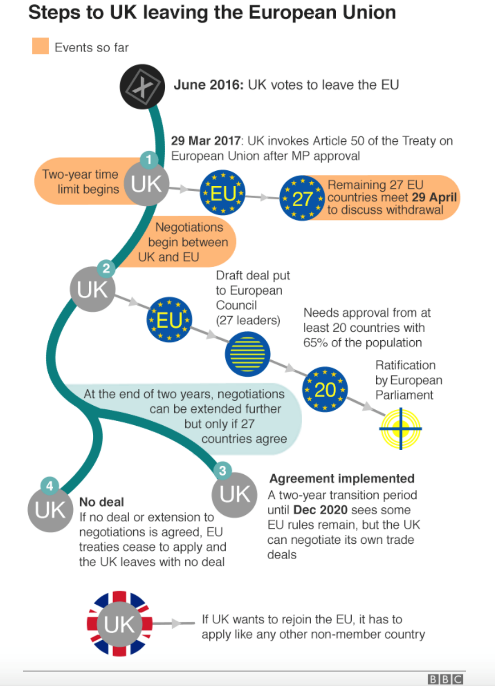
Is Brexit definitely going to happen?
The UK, in order to leave the European Union, invoked article 50 of the Lisbon Treaty, which gives the two sides two years to agree to the terms of the split. Teresa May initiated this process on 29 March 2017. This means the UK is scheduled to depart the European Union at 11 pm UK time on Friday, 29 March 2019. However, this date can be extended if all European Union members agree. Right now though, it appears that both sides are focusing on that leaving date. Also, Teresa May has put that date into British law.
The UK Government and the main UK opposition party both say Brexit will happen. There are groups campaigning for Brexit to be halted, however the focus among the UK’s elected politicians has been on relationships for the UK post-Brexit (rather than whether or not Brexit will happen at all).
Australia
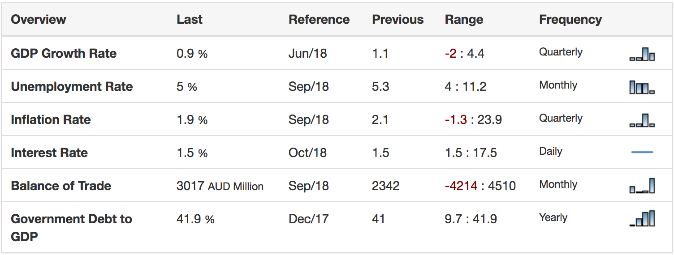
The Australian economy remains stable.
The Australian economy remains in reasonable shape as evidenced by the strong increase in economic growth for the June quarter of 2018. Of course, we will look forward to the results of the September quarter, which will include the recent weakness in property prices around Australia.
Economic growth
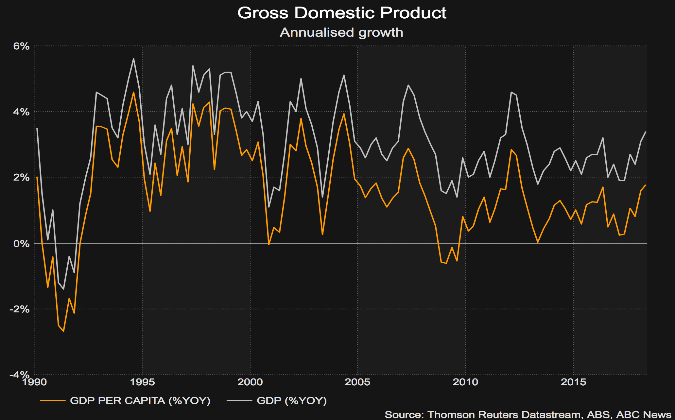
Economic growth in Australia has enjoyed an uptick.
Increasing by 3.4% to the end of June 2018, driven by consumer spending and financed to some extent by reduced household savings. This is a step up from 3.1% growth in the March quarter and above the 3% that the reserve bank had forecast. It is also the fastest rate of annual growth since September 2012, which was at the height of the post-GFC mining boom in Australia. However, if we look more closely into the numbers, we can see that the increase in consumer spending has been financed by households eating into their savings – not ideal. The ratio of savings to income was more than 10% in 2008 and is now about 1%! This is the lowest level of household savings in about 10 years.
Australia’s big $3 billion trade surplus
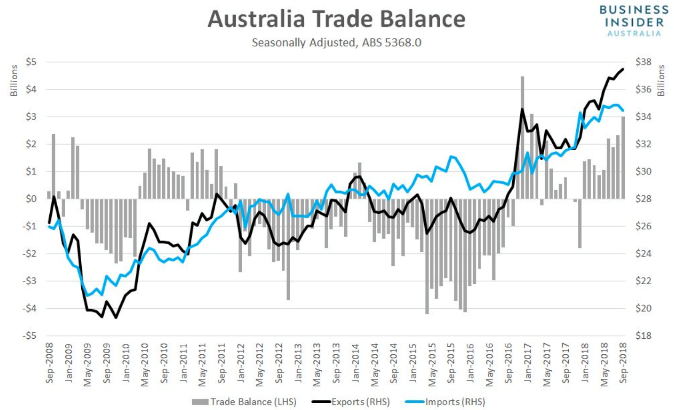
Big trade surplus for Australia.
In September this year, Australia clocked in with a trade surplus of a significant $3.17 billion in seasonally adjusted terms. This is the largest surplus since February 2017 and possibly the third largest on record – that is a significant result. According to the Australian bureau of statistics, exports rose by 1% in seasonally adjusted terms to $37.496 billion, the highest level ever recorded. Non-rural exports (the largest component in dollar value) jumped by $678mln from a month earlier. Exports of metal ores and minerals surged by $551mln from the month earlier, reflecting the recent uplift in prices.
Interest Rates
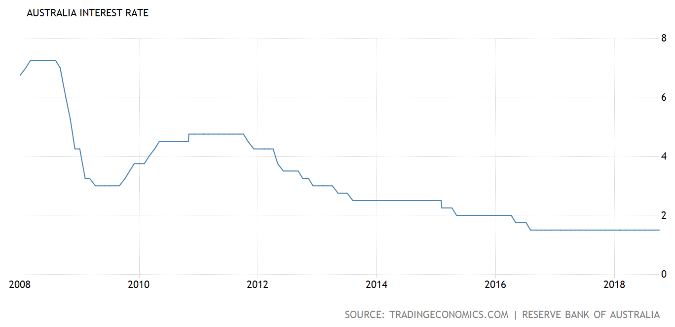
Interest rates remain on hold.
The Reserve Bank of Australia kept the cash rate at a record low of 1.5% in its October meeting, as widely expected. This now extends the flatline policy for interest rates beyond two years, which of course is due to sluggish inflation and limited wages growth, along with global risks around trade policy out of the US. Much like other central banks around the world, I imagine they are waiting for the “Phillips Curve” to kick in. Simply, this means that with low unemployment firmly entrenched that demand for workers should start to push wages higher, leading to wages growth. That in turn can lead to an increase in inflation and therefore the need to raise interest rates. So far though, like in many other countries around the world, wages growth in Australia has yet to fire, so to speak.
Inflation
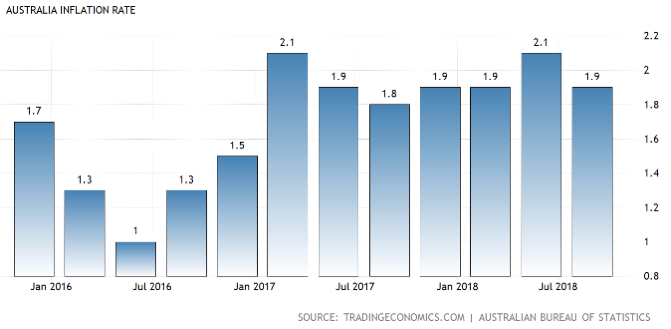
Inflation remains sluggish.
Australia’s consumer price inflation eased to 1.9% year on year in the third quarter of 2018 from 2.1% in the previous period. These numbers were in line with market expectations and due mainly to the noticeable slowdown in the cost of housing. Over the last 12 months, the cost of housing increased by 1.6% in the September quarter, slower than the 3.1% rise in the prior quarter. This appears to be driven by new dwelling purchases by owner/occupiers.
Unemployment
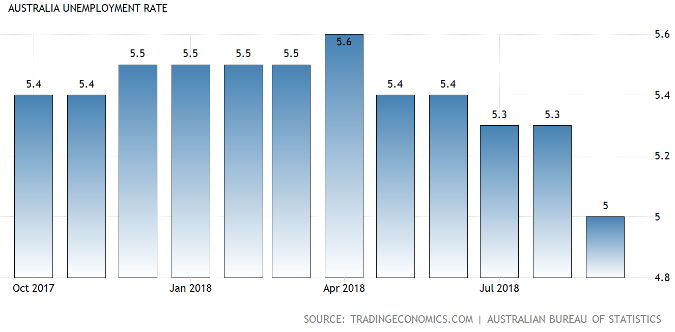
Unemployment has declined.
Australia’s seasonally adjusted unemployment rate recently dropped to 5% in September from 5.3% in the previous months, while the market was estimating a rate at 5.3%. This represents the lowest unemployment rate since April 2012.
Wages Growth
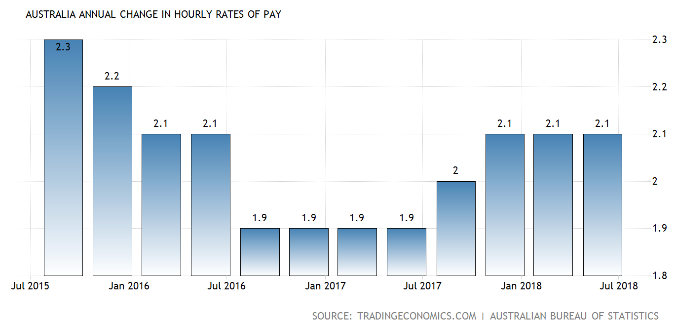
Wages growth continues to struggle.
As mentioned earlier, the Phillips curve is all about low unemployment leading to wages growth and then onto inflation, which in turn leads to rising interest rates. At least that is the theory. The theory in many countries around the world does not appear to be working just yet. Wages growth, as you can see from the chart above, has remained stubbornly flat since the beginning of 2018. We look forward to the next quarterly update numbers being released soon.
Property
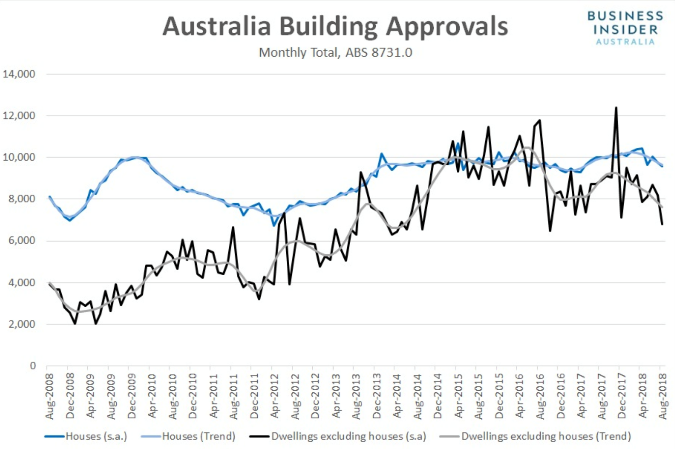
Building approvals decline.
Recent numbers show that approvals for houses slipped 1.2% to 9,765, whilst those for other residential dwellings slumped 15.1% to 7,612. Clearly, the outlook for residential construction is stumbling. Construction has been a tail wind for economic growth in Australia in recent years, however in the future, this may change. Interestingly, immigration into Australia remains reasonably strong and at least historically, vacancy rates have been quite low, as have interest rates. It appears though that perhaps tightening credit conditions that appear to be causing house prices to decline may in turn see residential construction decline over the next few years possibly. This means that residential construction could be a drag on the Australia economy moving forward.
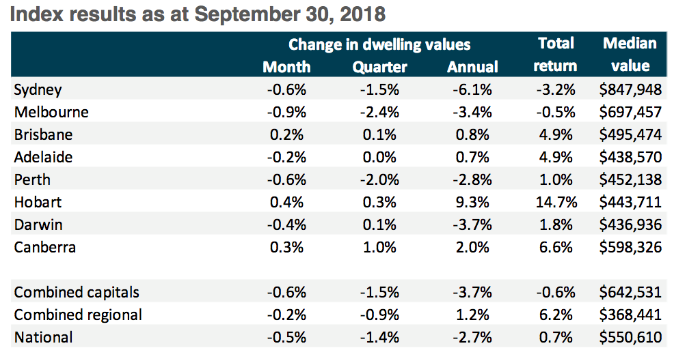
Property prices remain a mixed bag across Australia.
Even though interest rates are low, the banks in Australia have been tightening conditions, making it more difficult for home owners and investors, slowing down property price rises and indeed causing prices to decline in some areas (see both charts above). In my view, this is unlikely to result in a massive property price correction across Australia, however it is not over yet. Markets determine prices and it is always difficult to predict a market that doesn’t even know its own mind, however I would expect further declines for a while yet and then prices should stabilise.
In general terms then, the Australian economy continues to move forward in a solid way, although it will be interesting to see what impact the slowing housing sector might have on economic growth next year. Steady as we go for the Australian economy.
New Zealand
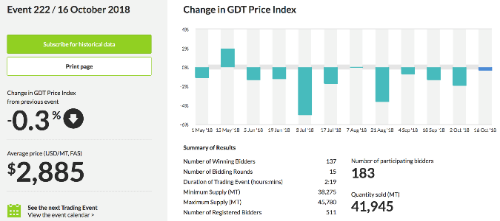
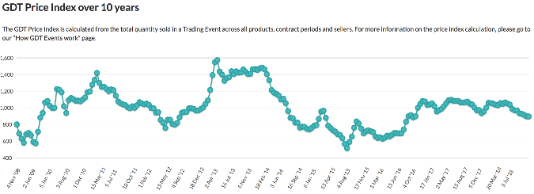
Dairy prices slipping somewhat recently.
Dairy prices fell 3.0% month over month and are now down 11.5% from their May peak (actually down 11.1% year over year).
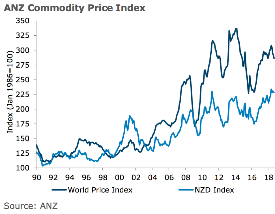
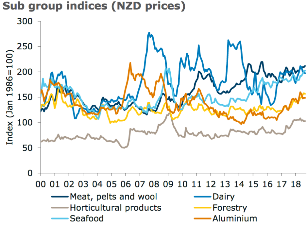
The left side chart tracks the world price index (the black line) and the New Zealand Dollar equivalent (the blue line). The right hand chart breaks down the commodity index into its component parts.
In addition to the decline in dairy prices, as outlined above, the meat and fibre index also fell 0.4% month over month and finished up the year ended September at a decline of 1.6%. Also, forestry prices fell 1.8% month over month driven by a 2.8% fall in log prices. Anyway, the annual growth in the index slowed from 12.3% in August to 9.7% in September. The commodity index overall remains fragile, partly because of ongoing trade issues around the world, particularly between the US and China. Although it remains to be seen, by some estimates, dairy prices are at a point where they are starting to look attractive for some buyers, which may help to put a floor on further price declines across dairy prices.
The Truckometer
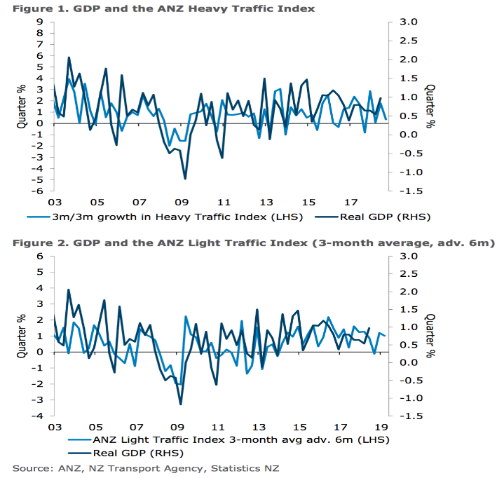
The truckometer measures activity within the economy. The top chart measures heavy traffic and the bottom chart measures light traffic. Light traffic can sometimes represent a forward looking indicator.
When reviewing both the heavy traffic index and the light traffic index, these charts suggest a slowing of economic growth and the chances of a 1% quarterly growth number over the next three months is doubtful. The ANZ truckometer measures the volume of traffic around the country. Traffic flows are considered a real time and real world proxy for economic activity. This is particularly relevant in New Zealand where a significant proportion of freight is transported by road.
New Zealand’s economy has grown steadily.
New Zealand’s economy is supported by robust global economic growth, which has been synchronised around the world for the last couple of years or so. The trade skirmish between the US and China has unnerved the markets, although there has not been significant evidence of a marked slowdown in economic growth because of it.
Interest Rates
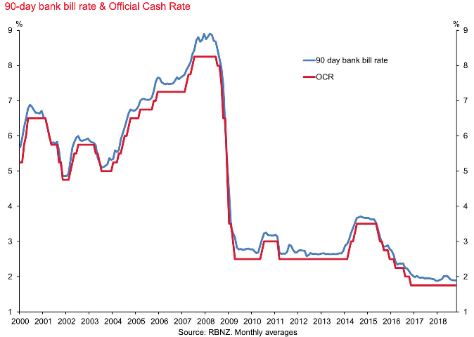
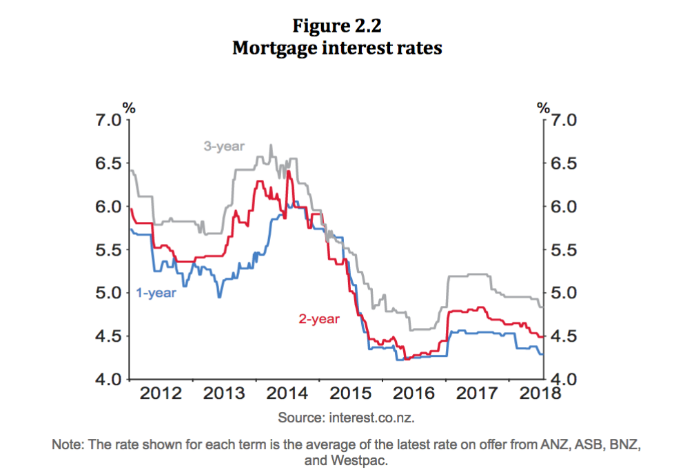
Interest rates currently remain on hold.
The Official Cash Rate (ORC) remains at 1.75%. The Governor of the Reserve Bank, Adrian Orr, has suggested they are looking to possibly keep the OCR at this level throughout 2019 and into 2020.
Inflation
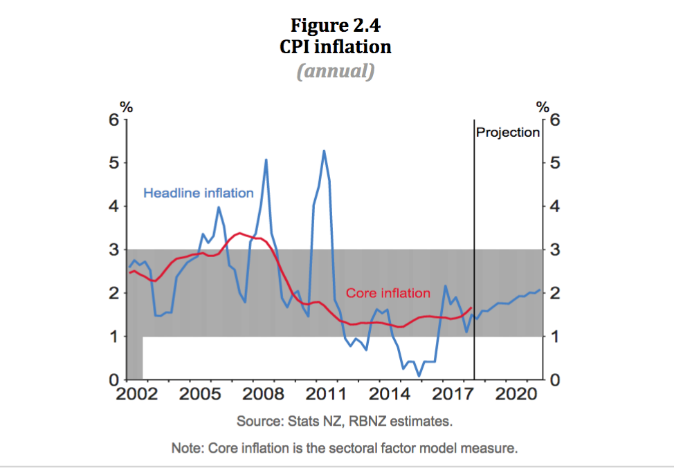
Inflation expectations are tracking in an upward direction.
Inflation is currently inside the 1% to 3% target range. The annual CPI came in at 1.5% in June 2018, measuring the underlying trend in inflation at a similar level (see the chart above). With low unemployment, the Reserve Bank Governor will be watching wages growth as an indicator of increasing inflation along with other indicators.
Residential Property
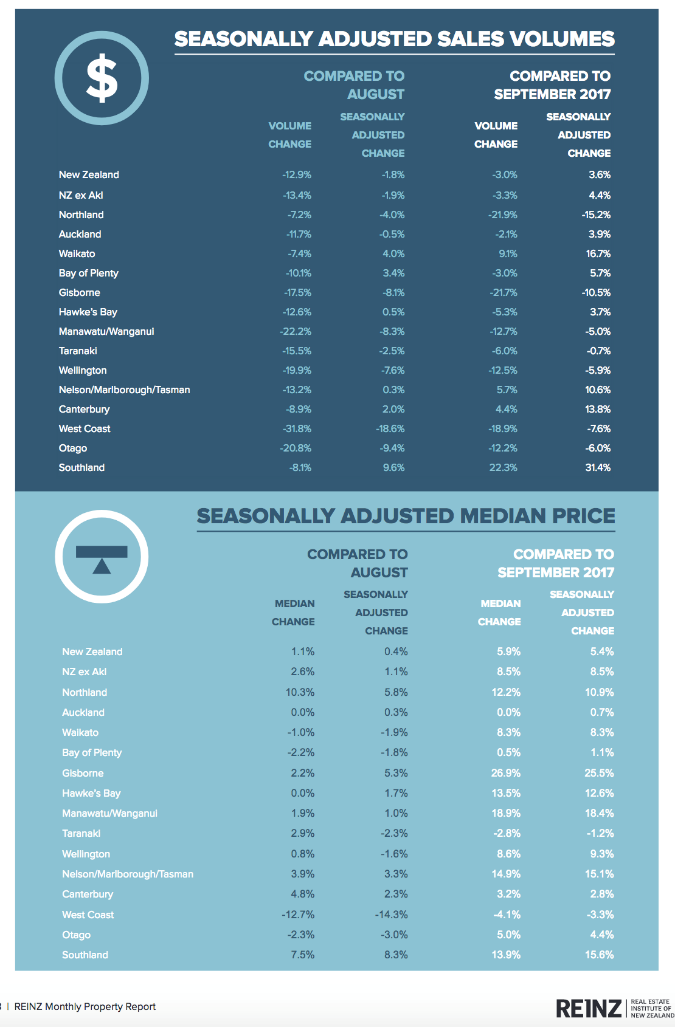
The above chart shows seasonally adjusted sales volumes and median house prices across New Zealand.
House price rises have slowed in most areas and declines in the value of housing in some areas is starting to show up. Also, sales volumes are slowing down, which can sometimes be an indicator of yet further slowing prices ahead.
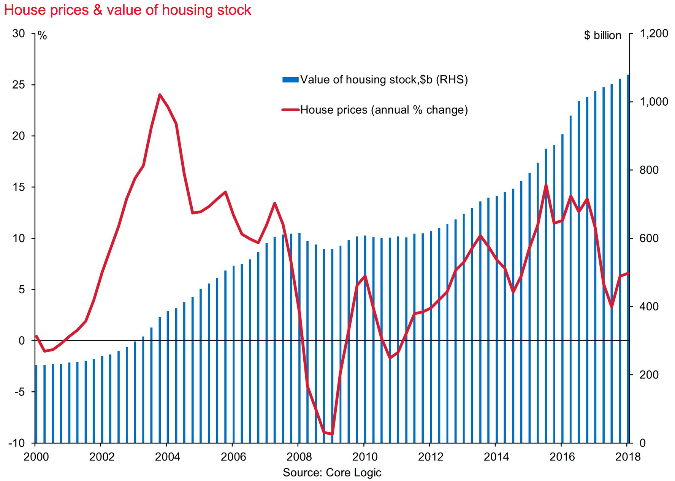
Use the left side axis to track the red line and the right side axis to track the blue thin vertical bars on the chart.
The House Price Index (HPI) measures the movement in house prices throughout New Zealand, providing an indicator of capital growth. The chart above shows the real volatility of house prices over time. Although immigration remains strong and interest rates low, banks have tightened credit conditions over the last year or two, creating a head wind for property investors and also home owners looking to upgrade. Further, for investors, the government banter around increased compliance costs for landlords around New Zealand is possibly having an impact on those less serious about property investing. For them, it is all just too much hassle, however the much talked about housing warrant of fitness, which I believe is a great idea, still has not found traction here in New Zealand as yet. No property price crash is in sight for New Zealand residential property at the moment.
Currency
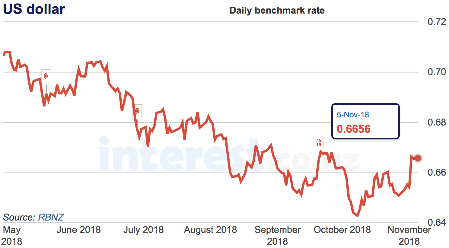
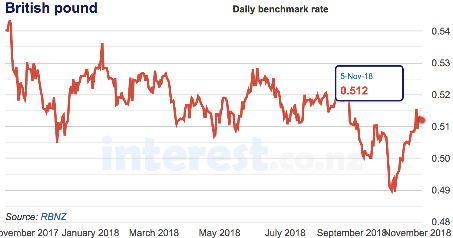
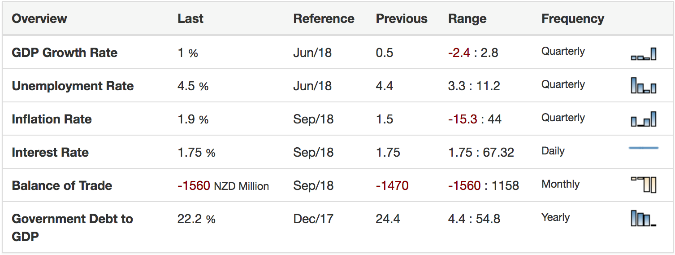
Note the balance of trade (second last line) not looking flash.
Overall, New Zealand’s economy, like the world economy is in that mode of ‘steady as we go.’ The negative sentiment here in NZ over the last several months has so far not materialised into slowing economic growth, although the outlook for economic growth in New Zealand is leading towards being a bit slower in the future. Obviously, New Zealand’s economy is a very small player in a large market and therefore what goes on globally impacts on us here in New Zealand. A steady global economy likely means a steady New Zealand economy in generally.
To Summarise
The ongoing trade skirmish between the US and China has unsettled the market and yet it so far has not developed into a full scale trade war, like many have predicted. Further, there is some noise around the market that Donald Trump is looking to come up with an arrangement with China to lock in some sort of trade deal.
Brexit is still ongoing, which is not useful for either Britain or Europe, however they both have the opportunity to look for alternative trade arrangements. Still, the practicalities of trading between the two economies will be fraught with difficulty moving forward, particularly once Brexit takes hold. In the meantime, uncertainty continues to rise. Although it is difficult to measure, it will be having an impact on the economic growth both ways, potentially more so though on Britain.
Then, there is Italy, that cannot stay out of the news because of its growing debt, new populous government and leanings toward non-compliance with European Union rules in terms of fiscal responsibility. Simply, if they continue to spend like they have in the past, they are not only posing a danger to themselves but also to the greater European Union and therefore to some extent the global economy as well. Although it is early days yet, I suspect among the bluster and sabre rattling, an arrangement will be struck which allows Italy to save face and for the European Union to continue on as before. I have lost count of the number of times I have heard people that are (in theory) in the know, predict the downfall of the Euro. I am talking right back to when the Euro was first formed all those years ago. So far at least, it just has not happened.
China’s economy continues to be, in my view, a vigorously managed economy, with the slowdown in economic growth in the firm grip of the Chinese Government. In my view, there is no real sign of economic Armageddon for China anytime soon.
Then, there is the US economy, which because of Donald Trump (and despite Donald Trump) has continued to grow, although we know that a good proportion of this growth is with the benefit of fiscal stimulus. Nonetheless, we will take what we can get. We have a stable and growing economy with unemployment at record lows and whilst it is not a perfect world and certainly the US economy does not distribute its wealth evenly, at this stage at least, steady as we go for the US economy.
Both Australia and New Zealand have held up well since the global financial crisis and both economies appear to be tracking reasonably well. This is important, more so for New Zealand because New Zealand is a significant trading partner with Australia and therefore when they are happy, generally, so too are we. The reverse can also be true.
By the way, whilst many read these economic updates, there are a number of people who do not have time to read them thoroughly and therefore, in order to save everyone time, WISEplanning will be moving the Quarterly Economic Updates to six monthly economic updates, whilst maintaining the weekly economic updates throughout the year. Bear in mind, that over the summer break, economic updates will slowdown and stop around and during the time that the office is closed. Behind the scenes though, the markets continue and so too does the watchful eye of WISEplanning. Interestingly, it appears also that the resources allocated to investing, including economic updates provides us with an opportunity to fine tune our processes here at WISEplanning. Analysing businesses, it seems, adds more value than watching and reporting on the global economy.
“If you have one economist on your team it’s likely that you have one more than you’ll need.”
Warren Buffett