Should You Worry?
Global Economic Update – Bi-Annual Update May 2019

Peter Flannery CFP AFA
“If you have one economist on your team,
it’s likely that you have one more than you’ll need.”
Warren Buffett
No Need To Worry About The Economy
There may be interruptions along the way, however, the American economy continues to grow and will do so for the foreseeable future. Look at where we’ve been in the last 200 years in America. Look at what has been achieved.
Warren Buffett
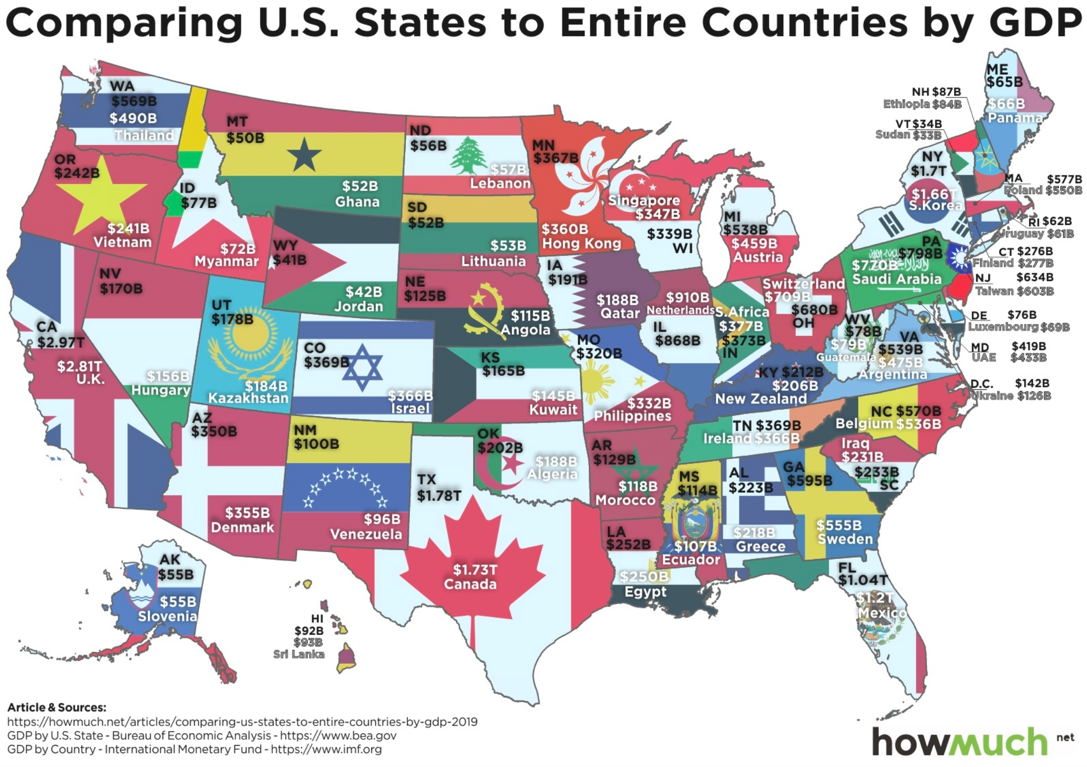
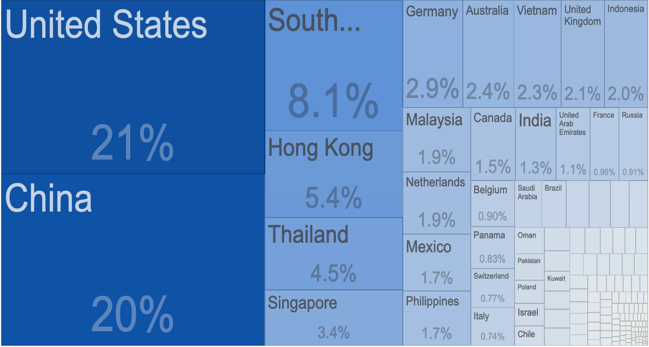
The above chart compares States within America to the economic output of entire countries.
The American economy is huge. In 2018 economic output reached $20.5 trillion (as measured by Gross Domestic Product (GDP)). Total world economic output, as measured by GDP, at the same time was about $80 trillion. The largest state in the US, as measured by economic output (GDP) is California, which is a $2.97 trillion economy. Britain, by comparison, comes in at $2.81 trillion. This, by the way, also makes California the fifth largest economy in the world if it was a country! By the way, Texas is the next biggest economy in America, coming in at $1.78 trillion, which equates to the whole of the Canadian economy coming in at $1.73 trillion. As I have alluded to in the past, the American economy has a unique package like no other economy on earth.
But wait a minute – what about all the debt?! The short of it is, that debt in America is at a high level and manageable. If it gets out of hand, it will create one of those “speed bumps” along the way to ongoing economic prosperity; however, it is unlikely (highly unlikely) to suddenly create economic Armageddon of the type promoted by many “perma bears” (perpetually negative) and other internet jockeys.
This ongoing negative “news” (propaganda?) is read avidly by those with limited insight and only superficial information about what is really going on in the global economy, below the surface. Not everything is a conspiracy. Not everything about the US or the global economy is dangerous or broken.
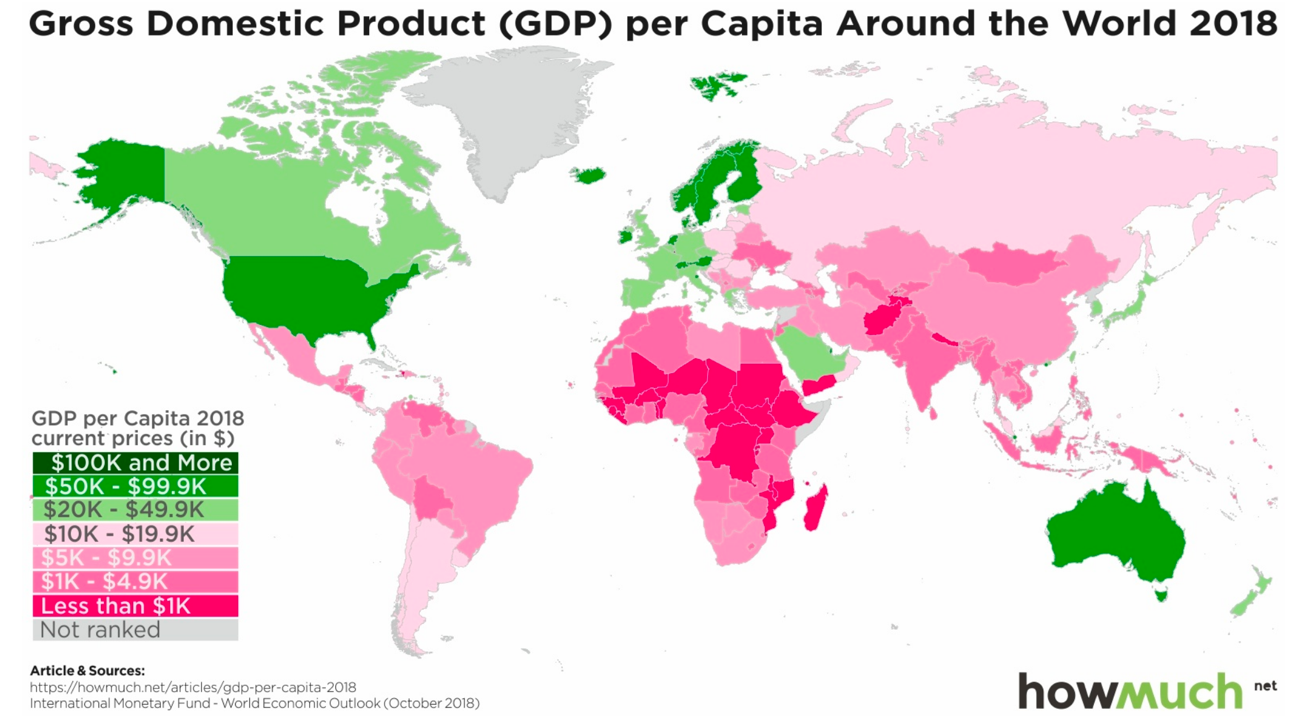
The above chart shows economic output as measured by GDP per person around the world in 2018.
Earlier, I mentioned that the United States of America has a unique package. The above map starts to give us a real picture about which economies are progressing economically and which economies continue to struggle along. Obviously, your Economic Update may generalise from time to time, however we can see that the output per person in the United States of America looks favourable compared to many other large economies around the world. Notice Australia is looking quite strong also. That is good for us, of course, because we trade with Australia.
How is the Global Economy Doing Anyway?
Over all, global economic growth, depending on who you read, came in at around 3.1% which is pretty good when we consider that deflation has not gone away.
Okay, we know it is supported by the liquidity bubble, which includes low interest rates, low oil prices and central bank intervention. That is just the way it is. Nothing that you or I can do about it. However, it is not all bad.
Perhaps the one bad thing that I notice is the difficulty in securing really cheap, bargain-based investments as a result of ongoing central bank intervention, which smooths out market volatility. Then, of course, there is the increase in global debt but remember, the global economy also continues to grow, which is what helps to make the increase in debt manageable. I am not saying the level of debt is right or ideal. I am suggesting that there is no need to worry about it (unless you find that to be a character-building exercise!).
Okay, debt will definitely cause problems somewhere in the global economy at some point. It would appear unlikely though that it will definitely and permanently destabilise the global economy anytime soon – if ever.
If we look at what happened in 2008, on three occasions the global banking system gridlocked – stopped.
A few phone calls and away it went (I am simplifying). I know this sounds basic and maybe a bit scary.
There is nothing you and I can do about it. However, there are those with vested interests who can, and do, take action for the benefit of us all. I am not agreeing with it I am just saying without it we would all have what nobody would want – massive disruption, adjustment. This situation usually hurts the more vulnerable in the economy – everyday citizens.
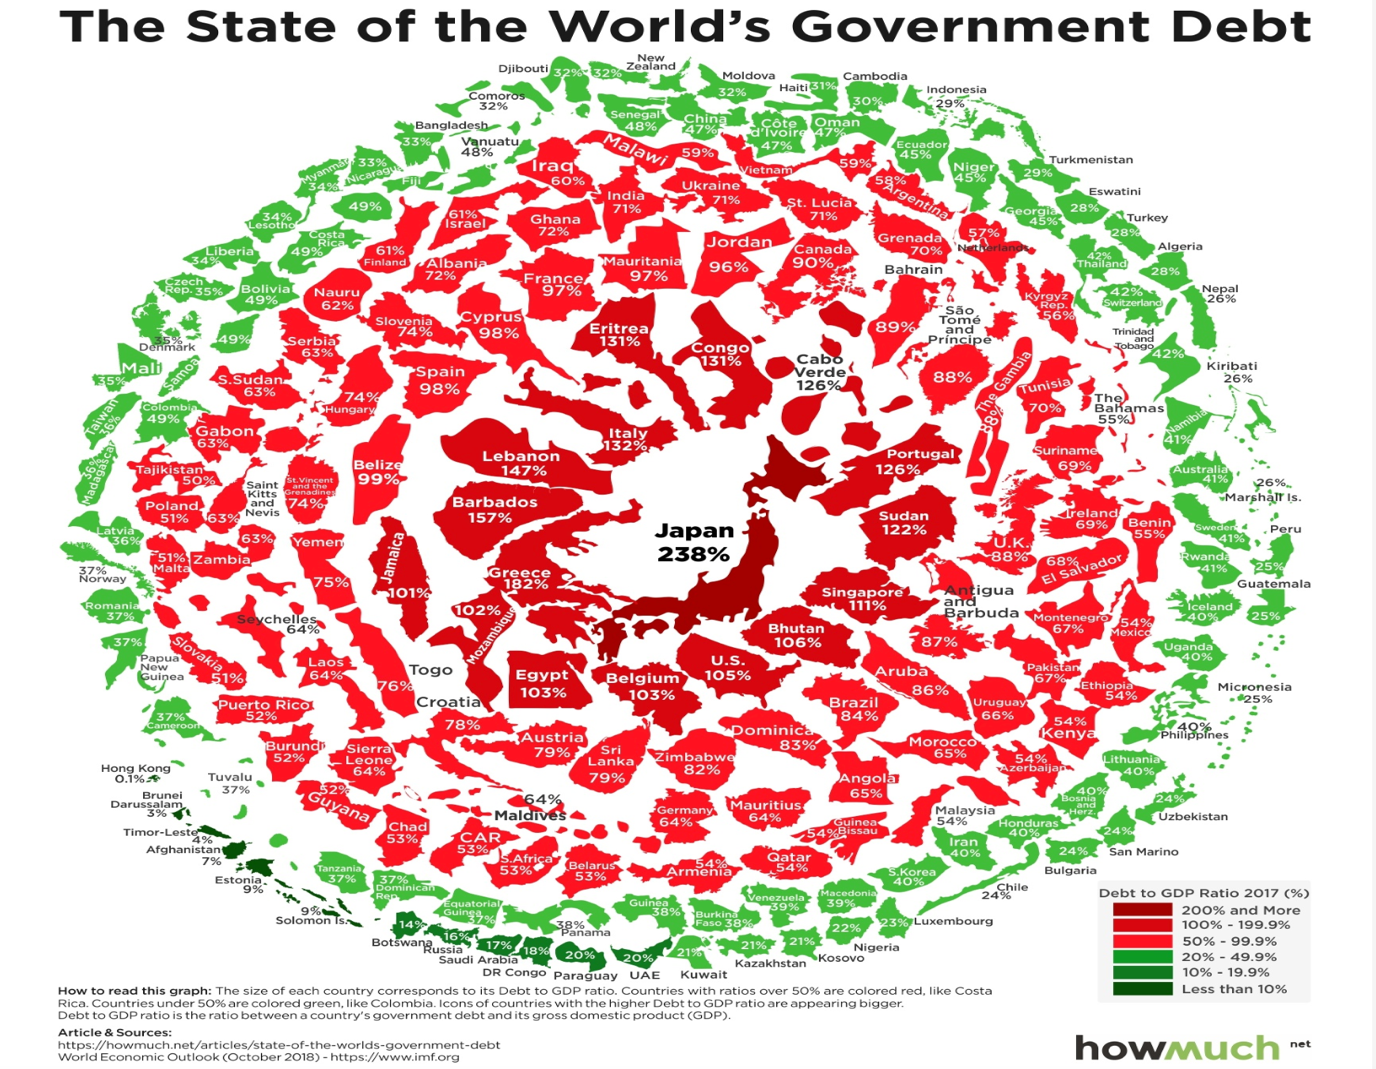
The above chart shows clearly that global debt is a problem.
Global debt is a problem. It is worse for some countries than others. Clearly, Japan, as we have known for many years, has an ongoing problem with debt.
In my opinion, whilst excessive debt for any economy is not good, as we have already seen with the likes of Greece, at times looking to default on its payments, the small size of Greece means that it is not a major issue for the global economy.
The amount of debt for the likes of Japan and the US for example is another story to some extent, however, those economies are well placed to manage that debt through a variety of central bank mechanisms. Many, who perhaps may only have superficial knowledge of economies and their debt, may worry about recessions, soup kitchen lines of the 1930s variety and all manner of bad things that could befall the global economy. However, as we have seen over the last 10 years and even longer than that, these mechanisms used by central bank appear to work – at least in the short to medium term.
Sure, it is all one big experiment, but life goes on. Economies continue to grow. People want more.
Have a think about what you would be willing to seriously give up if you had to? For example, would you give up the internet? Would you give up your mobile phone? Would you give up being able to Google for information about anything from investing to restaurants to holidays to … do you see what I mean? People want the goods and services that our modern economy provides. They can live without those future goods and services that they do not already have, but try taking the ones they already have away from them! Would you give up the convenience of texting? All of these goods and services are recent developments in the scheme of things. Businesses generate profits by providing them to us as consumers. If one business is no longer able or willing to do it, another business will readily step in. That is the economic system that we live in – thank fully.
The problem with debt, I see, is that whilst it can become so large that it becomes a burden, it is the debt servicing that is the real problem and not the quantum of the debt itself. We know this because Japan has huge debt and yet the citizens of Japan continue to live everyday lives in comfort. Why are they are not queuing up in soup kitchen lines? Part of the answer is that their productivity remains reasonable and they have a trade surplus too. Big debt is not ideal but it does not mean that economic Armageddon is just around the corner. just not as simple as that.
The real issue, in my view, is that the servicing of the debt becomes a drag on economic productivity and that can take an economy down the wrong path, even if it does take decades to unfold.
So, how are they doing? I am referring to the economies around the world and mostly they are doing okay. Economic growth in America is tracking at around 3%, which is not too bad. China recently reported economic growth running at an annual pace of around 6.4%. Europe, who continues to battle with deflation, recently came in at around 1.5% annualised economic growth, which is a bit low but not bad when things are not easy.
Brexit, whilst not making it easy for large corporations and having some impact in a very patchy way across the UK economy, has not yet seen an implosion of the economy in Britain. It is one of those speed bumps for Britain and, to a lesser extent, Europe, but one that they will work through, I believe.
There remains, however, some real uncertainty for some of the large corporates who continue to keep their powder dry. That is because, as I mentioned recently in one of my weekly updates, the cost for them to pack up and leave Britain is significant and they will not do that lightly. Still, that is an uncertainty for the UK economy that is not helping overall market sentiment. Anyway, the ultimate leaving date has been “kicked down the road” as it were. The UK economy continues to grow, although at a slower pace than it has for many years.
In general terms then, the global economy is doing okay – steady as we go for now…
The United States of America
American Economic Growth
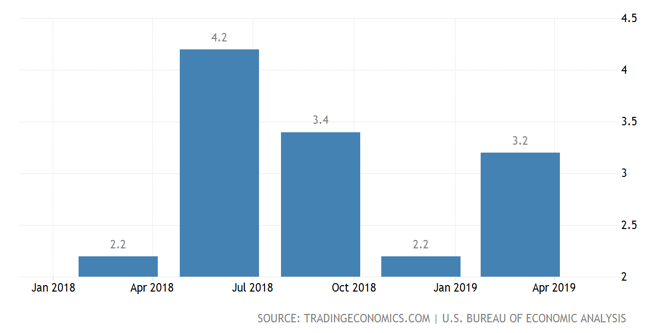
The above chart shows annualised quarterly growth from January 2018 to 31 March 2019.
The American economy appears to have grown by an annualise rate of 3.2% in the first quarter of 2019. Although these numbers are always subject to being revised up or down, this easily beat the expectation of 2% and is not bad when you consider that the previous quarter was a 2.2% annualised expansion rate for the US economy.
Although residential property investment shrank for the fifth period in a row, personal consumption expenditure, private investment, exporting, state and local government spending and other items all contributed to increased activity in the US economy.
In last week’s economic update, I outlined the current situation with interest rates. The US Federal Reserve has decided to keep rates on hold for now.
US Unemployment Rate
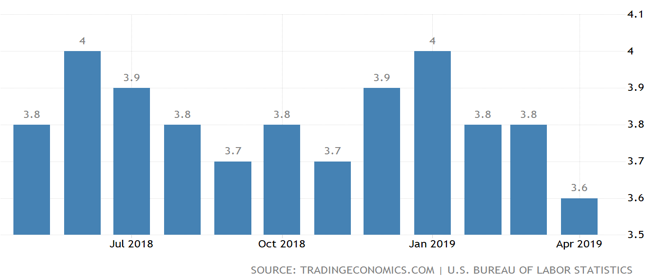
The above chart shows unemployment in America over the last 12 months.
Unemployment in America continues to trend down. “The jobless rate”, as the Americans say, is already at 50 year lows and is considered to be near full employment. As I have mentioned in the past, The Phillips Curve simply suggests that as unemployment declines demand for staff rises and so to does wages. That in turn helps boost economic activity, particularly when you consider that economic activity / growth in countries like America are based on levels of consumption (mums and dads etc spending money). As you know, over 65% of the American economy is based on consumer spending. Therefore, when it increases so to does the economic output of the whole country. The opposite is also true. However, has low unemployment been impacting on wages growth as The Phillips Curve suggests it should?
Wages Growth in America
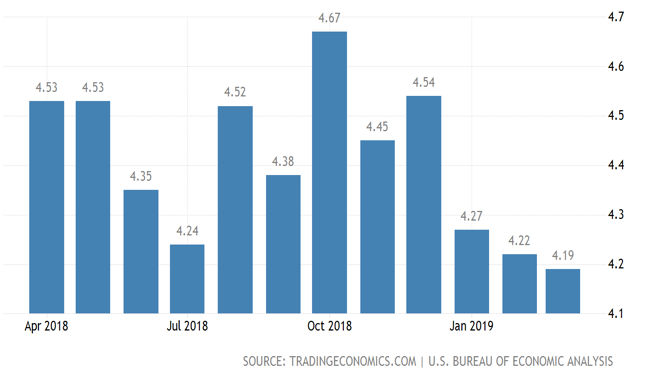
The above chart shows wages growth across America over the last 12 months.
The trend for wages growth is down. This is not ideal for the American economy and will certainly be frustrating the US Federal Reserve Bank governor Jerome Powell (not to mention Donald Trump). That is because mums and dads (etc) across America are not seeing the benefit of economic expansion, particularly when it is compared to some of the wealthy elite in America.
It appears that the rich get richer and the poor stay the same or get poorer (unfortunately, this is nothing new). As far as the American economy is concerned, this also constrains economic growth, particularly when it is centred around consumer spending. That said, there is still wages growth underway, so it is not all bad, but it is not at a level that is regularly contributing to increasing economic expansion in America.
This brings us to the so-called “trade war” between the United States and China. President Trump upset things the other day by openly threatening the Chinese about imposing still more tariffs on Chinese made goods unless Beijing makes a better effort with trade negotiations (!). This is an unusual way to diplomatically negotiate with China or any other economy for that matter.
I do not believe the Chinese are intimidated by his terse statements but still, it is difficult to see how that outburst by Donald Trump has endeared the Chinese to the Americans. Although the details have not been clear, in general terms it looked as though China and America were making progress with their talks over the last few months. Although China continues to play the long game, a trade war with America is not one that the Chinese can win. This is simply because China exports much more to America than America does to China.
At this stage, it appears that the current trade tariffs are having some, but minimal impact on US businesses. However, as Warren Buffet mentioned briefly in Omaha the other day, trade tariffs at 25% would have a meaningful impact here in America (and, of course, in China too). Anyway, Donald Trump in his usual style is letting the Chinese know that he is not willing to accept some of the compromises that have been suggested by China. China, of course, will work this through and whilst it is difficult to know how they will respond as far as the trade negotiations are concerned, they still need American exports in order to maintain economic growth.
Their goal is to maintain economic growth in a range of between 6% and 6.5%. This would be difficult to achieve if a real trade war between China and America emerged as a result of failed talks. For us as investors too, a failure of these talks that leads to a trade war would see increased share market volatility – ideal for us, of course. Anyway, by some estimates a real trade war between China and the United States could reduce China’s economic growth by around 1.5 to 2% over a 12 month period. That is significant if that were to eventuate.
Another interesting facet of the negotiations between China and the US is that we know Donald Trump is not one to back down. Also, intrinsic to Chinese culture is the need to not “lose face” so to speak. The Chinese leader is possibly more intelligent than Donald Trump, however Donald Trump is unorthodox, to say the least. In my view, the situation will be resolved, although it may need negotiations to reach crisis point before a consensus emerges.
Regardless, so far, the American economy continues to grow at a steady pace, despite Donald Trump and difficult times between the US and China.
The Euro Area
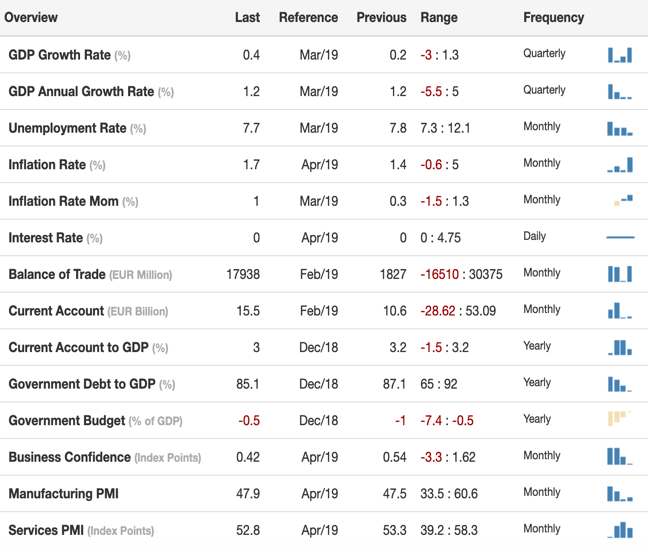
The above chart shows a mixed bag of data for the Euro area.
The European economy remains sluggish but steady. Without doubt it would be a more difficult situation for the Euro area without the support of central bank intervention, low interest rates and low oil prices.
Economic Growth in the Euro Area
The above chart shows economic expansion in the Euro area since July 2016.
Economic growth in the Euro area is stable but sluggish. Indeed, the trend since July 2017 has been down. The Euro area economy, by some measures, is the second largest economy in the world. Therefore, should it stumble significantly this would impact on the global economy to a degree.
Of the 19 member states, the biggest member states are Germany (29% of total GDP), France (20%), Italy (15% – currently borderline recessionary) and Spain (10%).
Looking more closely at the first quarter of 2019, while some data is not available, Spain’s economy grew by an improved 0.7%, while economic growth in France remained unchanged at 0.3%.
In general terms, a slight surprise on the upside but slow going – do not hold your breath for an economic upswing anytime soon.
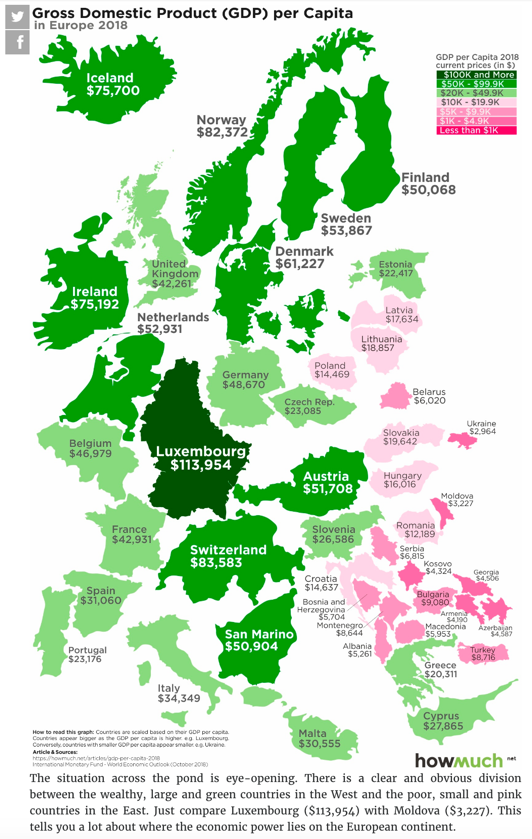
The above chart shows the level of economic productivity per person.
Economic productivity in Europe is quite strong, although the further east you move the weaker it becomes (the pink countries on the chart above).
To give you some perspective, New Zealand comes in at $41,616. Australia $56,698. Interestingly, Ireland is currently more productive than Britain.
Inflation in the Euro Area
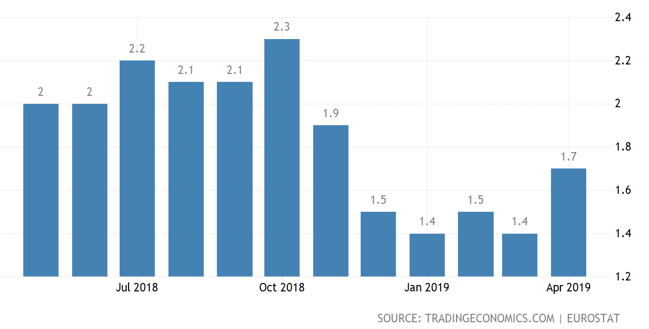
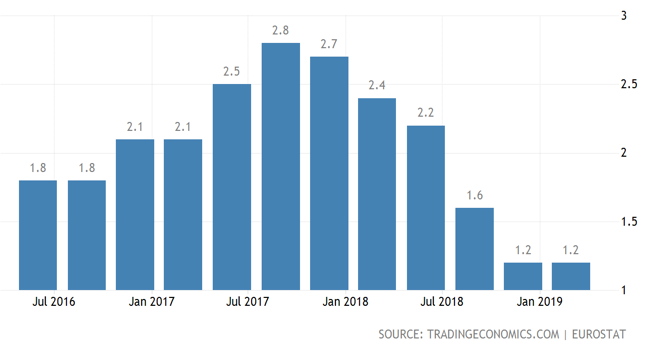
The above chart shows the level of inflation in the Euro area over the last 12 months.
Inflation in the Euro area has been stubbornly low but has sprung upwards if recent estimates prove correct. Annual inflation in the Euro area is expected to rise to 1.7% in April 2019 from 1.4% in the previous month. This is above market expectations of around 1.6%.
It is also the highest inflation rate in five months and has been boosted mainly by increasing costs of energy and services.
Too much inflation is a bad thing for everyone, however the Euro area needs more inflation now to help keep it away from dreaded deflation.
China
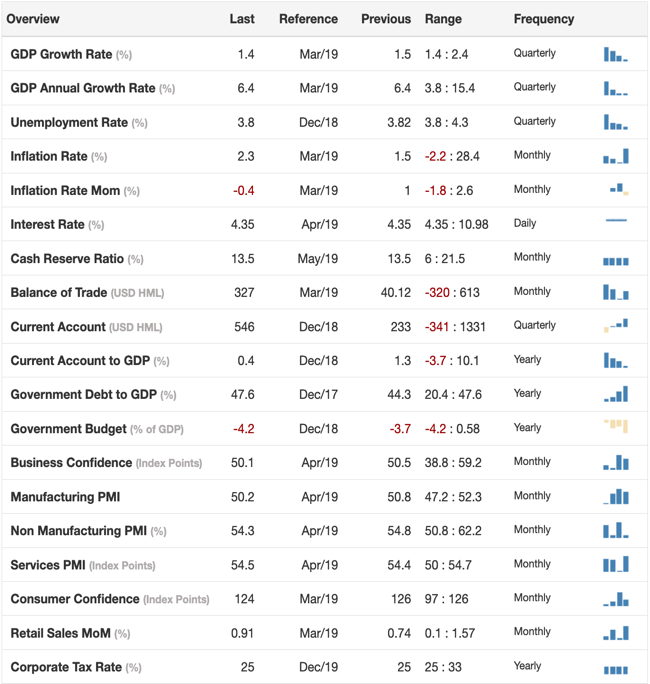
The above chart shows a number of key economic indicators for the Chinese economy.
The Chinese economy continues to be tightly managed by the Chinese government and growing strongly. Keeping the Chinese economy on track and continuing to grow, particularly at the current pace, is not easy. China is a large and diverse economy with 1.3 billion people to manage, feed and look after. When things are going well for economic growth, that growth maintains its own momentum. On the other hand, when some of the key drivers of an economy begin to go awry, it can be very difficult for the economy to get back on track. All things considered the Chinese economy is going well.
China GDP
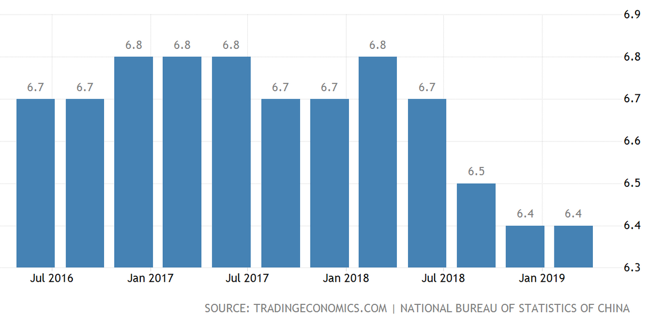
The above chart shows economic growth in China over the last 12 months.
The trend for Chinese economic growth is down. That said, as I mentioned earlier, it is a managed and controlled slow-down, which is sensible and good for everyone. If left to simple market driven forces, the random nature of the unpredictable market could create significant difficulties not only for China but, because of its size, for the global economy as well.
That is why, in my view, the Chinese government is doing a good job of managing this slow-down in the Chinese economy. Outlier events that can get out of control are minimised. Not that we mind volatility as investors. However, from an economic perspective and for everyday citizens, stability is preferred.
The latest data shows that the Chinese economy grew by an annualised rate of 6.4%, which is slightly ahead of market expectations of 6.3%. This appears to be driven by a combination of industrial output growth that has accelerated noticeably and consumer demand that also strengthened, helped possibly by the Chinese government’s pro-growth policies. The Chinese government, I believe, is very focused on maintaining their pro-growth policies to help stabilise market fears around the trade dispute with the United States.
Although the first quarter growth in 2019 was weaker than the same time last year, it is nonetheless ahead of expectations and therefore on track with government driven expectations.
Chinese Exports to the World
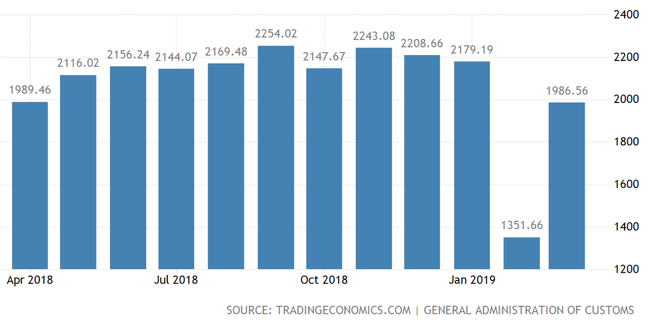
The above chart shows the amount of trade in US dollar terms over the last 12 months.
Although the shift is underway from exporting to a more consumer driven economy, nonetheless exports remain very important to Chinese economic growth and stability. The chart above shows what could be a trend, starting from potentially September 2018, of slowing exports. It will be interesting to watch this chart to see whether the trend continues. Of course, if Donald Trump has his way the trend on this chart will continue in a strong, downward direction for some time to come.
The Chinese, on the other hand, may or may not wish to be obliging right now but might be longer term. However, in the short term I suspect the Chinese will continue to push back, because of the importance of exports to the health of the Chinese economy.
Chinese Exports by Country
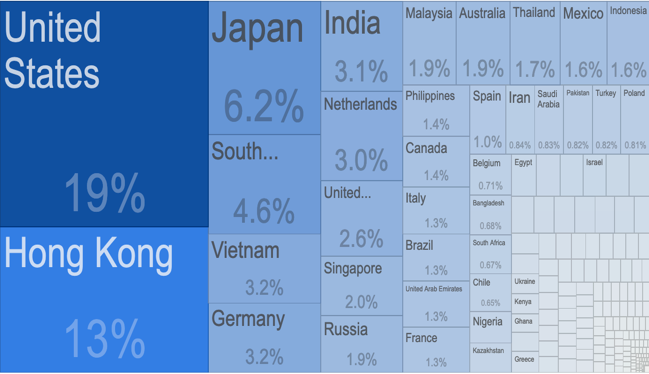
The above chart shows who is buying Chinese exports.
The above chart shows why Donald Trump is very focused on reducing Chinese imports into the United States. The challenge for China is that, because they export much more to America than America exports to China, it would be difficult for China to win any trade war.
That said, a “tit for tat” approach would still hurt American companies and we are seeing evidence of this already, although at a low level. By the time you read this, we will know whether the ramping up of tariffs on Chinese goods has been implemented or pushed down the track further? As I am preparing this report, markets around the world have dropped on the news of increased rhetoric between China and the United States.
Donald Trump, of course, as usual as the perpetrator, whereas the Chinese are the respondents. As I have mentioned elsewhere, Donald Trump is not known to back down. The Chinese culture has built into it a tradition of not being seen to back down or lose face as well. I believe China will continue to play the long game with regards to trade tariffs and ongoing trade negotiations.
As you will know, China are pushing hard with their Belt and Road initiative which, in the fullness of time, may take some pressure off trade tensions between the US and China although I imagine, not fast enough for Donald Trump.
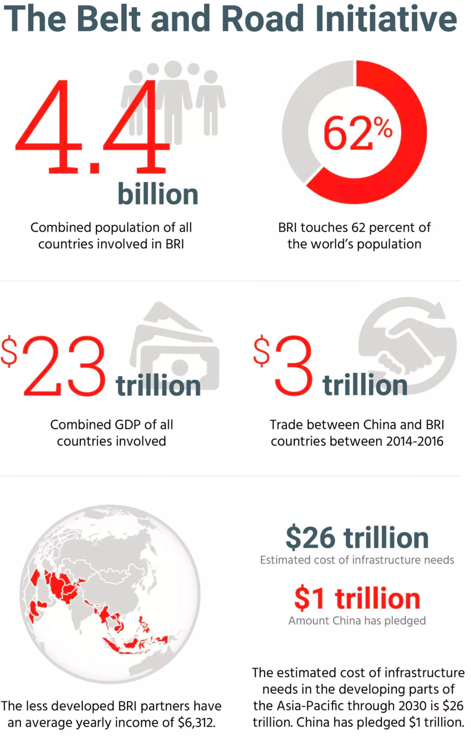
The above chart shows some key numbers that relate to China’s Belt and Road Initiative.
The Chinese Belt and Road Initiative is huge. The short of it is that this initiative is likely good for world trade, particularly for the trading partners of China although some western economies and governments see this as China progressing their world dominance through trade.
From China’s point of view, the purpose of the Belt and Road Initiative is to pursue development and the resulting growth potential of various countries in order to an achieve economic integration that delivers benefits to all participants. The Belt and Road Initiative is an umbrella type strategy encompassing a variety of investment projects designed to enhance the flow of goods, people and investment.
Many developing countries are benefiting from the funding by China for their infrastructure projects. China, of course, is an emerging and strong economy with scale.
Beijing has injected significant amounts of capital into many Chinese public financial institutions such as the Chinese Development Bank and the Export / Import Bank of China.
These banks have the benefit of low borrowing costs as their bonds are treated like Chinese government debt with very low interest rates. They have access to lending from the Peoples Bank of China, allowing them to lend cheaply to Chinese companies working on Belt Road projects.
As a consequence, there have been a number of examples where competing construction companies (e.g. Japan) have lost out to Chinese competitors who are all bidding to help build infrastructure projects in the likes of Indonesia and other economies because their Chinese counterparts win out due to their low funding costs.
However, there have been instances of shoddy workmanship from some Chinese companies leading to problems with some of these projects that can be attributed to the awarding of major projects simply to the cheapest bidder without taking into consideration the quality of workmanship.
Regardless of these issues, the Belt and Road Initiative is massive, and I suspect will help drive economic expansion for many of its participants. One notable exclusion, of course, is the United States of America.
Anyway, there has been much made of the fast-growing Chinese debt and the inevitable problems that the Chinese economy, and therefore the world economy, will face.
There will always be speed bumps along the way however, the Belt and Road Initiative is just one reason why the Chinese economy will likely remain robust for decades to come. What do you think?
Japan
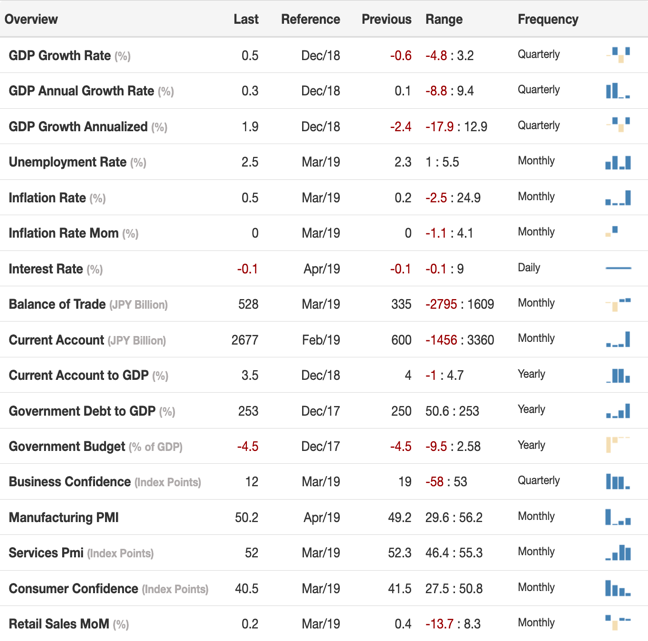
The above chart shows mixed economic data for Japan.
Japan remains firmly in the grip of “deflationary funk”. The massive intervention by the Japanese Central Bank and creation of billions of dollars of funding has enabled the Japanese economy to remain relatively stable but has not enabled the economy to break free from the firm grip of deflation.
Japan GDP
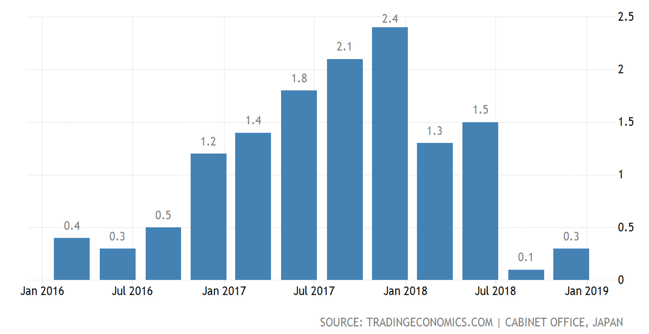
The above chart shows economic growth in Japan since January 2016.
Economic growth in Japan remains sluggish at best. Economic growth in Japan advanced 0.3% in the fourth quarter of 2018 compared to 0.1% in the previous quarter. The Japanese economy is still attempting to recover from the excesses of the 1980s, having been in the grip of deflation for almost 30 years.
The average annual rate of economic growth (GDP) is 1.98% from 1981 until 2018 – low. Economic expansion in Japan reached an all time high of 9.40% in the first quarter of 1988 and a record low of -8.80% in the first quarter of 2009.
Japan is an example of an economy that has faced extreme difficulties and yet it continues and has not fallen off the proverbial economic cliff. This is due in no small part to the significant intervention by the Japanese Central Bank. Further, Japan’s economy is the fourth largest in the world by some measures, is quite diversified and technologically advanced. Services account for around 62% of economic growth, which is not unlike many other developed economies.
Interest Rates Japan
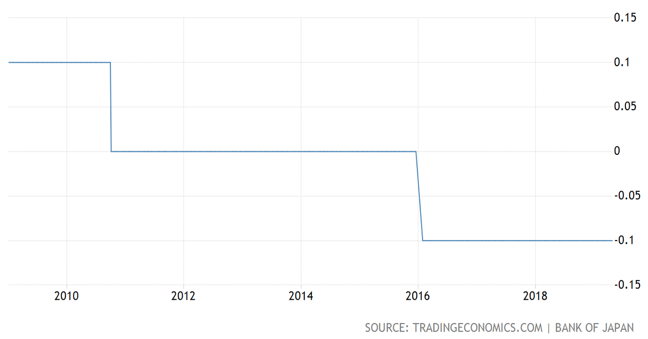
The above chart shows the decline in interest rates over the last 8 years or so.
The interest rates in Japan remain negative. This is a strong indicator of ongoing deflation.
The Bank of Japan left its key short-term rate unchanged at -0.1% at its recent April meeting (yes, negative 0.1%).
It also is keeping its target 14-year government bonds at a yield of 0% as widely expected. The committee stated, not surprisingly, that it intends to keep the current extremely low levels of short term and long-term interest rates for an extended period of time.
Inflation – Japan
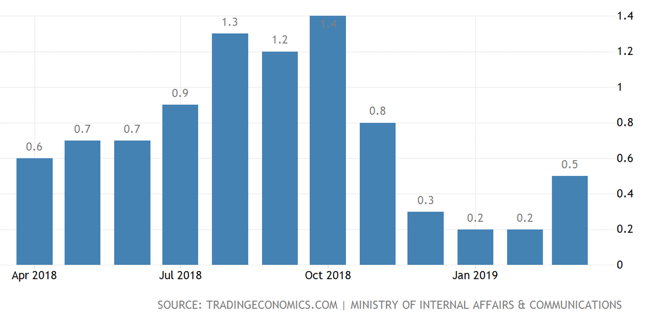
The above chart shows how inflation has been tracking over the last 12 months.
Inflation in Japan remains stubbornly low – not helping. Too much inflation diminishes the real value of things, however, not unlike many parts of the world, the inflation in Japan is too low. Japans’ consumer price inflation rose 0.5% year on year in March 2019 from 0.2% in the previous month and was pretty much in line with market expectations. Notably, it was the highest inflation rate since November last year.
Current Account – Japan
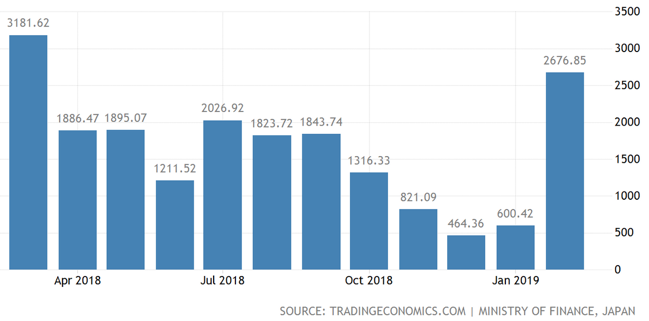
The above chart shows Japan’s trading surplus over the last 12 months.
The Japanese economy continues to perform well in terms of exports. Japan’s current account surplus increased to 2.68 trillion Japanese yen in February 2019 from 2.14 trillion Japanese yen in the same month last year. Notably, this was the largest current account surplus since March 2018. This, of course, is helping support and stabilise the Japanese economy.
Japan – Who Do They Export To?
The above chart shows Japan’s major export destinations.
Japan continues to enjoy strong exports. Notice the United States is the number one destination followed closely by China. Although Donald Trump has been highly vocal about the US Chinese trading relationship, he has also in the past mentioned Japan. It will be interesting to see, if and when the Chinese US situation is brought under control, as far as Donald Trump is concerned, who he turns to next?
The United Kingdom
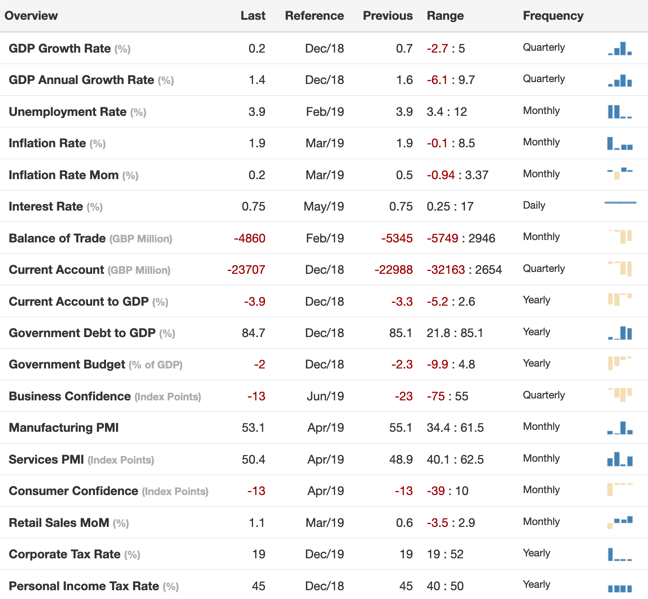
The above chart shows a mixed bag of economic indicators for the UK economy.
Britain remains under the cloud of Brexit uncertainty. Longer term, I believe the Brexit challenge will fade away and become a distant memory, however there are some serious decisions to be made between now and then.
The economy has slowed down but has not fallen off the cliff, as it were, and economic growth continues, despite the uncertainty of Brexit.
The CEOs and management of many large corporates that are domiciled in Britain are urging the Government to reach consensus and to finalise its decision. From their perspective, Brexit creates uncertainty, making it difficult for them to commit to long term investment. This is harmful to the UK economy and is impacting somewhat now but will continue to impact for some time to come.
As I have mentioned previously though, it is a huge decision for a large corporate organisation to withdraw from Britain. The reason is because Britain is a mature, developed and established economy and a relatively safe place to operate a business. Brexit, of course, is not helping.
UK Economic Growth (GDP)
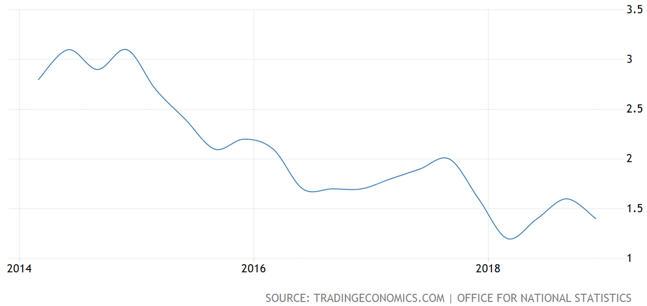
The above chart shows declining economic growth in Britain over the last five years.
Economic growth in the United Kingdom continues, although at a slow pace. Britain’s economy expanded by 1.4% year on year in the fourth quarter of 2018, compared to the previous period’s expansion at 1.6%. Simply, household consumption and government spending supported economic growth, while business investment declined, and net trade also slowed down economic expansion.
UK – Interest Rates
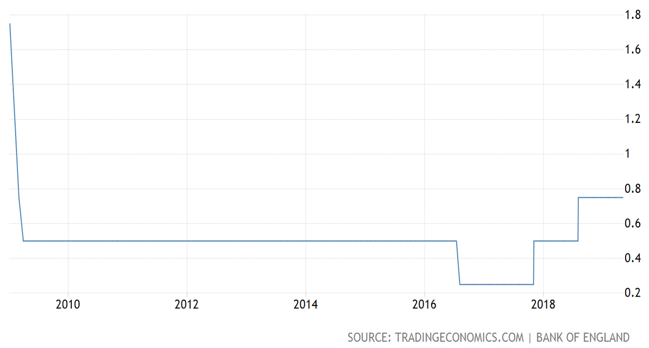
The above chart shows interest rate movement over the last 10 years.
Interest rates in Britain remain low, indicating deflation is not far below the surface. Even though interest rates were increased a couple of times over 2018, they still remain below 1%, which of course is for the purpose of helping support struggling economic growth.
The Bank of England’s Monetary Policy Committee voted unanimously to hold the bank rate at 0.75% during its May policy meeting. They also reaffirmed their pledge to gradually increase interest rates in a limited way in the future even though there is strong evidence of economic slow down across Britain and, potentially, around the world too. The bottom line is that they will hold interest rates as long as they need to, not increase them and certainly consider a rate cut if need be.
UK House Prices
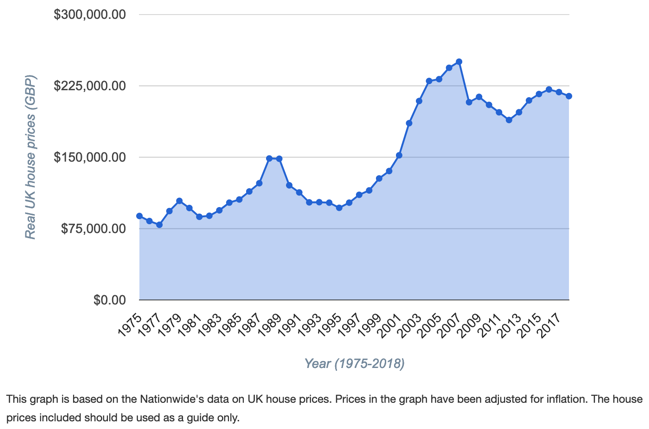
The above chart shows the change in house prices across the UK from 1975.
House price growth slows in Britain – unsurprisingly. Not unlike New Zealand, Canada and other parts of the world, house prices across Britain are expensive by a number of measures.
The market, of course, determines house prices and is inclined to overlook the expensive nature of property on the basis that it believes that those prices will keep climbing.
Interestingly, only recently we have seen data out of the UK showing that wages growth is increasing faster than house prices. However, drilling down into the data it appears that the slow down in house price growth in the UK was mainly due to the price of an average London home falling by around 3.8% over the last 12 months. However, that is the steepest drop since mid-2009, which of course was in the midst of the global financial crisis.
Although it is difficult to measure, it appears that Brexit is at least partially responsible for the uncertainty around housing and therefore potentially those slowing price rises. There has been much banter around what would happen to property in a no-deal Brexit. The short answer is that no one seems to have a reliable and confident answer. It looks like we will need to wait and see.
UK Unemployment
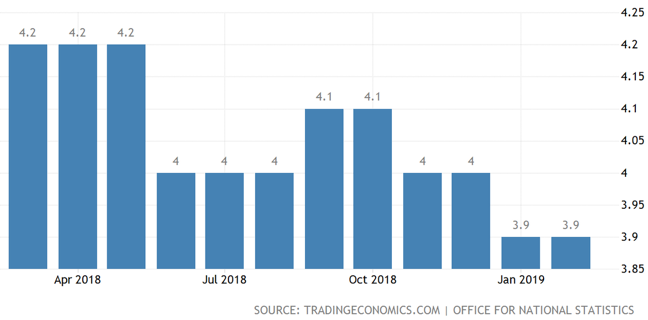
The above chart shows the decline in unemployment over the last 12 months.
Unemployment is low. The UK unemployment rate stood at 3.9% in the three months to February 2019, its lowest level since November 1974 – January 1975 period. Employment continued to increase at a solid pace despite Brexit uncertainty.
UK – Wages Growth
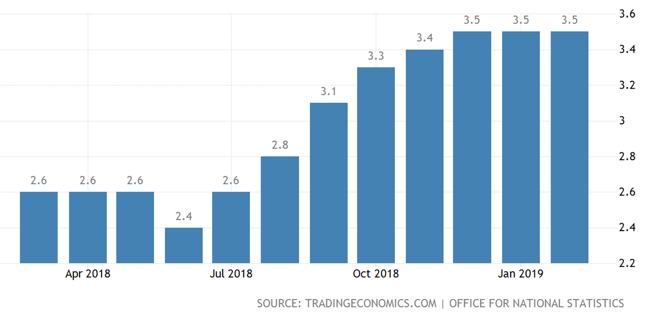
The above chart shows wages growth over the last 12 months.
Wages growth has been improving over the last 12 months but remains steady at the moment. As per The Phillips Curve, when unemployment is low, wages growth ideally should start to increase. Unlike many other economies around the world, we have in fact seen that effect in Britain.
Total earnings, including bonuses, increased by an annual rate of 3.5% to £529 per week in the three months to February 2019. This will help underpin the economy in the UK even though Brexit has created significant uncertainty.
Although economic growth in Britain has slowed down over the last few years, the economy remains stable and continues to grow despite the uncertainty surrounding Brexit. It will indeed be interesting to see how Brexit ultimately unfolds.
Australia
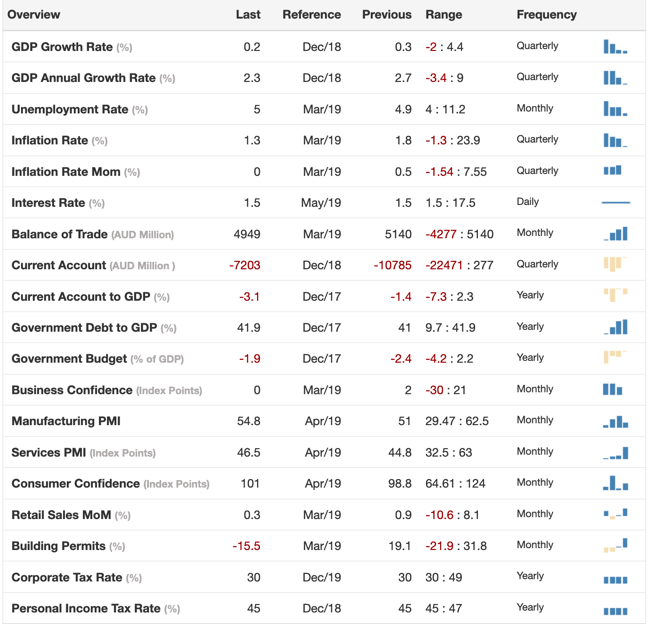
The above chart data shows a stable economy, although improvements in trade might be beneficial.
Australia has gone 27 years without a recession. America, by comparison, if it continues growing at its current pace without two consecutive declines in GDP, will enjoy its longest period of growth on record – 10 years. Australia does indeed look like the lucky country.
Australia – Economic Growth (GDP)
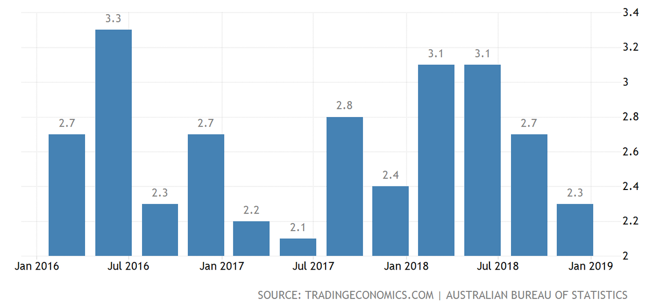
The above chart shows Australia’s economic expansion since January 2016.
In recent times, since January 2018, economic growth in Australia has been reasonably stable but on somewhat of a downward trend. The Australian economy expanded 2.3% in the fourth quarter of 2018, over the same quarter of the previous year.
As I have mentioned previously, Australia’s economy is dominated by the service sector (65% of GDP). Certainly, mining has contributed to its economic success in recent years but is only 13.5% of GDP. Manufacturing represents 11% of GDP and construction is 9.5%. Despite its lengthy track record of economic growth, Australia is not immune to global influences and, like most other countries, is facing the headwinds of a slowing global economy.
Not the end of the world for Australia but certainly a headwind that the Reserve Bank of Australia will be taking into account with regard to the official cash rate.
Australia – Official Cash Rate
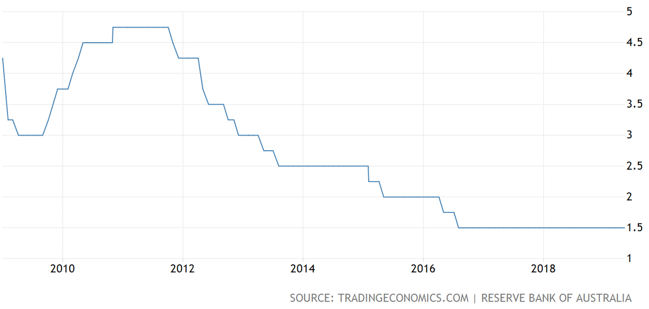
The above chart shows the Official Cash Rate over the last 10 years.
Interest rates in Australia remain at a record low of 1.5%. At the recent May meeting, the Reserve Bank of Australia extended the record period of low interest rates by keeping the official cash rate on hold. Some commentators were predicting a rate cut, although policy makers appear to be focused on headline inflation, which sits at around 2% which is not a bad level of inflation all things considered, particularly compared to a number of other countries around the world. The Reserve Bank of Australia will be watching inflation, which fell to 1.3% in the first quarter of 2019 from 1.8% in the previous period, missing market expectations of 1.5%. This was the lowest inflation rate since the third quarter of 2016 in the midst of lower house prices.
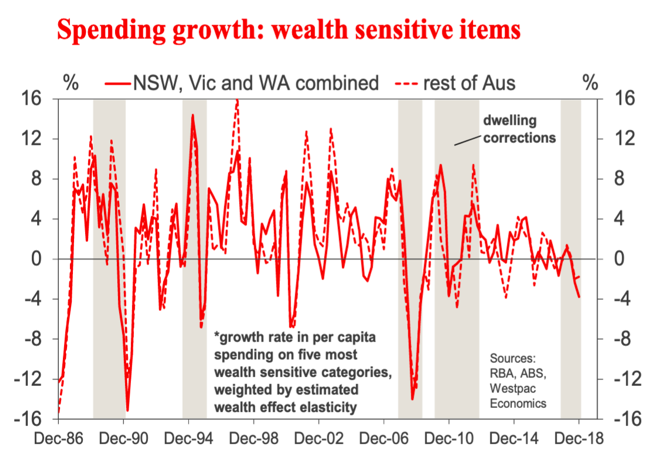
The above chart looks at the wealth effect – how consumer sentiment is affected by declining property prices and consumers willingness to spend money on specific items.
Some economists expect falling house prices to result in a noticeable “wealth effect” drag on Australian consumer demand over the next year or so. Lower house prices basically have a dampening effect on consumer confidence and impacts directly on spending patterns. When people feel less confident, they generally spend less, particularly on large durable items. In particular, spending categories such as discretionary items, large home appliances and motor vehicles can see a change in spending habit as the wealth effect diminishes.
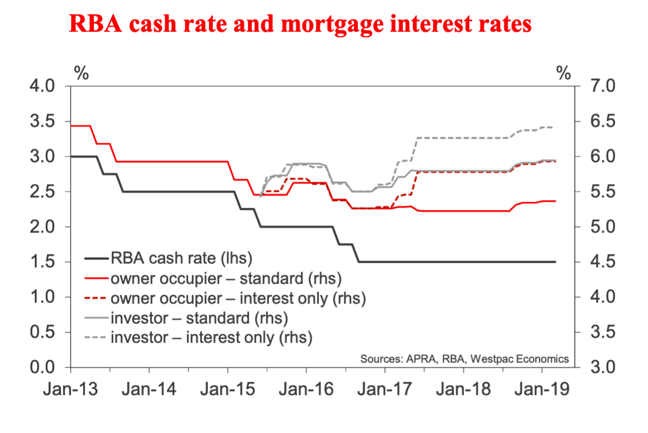
The above chart compares the official cash rate (left hand side axis) with various interest rates (right hand side axis).
As the economy slowed quite markedly over 2018 the Reserve Bank of Australia has held the official cash rate at the all-time low of 1.5%. As a result of the Reserve Bank of Australia imposing lending restrictions on Australian banks in 2014, less funds were available for lending and also, as the chart above shows, interest rates for borrowers have stepped up.
We normally think that when the official cash rate is lowered that the banks will lower their interest rates too. Yes, this does happen however, when the Central Bank has imposed lending restrictions this is not necessarily the case.
In Australia, among other things, we have had lending restrictions along with increasing interest rates, which has flowed on to declining housing prices in Australia.
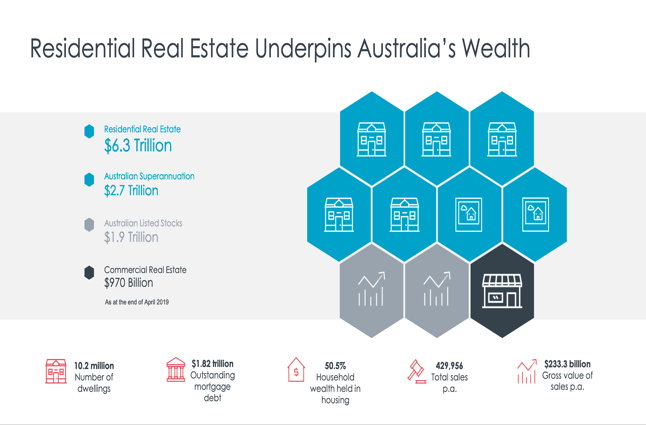
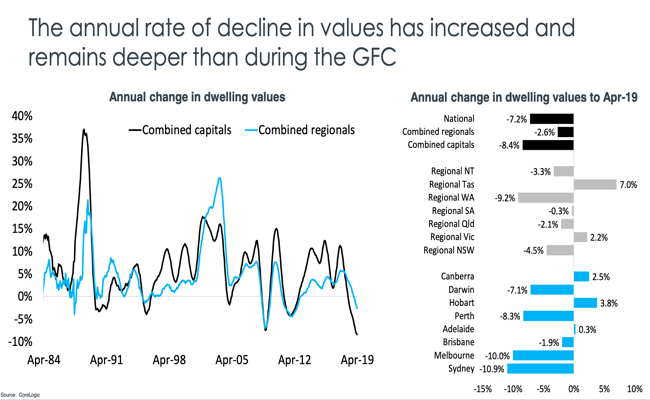
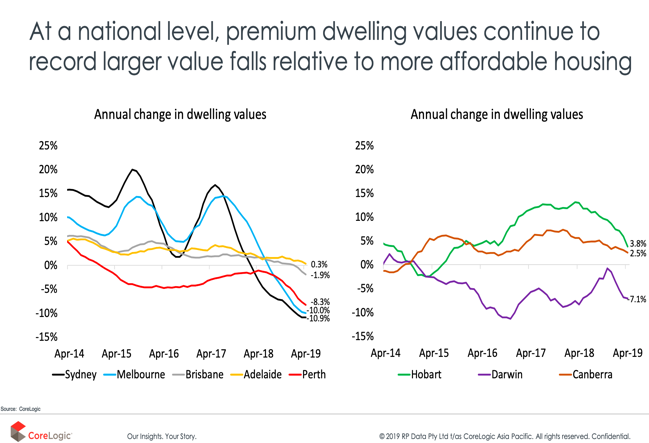
The above three charts show the significance of residential property to the Australian economy and how far prices have declined.
Home prices across Australia continue to decline. As outlined earlier, this is due mainly to lending restrictions imposed on banks by the Reserve Bank of Australia in 2014 along with increasing interest rates, even though the official cash rate has declined.
I suspect many home owners and investors alike have been surprised, even caught out by the fact that property prices can in fact move in a downward direction (not always up, up and up forever). It will stabilise in due course. Unfortunately, there will be some casualties, although home owners and investors with reasonable levels of debt, but more importantly strong ability to service debt, should be okay.
Overall, the Australian economy, whilst not immune to global influences, remains stable and continues to grow, although at a slower pace than 12 months ago.
New Zealand
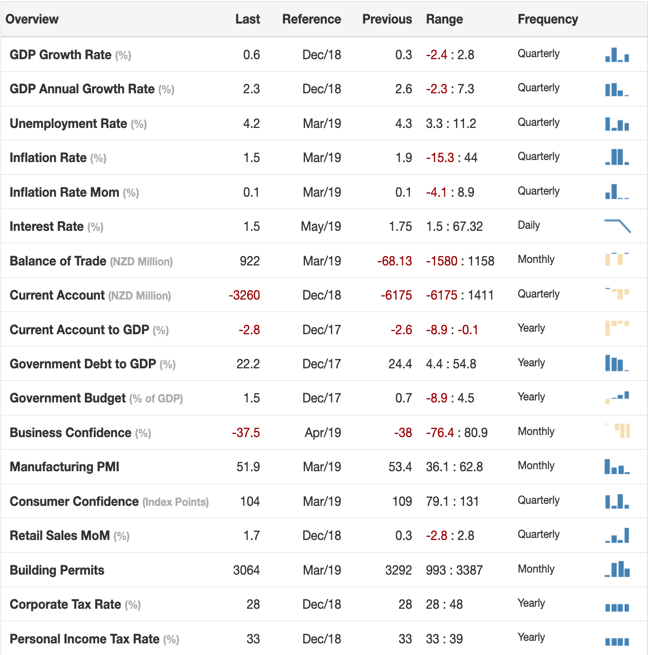
The above chart data shows a mixed bag of information, a stable but fragile economy.
Dairy Prices
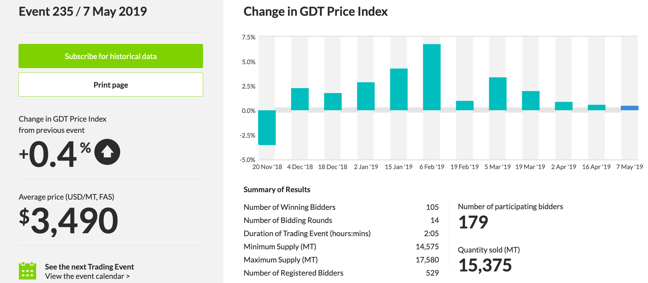
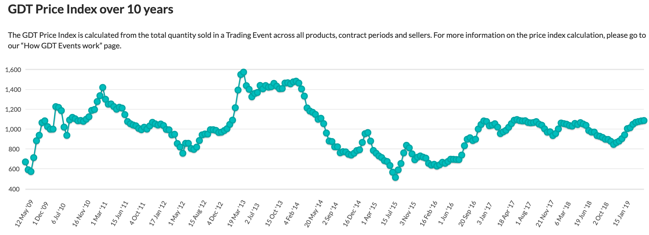
The above chart shows the movement in dairy prices since November 2018.
Overall, dairy prices have remained relatively stable. Dairy prices have remained relatively steady since September 2016 and as the above chart shows, the decline from March 2018 through October 2018 has reversed with an uptick having taken place since then.
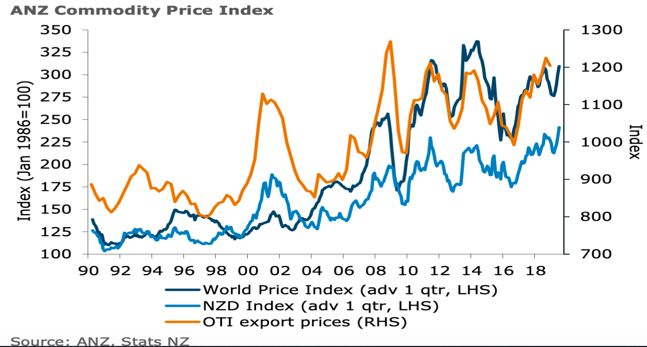
The above chart shows commodity prices comparing global and New Zealand prices (left hand side axis).
Dairy prices gained 4.4% month over month in April after a reasonably strong lift in the previous month. It appears that markets continue to be supported by tighter global supply. Supply has tapered off somewhat and this season, modest global supply may help underpin the market, which could see prices hold at around current levels.
The Truckometer
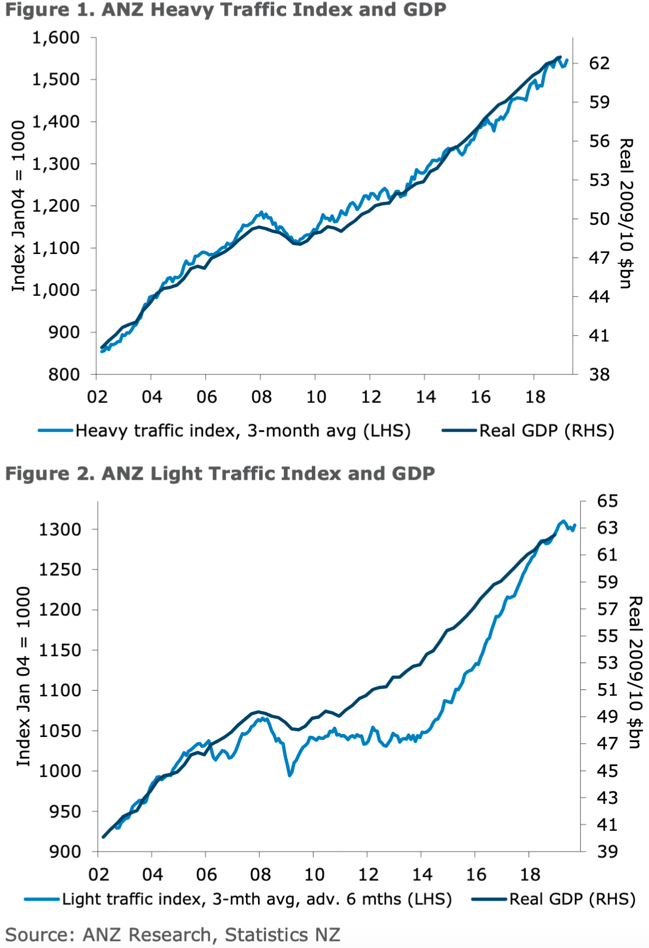
The above two charts show movements in heavy traffic freight and light traffic freight across New Zealand.
The ANZ truckometer indexes were both mostly stable over March. The heavy traffic fell 2.0% month over month, while the light traffic lifted 0.7% month over month.
The light traffic index may suggest a broad loss of momentum, which is consistent with slowing economic growth in New Zealand. However, there may be some tentative signs of a bottoming out coming up, possibly.
The ANZ truckometer is a set of two economic indicators using traffic volume data around New Zealand. These traffic flows are considered to be a proxy for economic activity, particularly in New Zealand where a large proportion of freight is moved by road.
The Heavy Traffic Index tends to align with overall economic expansion as measured by GDP. The Light Traffic Index may have a six-month lead on activity as measured by GDP and therefore could be considered somewhat of a leading indicator.
NZ – Official Cash Rate
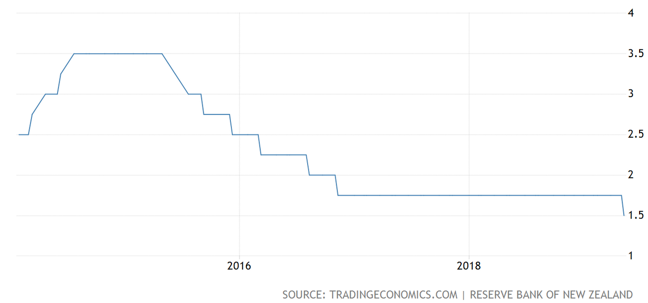
The above chart shows the last five years of interest rate movements in New Zealand.
Adrian Orr, the governor of the New Zealand Reserve Bank, has just announced a cut to the official cash rate. This takes the official cash rate in New Zealand down to an all-time low of 1.5%.
This, I imagine, will see the market respond excitedly about lower interest rates and a slight improvement in cash flows. It appears that everyday Kiwis measure most things by how much cash flow they have left over. I suspect this could see some buoyancy and an uplift in property buying activity given the slight improvement in affordability for housing. This may also see a slight increase in spending.
At the risk of “raining on the parade”, the New Zealand Reserve Bank is looking to impose what are effectively lending restrictions in due course, as it looks to sure up the balance sheets of New Zealand banks.
In simple terms, this just means banks may need to allocate more funding to their balance sheet to be ready for a major global event, so that they can keep depositors funds safe. In effect, this is putting money aside for a rainy day.
The outcome could be less money available to lend. The flow on may mean lower interest rates for term deposits. Those living off term deposits in retirement think it is difficult now. Rates could go lower for them (!).
It could also impact on property prices negatively as money is more difficult to get for housing, reducing demand. Therefore, we could see an effect similar in some ways to what is going on in Australia now.
This is not a prediction but certainly a real possibility. At the same time, immigration into New Zealand remains reasonably strong and oil prices reasonably low. The combination of those two could help limit the decline in property prices. On the other hand, rising oil prices could limit tourism and immigration which of course would have a ripple effect throughout the New Zealand economy.
To Summarise
The global economy has been performing reasonably well over the last few years, although of course, supported by central bank intervention, low interest rates and low oil prices.
Debt levels have ballooned, however economic growth has gone part way to helping support increased levels of debt or more importantly the servicing of debt levels, whether it be governments around the world, mums and dads or corporations. Notably, in the US corporate debt is at an all-time high, although businesses in the US are also strongly profitable with the outlook remaining positive.
High levels of debt, of course, are not a problem when everything is going well, and the sun is shining. When credit restrictions or other events cause asset prices to decline sharply, this can impact on certain sections of the economy, which in turn can create cash flow difficulties. In my view, these events are a reset and a natural component of markets progressing and growing. Growth is not a straight line.
I do not see the so-called “black swan”. There are numerous so-called “grey swans” however I regard those as more minor resets or speed bumps along the way. Still, they can cause a significant upset. However they don’t tend to be the cause of major economic destruction.
It is important to be aware of what is going on around us.
Most everyday Kiwis, it appears, could care less about the global economy and are really only particularly interested in what is happening now or what is right in front of them (interest rates, house prices, the weekly bills etc).
Of course, this approach keeps things simple but can be subject to strong surprises of the negative variety occasionally.
For example, whilst I regard residential property as a core investment (excluding the family home) investing in residential property (home or investment) because everyone else does or because prices always seem to always go up, is more like wishful thinking than any kind of strategy.
We are at the tail end of a protracted liquidity bubble, which has meant ideal conditions for residential property. Not just in New Zealand, but in a number of other countries around the world who are now seeing property prices decline (e.g. London, Vancouver, Sydney, Auckland…).
Adrian Orr’s idea about shoring up the balance sheet of New Zealand banks is probably wise however it will be interesting to see what impact it has on residential property prices throughout New Zealand when the time comes.
The looming global economic slow-down is certainly something to watch. I will keep you posted…