Global Economic Update
Global Economic Update – February 2018

Peter Flannery CFP AFA
“If you have one economist on your team,
it’s likely that you have one more than you’ll need.”
Warren Buffett
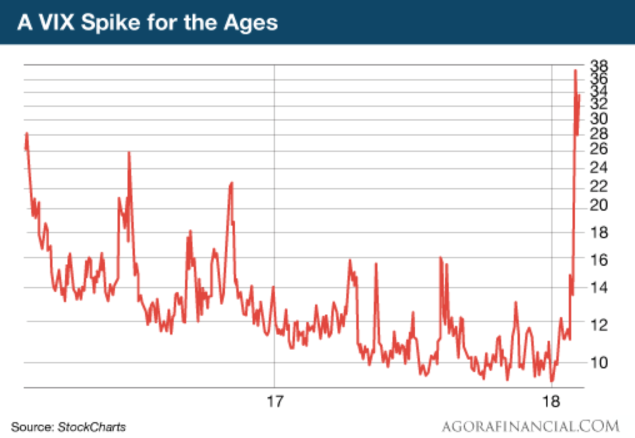
The above chart shows a return to pricing volatility across the markets. It represents a symptom… that something is going on in the economy…
What is going on?
The short of it is that leveraged positions in an exchange traded note, that were shorting (betting against an increase in volatility or betting for more ongoing low volatility) were forced to sell down and unwind their positions causing sharemarkets around the world to decline. The VIX Index measures volatility. It is just a chart that measures volatility and therefore one could argue the mood of the markets. Of course, the markets are more directly related to prices and investing whereas countries and their economies relate more to a country’s economic wellbeing.
Anyway if you would like to review why it happened just click here to read my recent email.
Meanwhile, back in the land of countries and their economies, 2017 provided the world with synchronised economic growth and real stability across the markets which by the way, was one of the stated objectives of the US Federal Reserve.
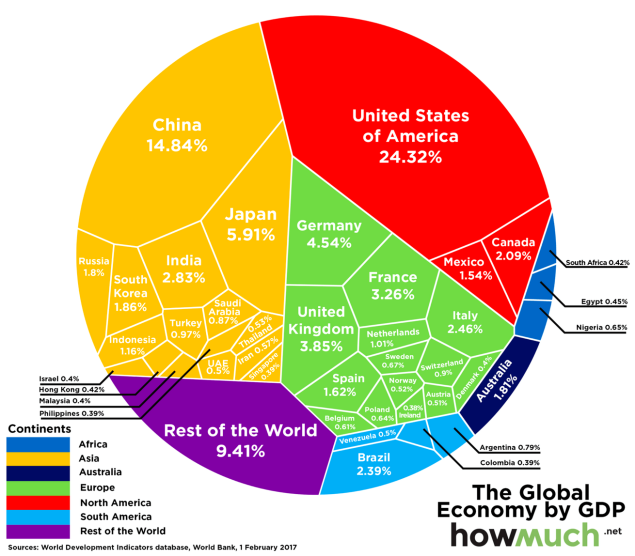
Interesting to see who the largest economies are as measured by economic output. I wonder how different that might look in 10 years from now?
Will the stability and growth continue throughout 2018? Central bankers around the world will be pivotal. Particularly in terms of interest rate rises, by how much they rise and how fast (or slow?).
The International Monetary Fund (IMF) projected in October global economic growth at just under 4%. The change of the US Federal Reserve chair from Janet Yellen to Jerome Powell is worth watching but may have minimal impact. The reforms in China that I and others have talked about over the last few years will be very important to sustainable economic growth in China, which of course impacts on the rest of the world. Brexit and how it continues to unfold remains interesting although the European economy has stabilised and is on an uncertain slow growth path back to normalisation. If the European economy continues to improve and grow, this is one less risk that the world economy will need to contend with. Then of course there is always the possibility of trouble flaring up in the Middle East – another short term risk worth keeping an eye on.
More directly related to investment markets is the possibility of inflation in the US rising faster than anticipated. The recent turmoil in the US which flowed across to other markets around the world is a significant clue that markets are edgy and fragile as they watch the normalisation of interest rates take place in the US and in other economies around the world. The short of it is that higher interest rates may mean slower asset growth and in the shorter term it can even mean declining asset prices.
I mentioned in January that there was no obvious “black swan” and my view remains unchanged. Perhaps a “grey swan” might be rising inflation, wages growth in the US and therefore the possibility of higher interest rates which, in the short term could cause some volatility across markets, not only in the US but also in other economies and markets as well.
Ironically (in simple terms), rising interest rates is a good thing because it signifies economic growth and improving wages which means prosperity. Ironic because investment markets dislike rising interest rates because they take the view that this poses a risk to asset prices and that investing in bonds and fixed interest might be preferable.
I suspect we can look forward to increased levels of volatility and uncertainty over 2018 for investment markets as economic indicators change gears and slow stubborn growth continues to move forward. This in turn may see the US Fed. raise interest rates which may mean some leveraged positions (like we saw with the exchange traded note leveraged against the VIX) are forced to unwind their positions creating pricing volatility. Changing economic indicators will force the hand of large scale investors to adjust their game as they continue to try to outwit other market participants. For us, we of course look forward to that volatility and will be ready with strong levels of cash. Whilst we cannot predict the future, economic indicators and the reaction by markets and their participants give us some clues around when to buy quality assets at good prices – I will be watching …
The United States of America
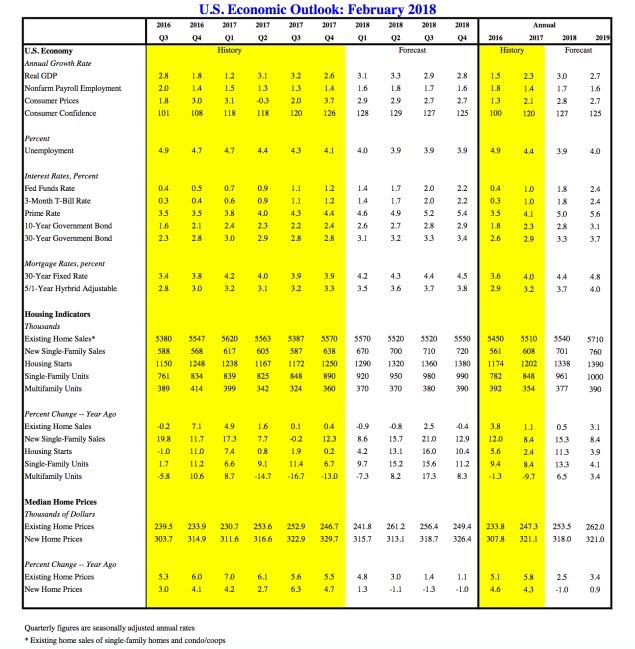
Although the above chart looks just like a bunch of numbers, take some time to go down line by line and take note of the trend across each line.
Volatile markets and the underlying economy at some point are linked. Bigger picture longer term, when asset prices extend well beyond a country’s economic output then the chances are there will be a pricing correction. The first signal is usually the sharemarket. This then can follow on to property markets and ultimately to smaller businesses on main street. Prices currently are stretched however the global economy has been stabilised and remains so. This latest round of volatility across the markets is actually a good thing and indeed required in order to avoid a bigger event in the future.
Looking more closely at the recent volatility and the economy we can see that once again financial instruments, specifically in the form of an exchange traded note that was set up to bet against volatility in the future (a mug’s game if you ask me because 1) volatility at some point is inevitable and 2) no one has outwitted the mindless market long term). The link between the economy and markets this time was the speculators in those exchange traded notes who had leveraged positions that they needed to unwind immediately volatility appeared. Although it is difficult to define, it appears that news out of the US regarding wages growth and the possibility of high levels of inflation that drove 10 year Treasuries slightly higher spooked those highly leveraged speculators and in turn the very index that they were betting against turned on them and spiked in a significant way (see the opening chart page 1). So the linkage if you like in this case is what I believe will be a short lived event whereby speculators have interpreted economic data that made some unwind their position, forcing others to do the same, creating the stampede that quickly followed. Once again, financial engineering, investment instruments used for speculative gains alongside a mindless market came together with provide us with a financial cocktail that was inevitably going to unwind because at some point volatility is a market reality and a certainty. Anyway, back to the Economic Update …USA …
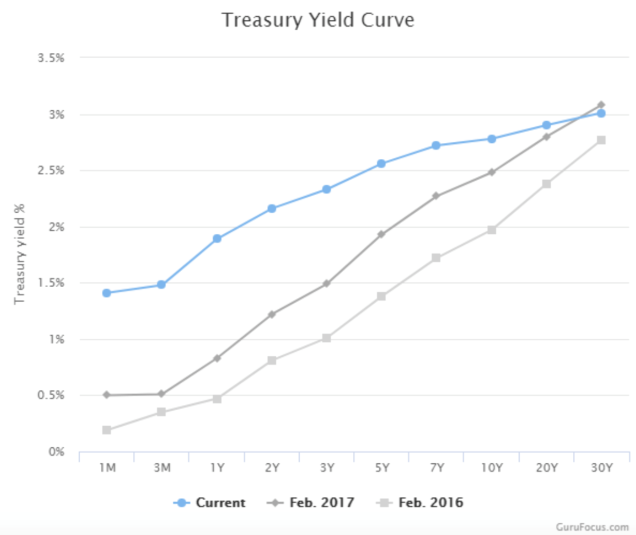
The above chart shows the steady rise in interest rates in the US over 2016, 2017 and where things are at right now (the blue line).
As the above chart demonstrates, interest rates are definitely on the rise however at a slow pace. That’s because economic growth in the US and for that matter globally is quite fragile and slow.
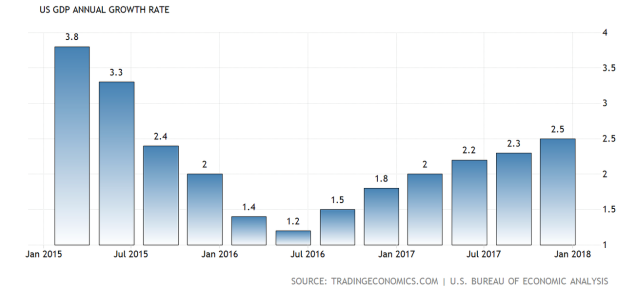
Economic growth in the US is slowly recovering.
Economic growth in the US is slow and fragile but helped in the last quarter of 2017 by ongoing consumer spending. As you may know, consumer spending contributes around 70% to the economy and that (consumer spending) rose 3.8% which helped to support ongoing economic growth. It was notable that the spending on so-called durable goods (expense items that in theory last for three years or more) was strong. Some see an increase in durable goods as a sign that businesses are feeling more confident and ready to spend money and therefore see it as a leading indicator of ongoing growth in the future. However, whilst I am happy to be wrong, I remain cautious about strong sustainable economic growth, although comfortable that the US economy is stable and indeed should continue to grow, albeit at a slow pace in the foreseeable future. Perhaps markets may well have priced these factors in already, however the corporate tax cuts initiated by Donald Trump along with the infrastructure spending, both of which are getting underway, are positive for the US economy. Of course, we all know that the tax cuts comes with a cost to the taxpayer, increasing what is already a significant amount of debt for US citizens. The infrastructure spending on the other hand is a bit more fundamental and an approach that governments in the past have used to help boost struggling economies successfully. After all, efficient and reliable infrastructure is critical to economic growth long term.
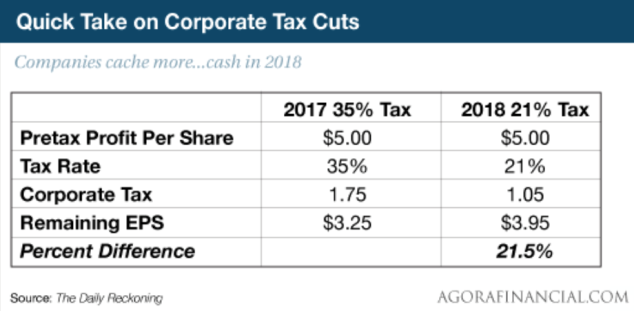
The different tax rate for US corporations is significant.
Tax cuts for US corporations comes at a cost to the taxpayer in the United States, however the idea is that US businesses will spend more money to grow their businesses and in turn continue hiring staff, perhaps pay some of their staff more and by so doing contribute to economic growth. We all look forward to that! However, let’s see how it actually plays out …
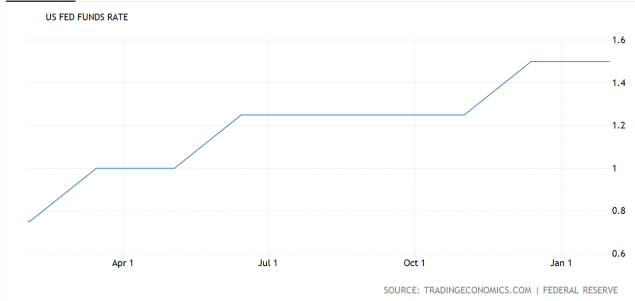
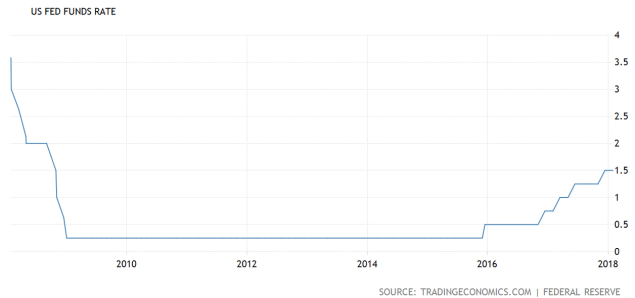
Interest rates move in an upward direction slowly but surely.
Interest rates are strongly linked to asset prices. Interest rates go down, asset prices rise. Interest rates rise, asset prices decline. At least that’s the general rule. The real question for us is how we “travel”. In other words, does the market at some point get spooked and decide (quite wrongly over the long term) that fixed interest and bank deposits offer the best return? Or… is this something that plays out progressively over time without a sudden asset price correction as the central bankers continue to work away at maintaining stability. After all is stability not one of the key pillars of the US Federal Reserve’s strategy?
So, the US Fed. kept its target range for the federal funds rate unchanged at 1.25% to 1.5% on January 31st 2018. However it signalled a rate hike in March is definitely on the table. Inflation, whilst stubbornly low, is expected to rise which may warrant further gradual increases in the federal funds rate.
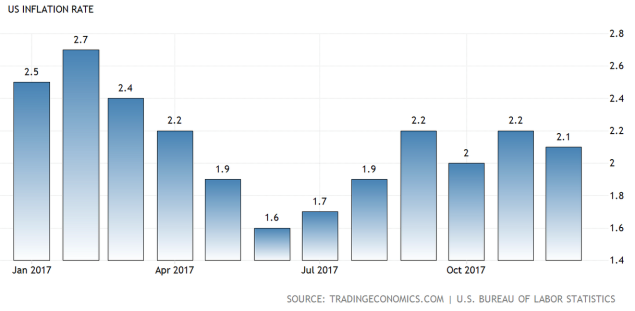
Inflation is running at around 2% which is a bit below where the US Fed wants it to be.
Inflation in the US looks to be running at a reasonable level however some speculators in the market have concerns of increasing inflation which translates into rising interest rates which of course can impact on leveraged positions and equity prices. Inflation therefore is an indicator to keep an eye on.
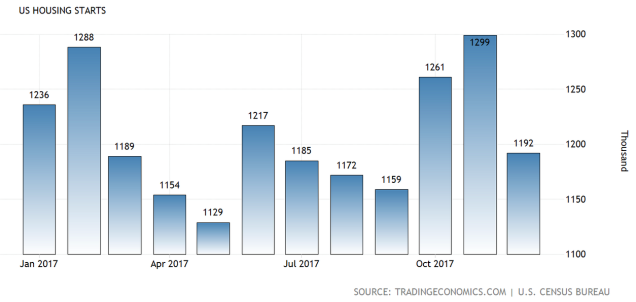
New housing starts in the US continue to roll out.
New housing starts in the US dropped 8.2% month after month to an annualised rate of 1,192,000 in December 2017. This was compared to market expectations of a 1.7% decline and was the biggest drop since November 2016. Despite the drop, housing starts continue to roll out in the US supporting economic growth.
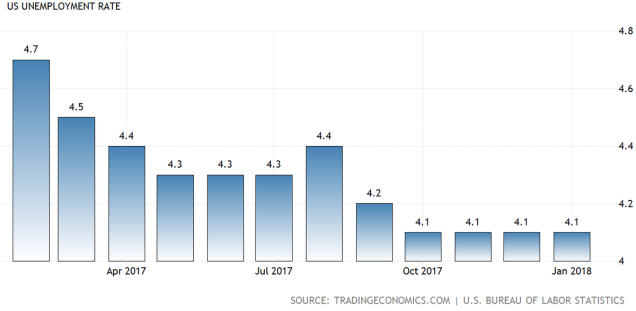
Unemployment appears to be under control but is not flowing through into wages growth yet.
Unemployment in the US stands at a 10 year low at 4.1% (January 2018). As mentioned occasionally in the past, The Phillips Curve does not appear to be working at the moment which has most economists somewhat baffled. Simply, The Phillips Curve suggests that when full unemployment is reached or thereabouts, the next step is wages growth, more spending and an uplift in GDP. I am over-simplifying it but that’s basically it. So far we are not seeing the amount of wages growth that The Phillips Curve suggests should be underway by now already.
Economic buffs will also want to know that the labour force participation rate sits at 62.7% for the fourth consecutive month.
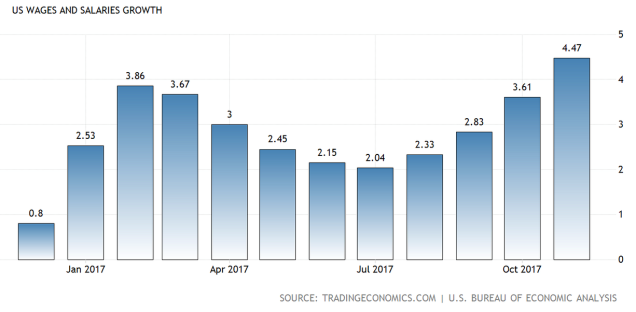
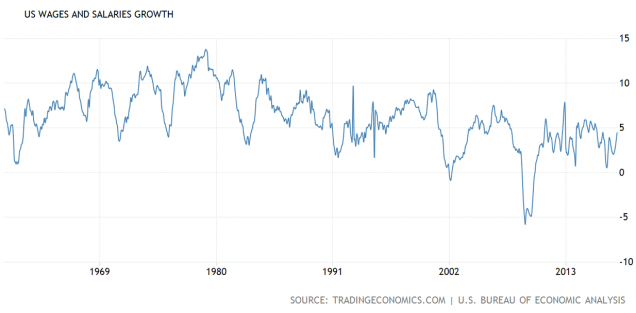
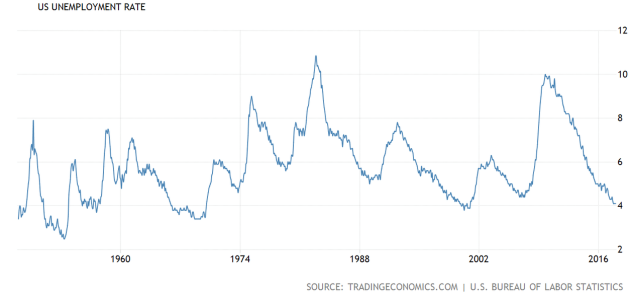
Wages growth is slower than expected but nonetheless we still have growth.
Wages growth started trending down about 1980 (see the chart above) and currently remains lack lustre. Although we will see how it all plays out, it is possible that with an accommodative interest rate environment, corporate tax cuts, infrastructure spending and perhaps more importantly low unemployment and a high participation rate, inevitably pressure on wages should emerge at some point in an upward direction. If and when that happens we have some real fundamental support for the US economy.
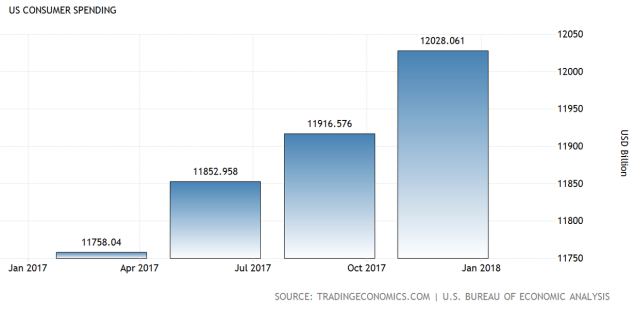
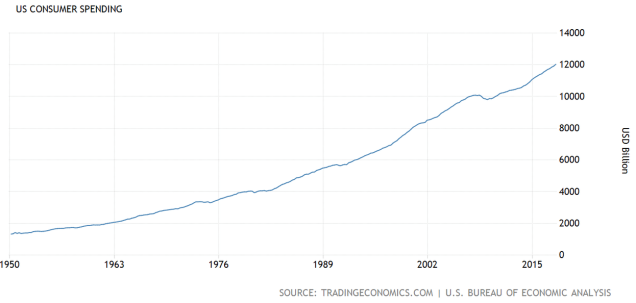
Consumer spending continues – supporting the US economy.
Consumer spending is critical to the US economy. Whilst the US economy I believe will always be resilient and persistent, a small question remains around what impact rising interest rates might have on US consumption. For now it is not a problem….but for how long?
US manufacturing – PMI
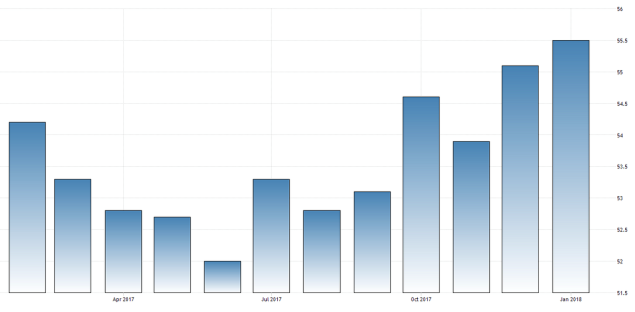
Manufacturing in the US is going well.
The manufacturing PMI number above 50 means growth. The HIS markit US manufacturing PMI was confirmed at 55.5 in January 2018 which was above the 55.1 number in December 2017. This reading highlighted the strongest expansion and factory activity since March 2015 as production and new orders grew the most in 12 months. US manufacturing right now is in good heart. This is useful because manufacturing can be a fundamental driver of economic stability and growth.
Overall, the US economy whilst not exactly booming, is certainly stable and progressing at a slow but steady pace. From an investor’s point of view let’s keep an eye on that inflation number in the US.
China
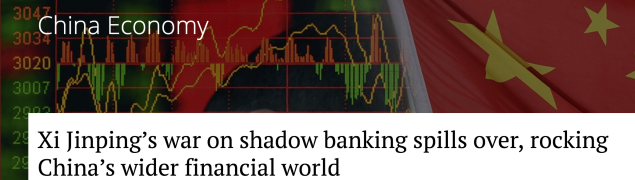
The fact that everyday citizens don’t know about it, don’t understand it, choose to ignore it, does not mean that it doesn’t exist.
China’s shadow banking industry I regard as a potential “black swan”. That’s because of the sheer size of funds involved that basically amounts to significant amounts of loan money of poor quality, waiting for something to go wrong. In 2016 some estimates reported the scale amounting to trillions of US dollars of poor quality loans contributed to around 80% of economic growth in China. Take away 80% of China’s economic growth over night and we have a real black swan.
It is possible though that we may dodge what could otherwise be a significant hazard. The China Banking Regulatory Commission recently moved to ban the practise of entrusted loans (outside the banking system) that should bring an end to this risky but popular form of funding in China. This recent action to ban this lending practise looks like a good step in the right direction. The next step then will be to unwind the trillions of dollars without mishap.
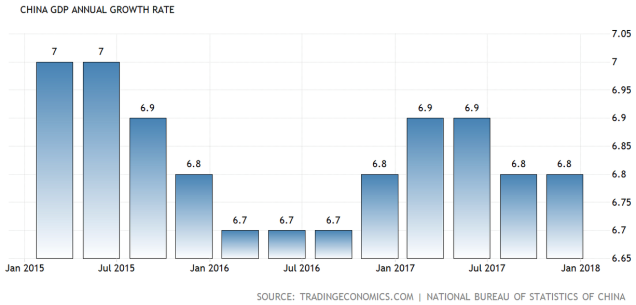
Economic growth in China remains stable.
The point is that the Chinese economy appears to be stable and growing at what is globally a fast pace by comparison however so too does credit growth. For example, outstanding bank loans in China reached 150% of GDP in November 2017, up from 103% at the end of 2007, according to the World Bank in its recent China Economic Update. Strong growth has provided policy makers in China with an opportunity to further advance debt de-leveraging, the result of which is likely to see slower economic growth perhaps in the short to medium term but help to stabilise China’s long term economic outlook. So, the Chinese economy continues to expand, supported increasingly by personal consumption and of course, foreign trade.
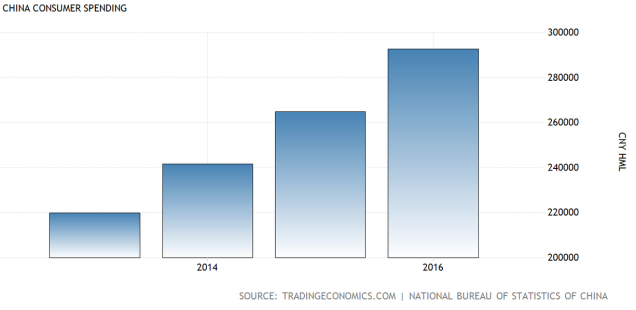
Personal consumption in China continues to grow.
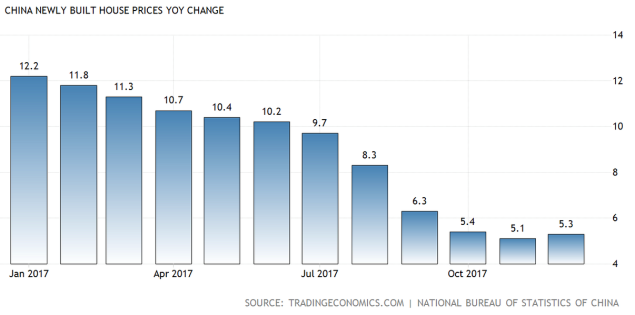
The pace of price increases for Chinese housing has slowed down.
China’s property market is expected to cool off over 2018. It’s a question of whether there are any government policy restrictions that upset an orderly slow down. Recently in China, for example, dozens of local government authorities have passed or expanded restrictions on home purchases by increasing the minimum down payment required for a mortgage (where have we heard that before!). Ultimately those sorts of restrictions can help contain longer term bubble collapses but of course can result in a slow down in the near term too. Anyway, China has already had tighter restrictions on down payments for many years compared to New Zealand and other countries. Perhaps a final point here is that the doom and gloom predictions of a property collapse a few years ago have so far been well out of step.
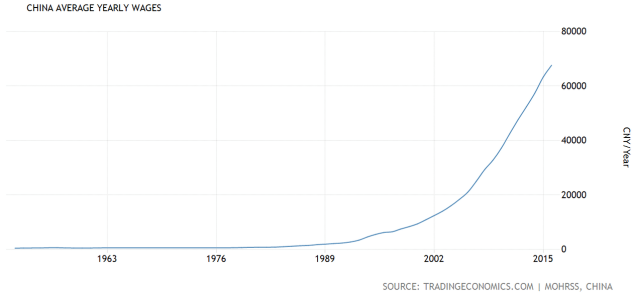
Annual wages in China continue to grow.
Increasing annual wages in China could be a signal that China’s economic transformation from a manufacturing based economy to a consumption based economy is underway. Of course, it’s never a straight line, that type of transformation and there’s a long way to go yet. Interestingly, it coincides with Donald Trump’s desire to “more evenly balance trade” between the US and China.
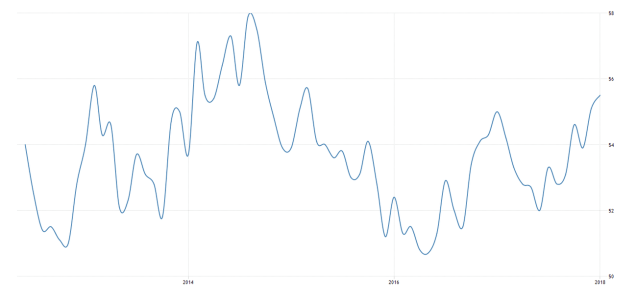
Business manufacturing – PMI
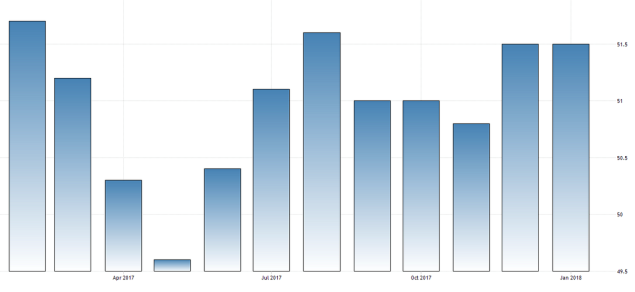
Business manufacturing remains robust in China.
The above chart measures manufacturing activity for small to medium businesses throughout China and therefore offers a real measure of the economy and how it’s going. As you know a reading above 50 represents expansion and a reading below 50 represents contraction. The Caixin manufacturing PMI in China stood at 51.5 in January 2018, unchanged from the previous month’s number and matching market consensus. Although in my view it’s not that much above 50, nonetheless it is a positive reading and certainly the strongest since August 2017 as new orders and new export orders continued to increase.
The Chinese economy overall is tracking okay but is not without risks. The unravelling of the shadow banking industry will be tricky. Also the ongoing slow down in property will have an impact even though it’s a good thing longer term. It will be interesting to watch how the Chinese government deals with Donald Trump and his aspirations for a rebalancing of trade positions …
The Eurozone
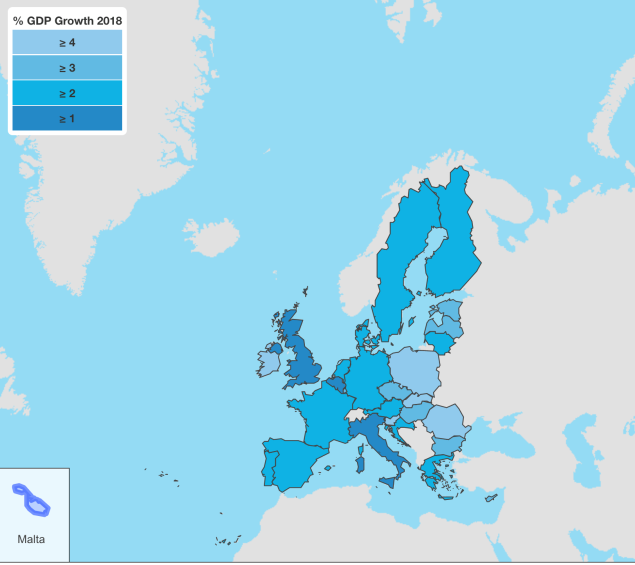
Economic growth projections over 2018. Note the dark blue countries.
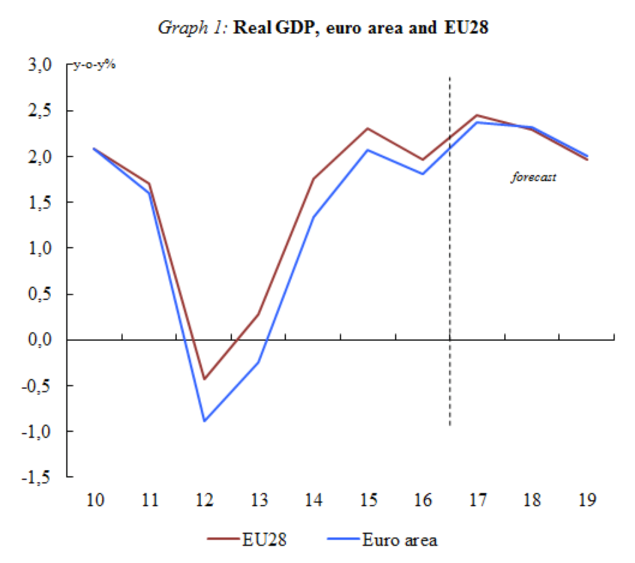
Although slow, economic growth is underway in the European Union.
Economic growth forecasts for 2018 suggest economic expansion of around 2.2% for 2018 and approximately 2% for 2019. This is supported by a continued improvement in labour markets and economic sentiment remaining buoyant. Also the global economy is picking up as well.
Inflation expectations
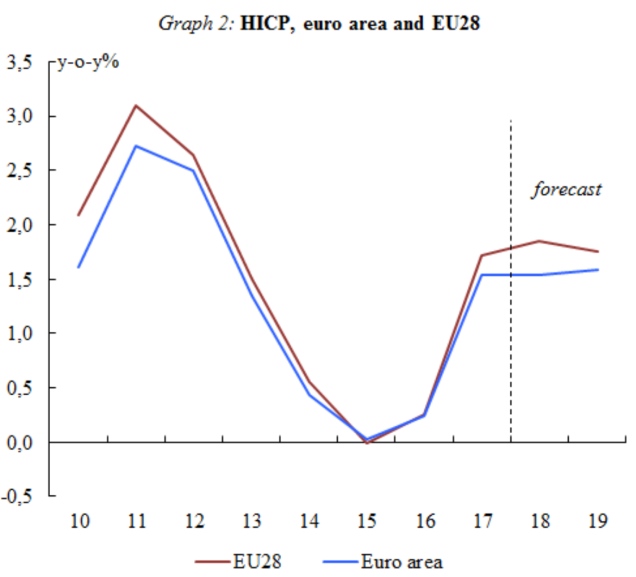
Inflation has re-emerged although at a low level.
Core inflation is expected to remain subdued as wage pressures also remain contained. Energy prices may influence inflation in Europe in the not too distant future and may cause core inflation to rise slightly. Inflation in the Euro area reached 1.5% in 2017, as forecasts remain at 1.5% in 2018 and could potentially increase to 1.6% in 2019.
The European economy has emerged from the deflationary abyss with economic growth underway although slow and fragile. Assuming there are no major shocks or banking failures there is a good chance that economic growth in Europe may continue.
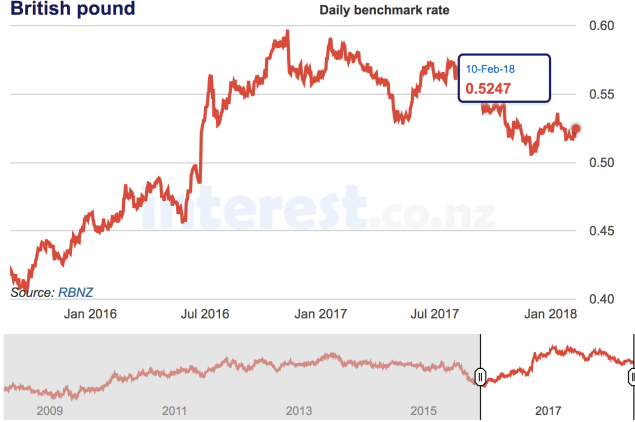
The UK
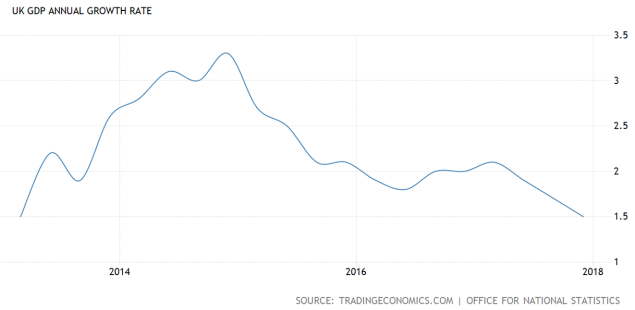
Economic growth continues to decline.
The UK economy grew by 1.5% year on year in the fourth quarter of 2017 which although quite slow did beat market expectations of 1.4%. However this was the weakest expansion rate since the first quarter of 2013. Britain’s economy though has proved more resilient than was forecast prior to the Brexit scenario 18 months ago, helped possibly by improving global economic conditions. The decline in the pound after the Brexit vote has also helped to strengthen exports. Many economists have stated that the UK economy could have performed better without the vote to leave the European Union. Britain’s growth has trailed that of the US, Germany and France. The International Monetary Fund forecasts a growth rate of 1.5% for Britain’s economy this year compared with 2.7% for the US and 2.2% for the Eurozone.
The Bank of England governor, Mark Carney, remains hopeful, recently stating that he thinks the UK economy should begin to “recouple” with the world economy later this year. This he says is based on the idea that the UK will hopefully gain greater clarity over its future trading relationship with Europe as the Brexit negotiations unfold.
Britain’s economy has been more resilient than many expected but is now trailing many other economies around the world as synchronised global economic growth continues. The slow burn for Britain as a result of the Brexit vote continues …
Japan
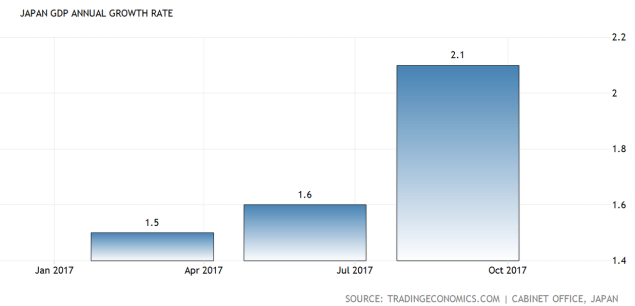
Economic growth in Japan continues to rise.
Economic growth for 2018 is projected to grow by 1.8% year on year in price adjusted real terms, up from a previous estimate of 1.4%, according to the Japanese government’s recent outlook. The Japanese government is suggesting that the economy’s growth through to March 2019 will be led by domestic demand such as capital investment and personal spending. Also on the back of a healthy global economy, Japan’s exports should stay firm.
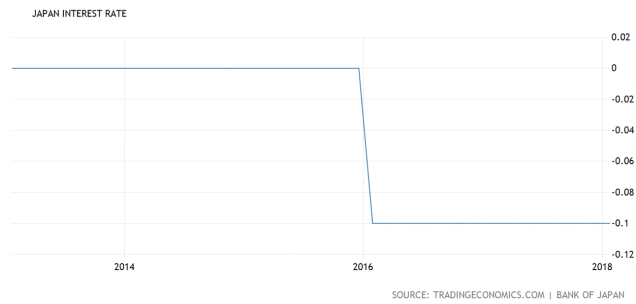
Interest rates in Japan still remain at -0.1%. Still negative.
The Bank of Japan left its key short term interest rate unchanged at -0.1% at its January 2018 meeting as expected. Policy makers also kept its 10 year government bond yield target around 0% but offered a more upbeat view on inflation expectations in the future.
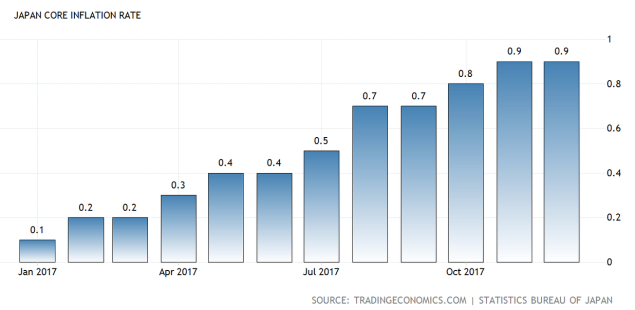
Inflation has increased over the last 12 months but remains subdued.
Japan’s economy looks likely to continue its moderate expansion. Domestic demand should continue, leading to the so-called “virtuous cycle” from income to spending. This will be supported no doubt by highly accommodative financial conditions including the government’s massive stimulus program. There may also be some heightened expectations for growth around the Olympic Games’ related investments coming up in due course. Japan’s economy will also be helped by the ongoing synchronised growth in the global economy.
Japan’s economy continues to struggle but remains stable and although slow, growth is underway but of course backed by accommodative financial measures including that massive stimulus package that remains ongoing.
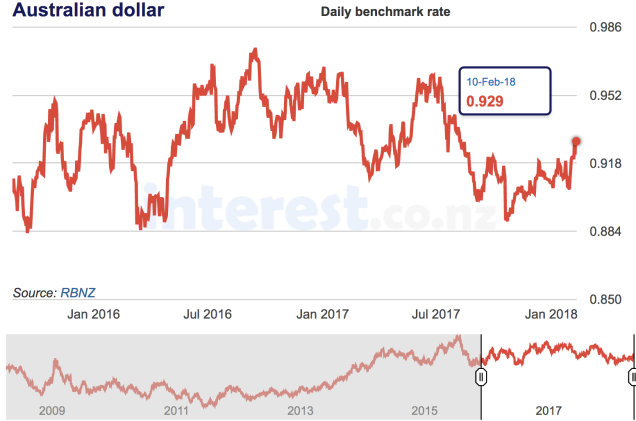
Australia
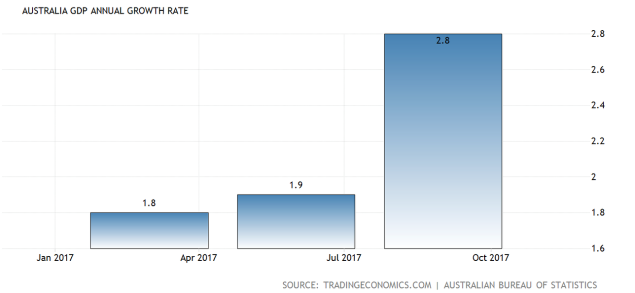
Economic growth in Australia is patchy.
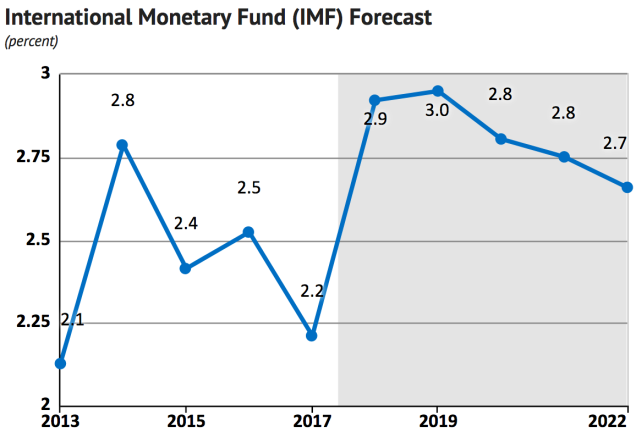
IMF growth projections for Australia over 2018 and beyond.
Economic growth in Australia amounted to 2.6% over 2017 which while not bad, is below the 3% predicted by many economists. Let’s keep in mind that Australia’s fortunes are closely linked to ours because Australia remains one of our largest trading partners, still.
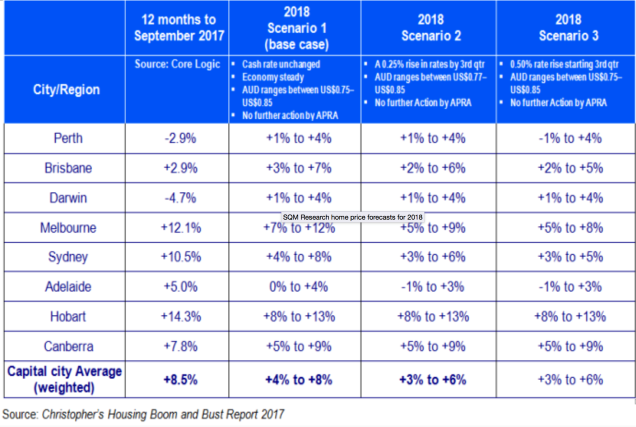
Some interesting scenarios, none of which look that bad.
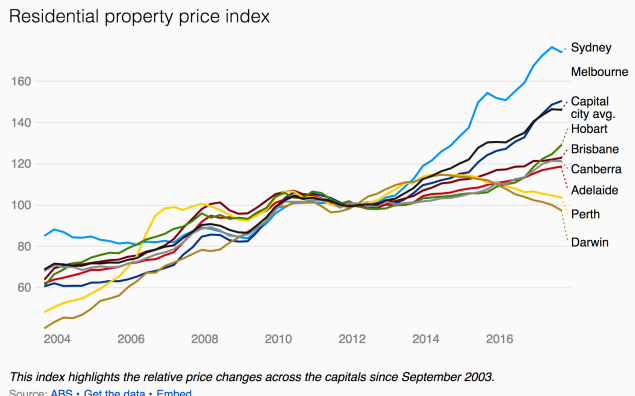
Residential property prices in Australia have responded to ideal conditions (the liquidity bubble, increasing demand for houses) in a similar way to many other cities around the world. Although it will likely take time to play out, interest rates would be an indicator to keep an eye on in terms of its impact on property prices in Australia and also any change in demand for houses. Property prices in Perth look particularly interesting with prices having declined more than in most other centres around Australia. However, this might only make those properties less expensive rather than cheap. Nonetheless it’s an example of an environment where bargains can be found.
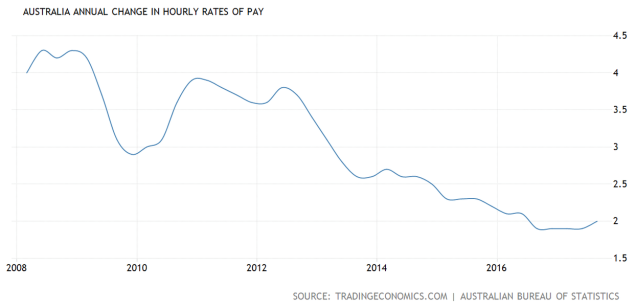
Pay rises for Australians have been declining for many years.
Like many other countries around the world Australia has seen its citizens subject to decreasing pay increases for many years with Australia’s wage rises, stuck around long term lows. Again, this is important because Australia will need wage growth to help underpin economic growth across the Australian economy at some point. As I mentioned earlier, this also matters because Australia is one of New Zealand’s major trading partners – still.
The Australian economy is tracking okay however economic growth is patchy and the outlook is for further subdued growth.
New Zealand
Dairy auction price
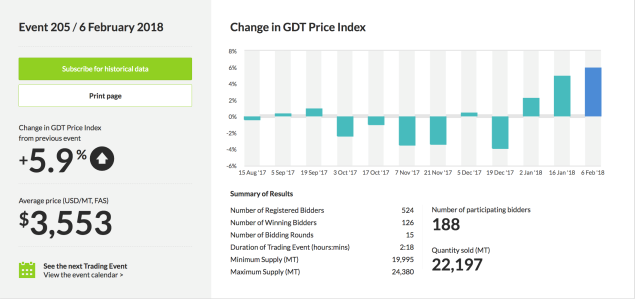
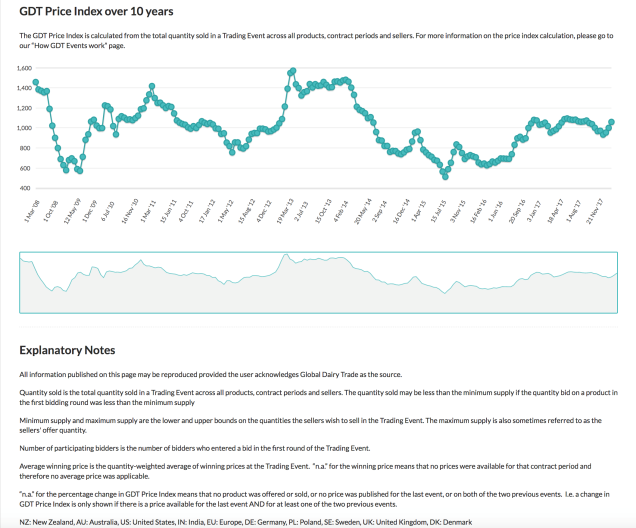
Prices recovered recently, supporting the upward trend from the low of July 2015.
After what seemed an ongoing slide over the last three-quarters of 2017 dairy prices rebounded over January up 5.1% month over month. Dry conditions and slowing New Zealand milk supply appears to have supported the uptick in prices. Whilst dairy led the decline in prices (-5.6% month over month) other commodity prices also slipped towards the end of last year as well.
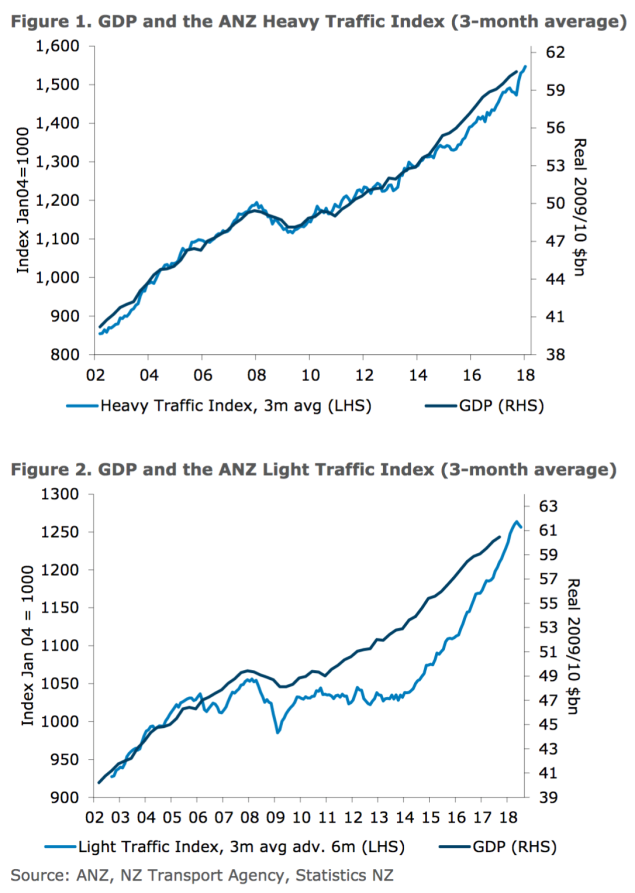
The truckometer offers some clues as to where economic growth is heading.
The Truckometer Heavy Duty Index fell 4.4% in December (seasonally adjusted), while The Light Traffic Index eased a further 0.5% month over month (charts are three month average). Both Indexes are positive with regard to fourth quarter growth however The Light Traffic Index is showing a slightly softer signal for growth for mid-2018.
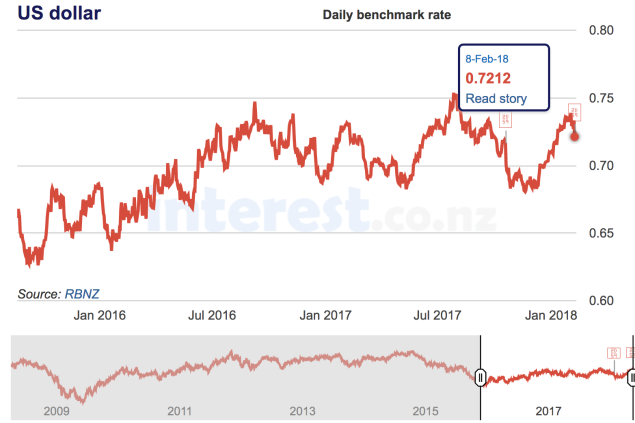
Interest rates
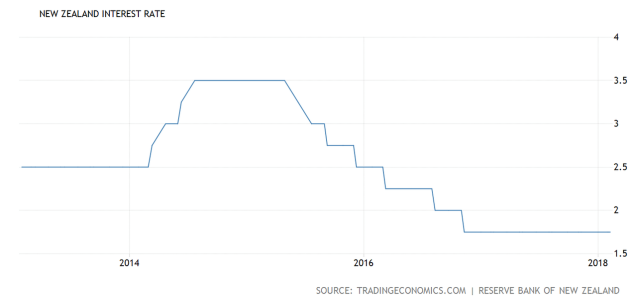
The official cash rate remains on hold at a record low.
The Reserve Bank of New Zealand kept its official cash rate unchanged at a record low of 1.75% on February 7th 2018 – as expected. The central bank continues to state that monetary policy will remain accommodative for a considerable period given numerous uncertainties that remain. Inflation is one of those concerns with consumer prices increasing 1.6% year on year in the fourth quarter of 2017, which was below market expectations of 1.9%. This reading was the lowest quarterly inflation number in 12 months. Although economic growth in New Zealand has eased a bit over the second half of 2017, the expectation is that this weakness will firm up a bit. Also the Reserve Bank governor will be watching the global economy which continues to undergo synchronised growth somewhere between 3.5% and 3.75%.
Residential property
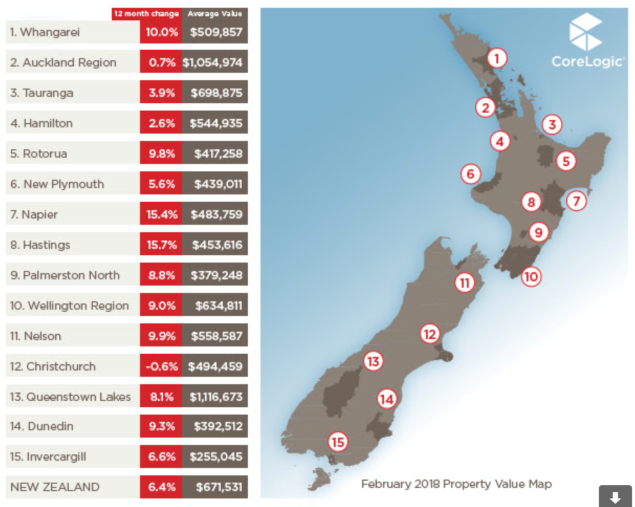
Housing prices continue to moderate with Christchurch remaining slightly in the negative.
House prices in New Zealand have broadly followed the trend in other countries around the world. Ideal conditions have seen property prices rise strongly over the last 30 years or so. Looking ahead, interest rates along with demand for housing might be two indicators to watch. Although there is nothing on the horizon that I can see right now, it is interesting that conditions have been so favourable for residential property prices for so long. Statistically, a change in conditions is inevitable at some point. For now though property prices are reasonably stable and it is interesting to note the varying results in the different centres around New Zealand. It looks as though interest rates might be accommodative for much of 2018 although let’s not forget that the global economy is picking up steam and the Reserve Bank will be watching this closely. That’s important because it translates into, at some point, a less accommodative interest rate stance from the Reserve Bank. For now though they are talking rates on hold for most if not all of 2018 and part the way into 2019. Time will tell …
To Summarise …
Markets and economic conditions are linked at some point and often in an untidy fashion. The recent bout of pricing volatility across global sharemarkets is a good example. Economic indicators spooked those speculators with leveraged positions that were inevitably going to have to be unwound. It appears that the speed at which this was required surprised even those leveraged speculators attempting to outwit a mindless market!
Synchronised global growth remains in place across the global economy. New Zealand’s new government has not yet had the opportunity to do much however the 100 day plan is well and truly underway. Inevitably though, the change in government will impact certain sectors rather than overall economic growth long term.
Anyway, economic conditions are stable and at least at this point in time it looks as though this stable environment will continue – at least for now.
For those who prefer pricing stability then this will be useful.
For others of us who would like to see some more volatility, synchronised global growth will help underpin the growth in expanding businesses but provides less in the way of opportunity to take advantage of better pricing.
Not to worry though … there will be something significant at some point that will give us better pricing opportunity …
“An economist is an expert who will know tomorrow why the things he predicted yesterday didn’t happen today.”
Laurence J. Peter