Delta vs The Global Economy and Your Investments
Monthly Market and Economic Update – September 2021

Peter Flannery Financial Adviser CFP
“If you have one economist on your team,
it’s likely that you have one more than you’ll need.”
Warren Buffett
Key Points:
- What is the Chinese Communist Party up to and why is that relevant?
- How expensive are share market prices?
- What about September and October and the markets?
- Are interest rates rising?
THE MARKETS
Is the CCP (Chinese Communist Party) crackdown dangerous for us?

The Chinese Communist Party has implemented a serious crackdown on large tech companies in China, sending their trading prices quickly and significantly downward, but that’s not at all.
They have implemented other initiatives such as rationalising the education industry across China, limiting how tech companies can set up algorithms and other measures.
At first look, it would appear that the Chinese government is looking to bring those tech companies and indeed, capitalism in China down to its knees, as though they intend to revert to the ways of old where capitalism was virtually non-existent in China.
Although others may have a different view, the sense I make of it is that the Chinese government, in general terms is looking to the collective good rather than isolated excesses which can be part of the capitalist landscape.
As the old cliché goes, the rich get richer and the poor get poorer. That, of course, is a big generalisation. However, there is significant opportunity in the capitalist world for those willing to go after opportunity.
In New Zealand, we have the Labour party and the Green party to ensure that none of us become too wealthy! Still, there is some good in what both parties do, even if it has little to do with advancing an industrious society that progressively strengthens its financial well-being.
Whilst I’m simplifying it here, the crackdown on tech companies was, to some degree based around privacy concerns (a bit like Donald Trump in the US government a while back).
I read somewhere recently that the Chinese government has banned large tech companies from setting up new servers and information banks without first applying to the Chinese government. My understanding is that the Chinese government wants to set up those servers and control the information. That’s a bit anecdotal but an interesting facet of what is unfolding in China.
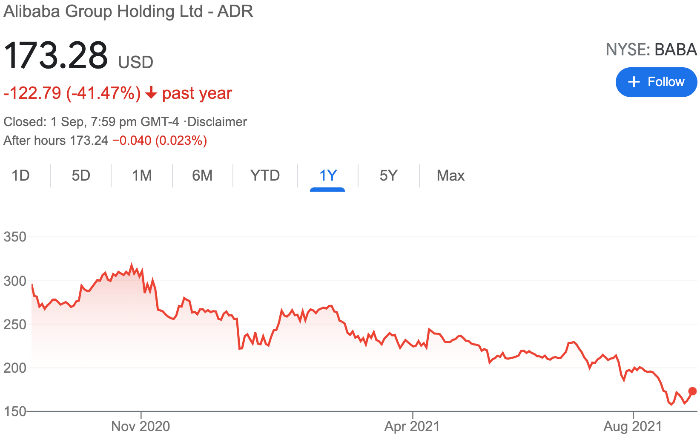
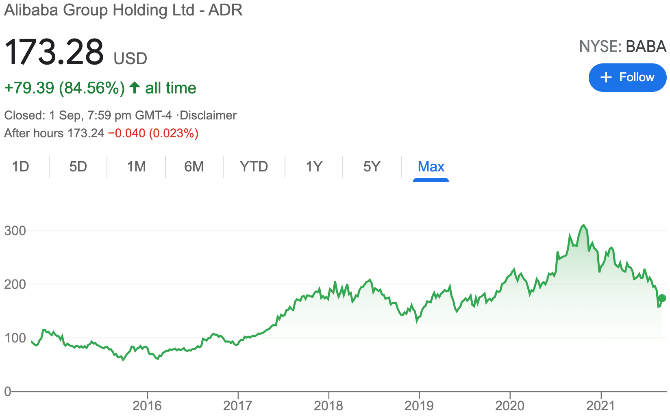
The graph on the left tracks the trading price of Alibaba over the last 12 months. The graph to the right tracks the trading price of Alibaba since listing on the NYSE in September 2014 at an opening price of US$92.72 cents.
This is a significant event for Alibaba and other tech companies in China but by no means a deal-breaker for the underlying business which remains sound, although somewhat challenged in the short term by the crackdown from the Chinese Communist Party.
This raises the point about the short-term versus the long-term.
I believe the Chinese Communist Party is taking a long-term view for the greater good of the Chinese economy and the people and are not put out at all by the inconvenience for the large tech companies, nor the founders of these organisations, many of whom have become billionaires over the last decade or so.
For the likes of Alibaba and a number of other well-positioned tech companies in China, whilst this may impact in the short-term, they remain well-positioned where there is strong business economics at play. Alibaba is a good example.
What about America?
What’s happening in America?
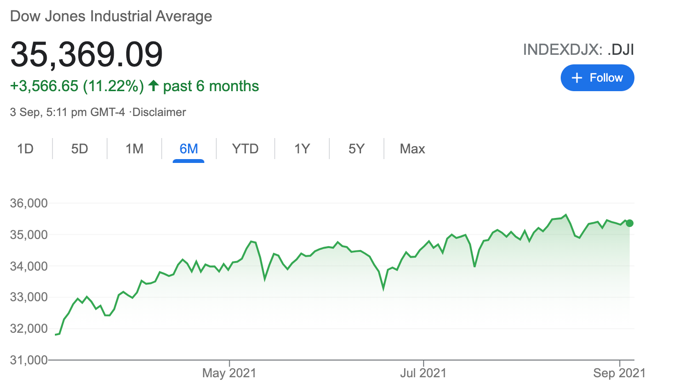
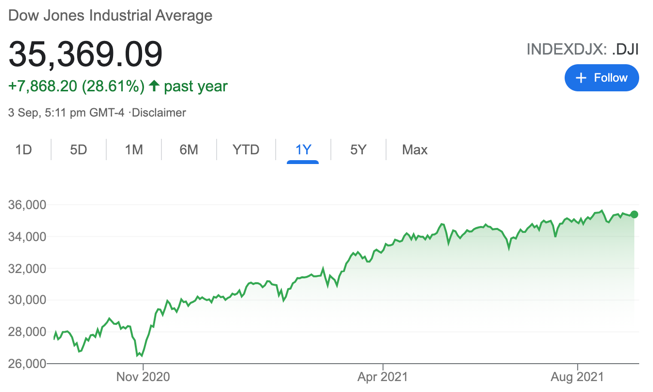
The chart on the left shows the US share market (the Dow Jones) over the last six months. The chart on the right shows the US share market (the Dow Jones) over the last year.
Having been involved with markets and investing for a number of decades, I can’t remember a time when the US share market traded at an all-time high so often for so long – ever.
Does that mean that we are riding from a massive fall?
Or does it mean that markets are engaged in a transformation?
Market valuation
In short, markets are expensive, so trading at all-time highs sounds about right in that situation. The challenge we always face can be the fact that markets are random and difficult to predict. That’s not too much of a problem if you invest in the business rather than the stock. That way, you’re not suffering anxiety about markets and unexpected movements up or down when the market receives the unexpected news that it doesn’t like.
The reality is that expensive markets do not necessarily translate into an immediate share market crash. This we know because markets have arguably been expensive for at least the last decade or longer.
Depending on who you listen to, the Dow Jones price-to-earnings ratio (P/E) ratio sits at around 24, which is expensive but not bubble territory. For example, the P/E ratio across the Dow Jones was about 40 during ‘the tech wreck’ in 2000.
At the same time, boring old value investors prefer a P/E ratio of around 10, making 24 expensive. It’s expensive too when you consider the historical average P/E ratio across the Dow Jones is somewhere between 15 and 18, making the Dow Jones (the American share market) expensive but nowhere near bubble territory.
However, when we look at another measure, such as the American share market compared to economic growth as measured by GDP, by that measure, markets look much more expensive. In short, trading prices have got away from underlying economic growth. The Buffett Index by the way, is based on the comparison between trading prices and economic growth.
The emergence and spread of the Delta virus across the US and other countries has caused some concern from time to time for markets, although not for long.
Whilst everyone knows the Delta virus is tricky, markets so far have mostly shrugged it off, focused on other things.
Technology has helped a lot over the last year or so whereby, for example, people can work from home.
Central banks have supported economies around the world so that generally, trade, commerce, and everyday activity continues to a large degree (admittedly, it’s not perfect for everyone).
Interesting to note that, according to the Case Shiller Home Price Index, residential property across America was up 18.6% over the last 12 months (where have we heard that before!?), which helps underpin confidence in the market.
Interestingly, the Chicago PMI (Purchasing Managing Index) slipped to 66.8 compared to last month’s 70.4.
This is still quite good when you consider that a score above 50 means expansion. So, from that perspective, this measure shows solid progress in the US economy. I mention it because the economy supports the share market and trading prices at the end of the day at some point.
This one measure alone does not mean the American economy is booming but indicates that economic recovery is underway.
Inflation?
The inflation debate continues with regards to whether or not it’s transitory or permanent. I remain in the transitory camp, although I accept that working out where inflation is heading is complex. Also, as I’ve mentioned elsewhere, I believe we will see other inflationary pressures emerge that may be more permanent, such as wages growth.
Anyway, this brings us to the recent Jackson Hole meeting where the US Federal Reserve Chair Jerome Powell advised that they will be looking to taper (take back some of the money they put into the US economy over the last couple of years) possibly before Christmas.
Interest rates?
However, he said interest rate increases remain a way off yet. This I take to mean 2022 at the earliest. Of course, nothing is set in concrete. However, that’s how things look at the moment.
The Global Economy
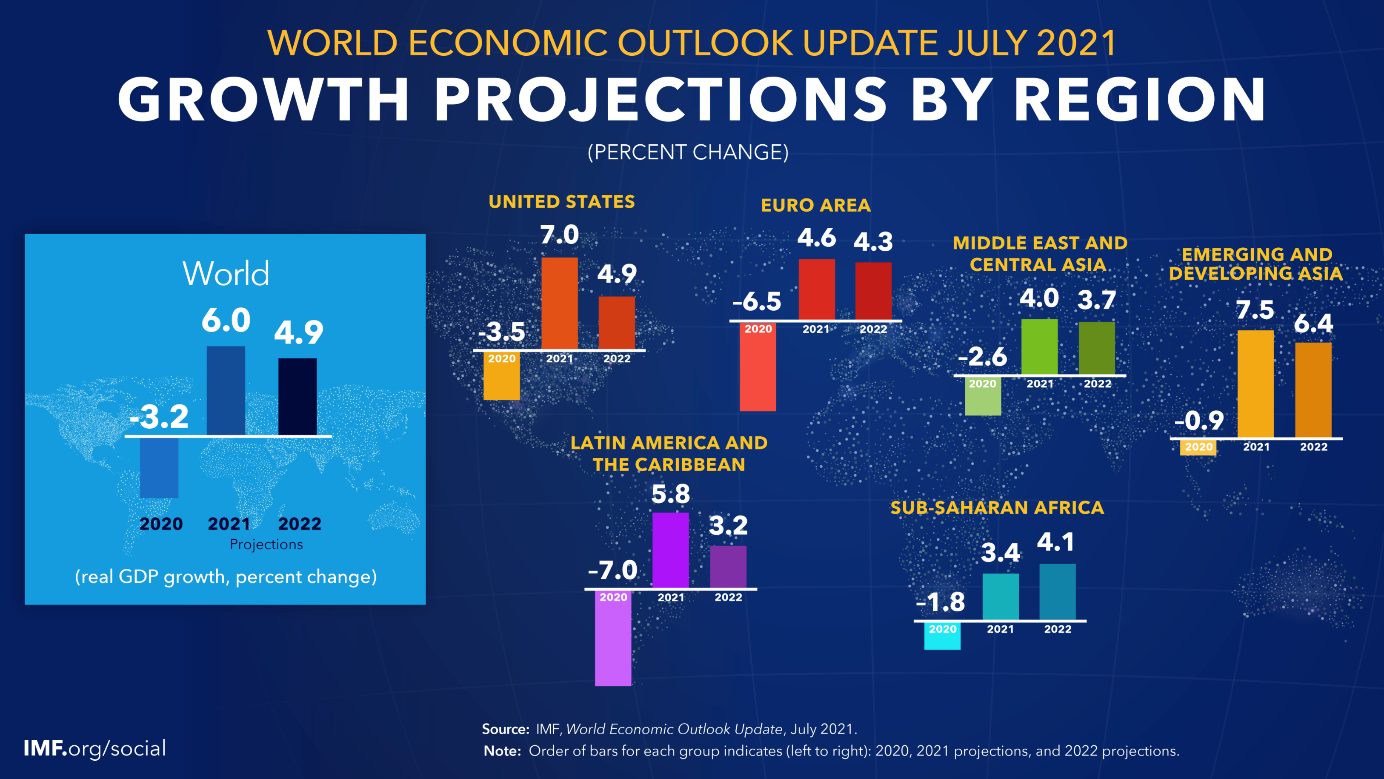
The above diagram shows economic growth over 2020 with projections for 2021 and 2022 across a number of regions around the world.
The global economy continues to emerge from the coronavirus pandemic recession. The concerns that many of us held regarding the mutation of the original virus has materialised.
We are now facing off against the Delta virus, which has proven to be more infectious and more difficult to combat.
Still, with central bank support and the rollout of vaccinations (I know some don’t agree with vaccinations), humans are adaptable while the coronavirus is putting up a good fight. Humans have an edge at the top of the food chain above other animals.
Just quietly, the digitisation of the world we live in is a game-changer for us as a human race too.
Anyway, as usual, those more developed countries with a more sustainable economic base will likely get through this economic event in better shape than some emerging economies that are still developing.
The Faultline!
The World Health Organisation (WHO) referred to vaccine access as a principal Faultline. Global economic recovery is split into those developing economies that benefit from the vaccine rollout and other economies that may suffer ongoing infections, severe stress on their hospital systems and rising death tolls. The bottom line is that none of us is safe until everyone is immunised, whether naturally or by way of the vaccine.
Global economic growth
According to recent updates, global economic growth projections in April of 6% for 2021 and 4.9% for 2022 remain unchanged. This is encouraging. Looking more closely, this looks like a slight upward revision for developed economies and downward revision for developing economies.
Global inflation?
Thinking about global inflation, there appears to be an ongoing spike due to supply/demand mismatches, which could dissipate over the next 12 to 18 months. Inflation is difficult and complex to project. However, it looks as though, all things equal, inflation may return to pre-pandemic levels in due course. Over the next several months, we might know whether these transitory inflation spikes around the world continue to persist and whether central banks require other action.
Containing delta
One clear risk is a slowing down or delays in the rollout of vaccines globally. This could result in deteriorating forecasts and slower emergence from the recession pandemic. That is potentially bad news for those emerging and developing economies and, to some degree, for the rest of us too.
In addition to the economic damage, the real risk here is that a slower rollout of vaccines might allow the Delta virus to mutate into something else that will likely be more difficult to control and possibly more deadly.
Market risk
As mentioned elsewhere too, if inflation, particularly in the US, becomes persistent (less transitory or new inflation drivers emerge), the US Federal Reserve will need to tighten monetary policy sooner than expected, disrupting markets.
Simply, the cash-up value of our portfolios in that situation would decline a notable amount (don’t panic though, price and value still are not the same thing). Fluctuating market prices are normal.
Anyway, clarity and clear direction, particularly from the US Federal Reserve Chairman Jerome Powell will be important for markets if inflation persists. That clear direction may mean less disruption for markets.
The United States of America
Boosting the US Economy – spending plans
The American government is looking to implement two initiatives to help support the less well-positioned in the US economy as well as support economic activity and growth. These two specific initiatives are the American Jobs Plan (AJP) and American Families Plan (AFP).
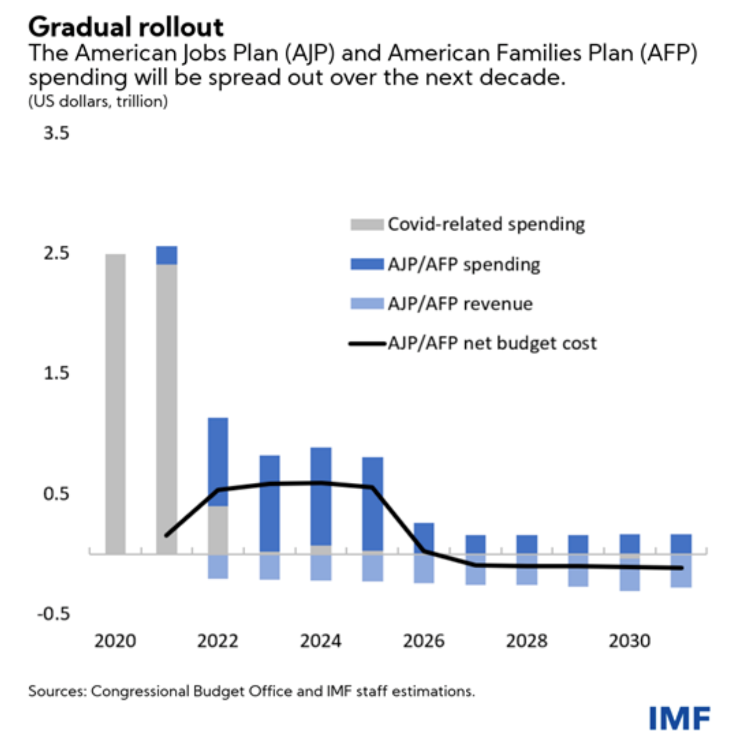
The above bar chart tracks the projected rollout of the American Jobs Plan and the American Families Plan over the next 9 years.
The AJP and the AFP are projected to increase spending and tax expenditures by around $4.3 trillion over the next ten years or so (which equates to about 18.7% of 2021 GDP).
It’s still under negotiation; however, what’s important is that this expenditure will be partly financed by raising taxes on corporates and increasing income tax for high-income households.
This is interesting because whilst raising tax can generate revenue, it tends to be a bit of a handbrake for an economy, depending on how the increased tax rates are implemented. Increased tax means less profit which can mean slowing down investment by large businesses.
As for high-earning individuals, the reality is that there just isn’t that many of them. The amount of tax collected here, therefore, is unlikely to make much difference. It is mainly a nice sounding (political?) idea.
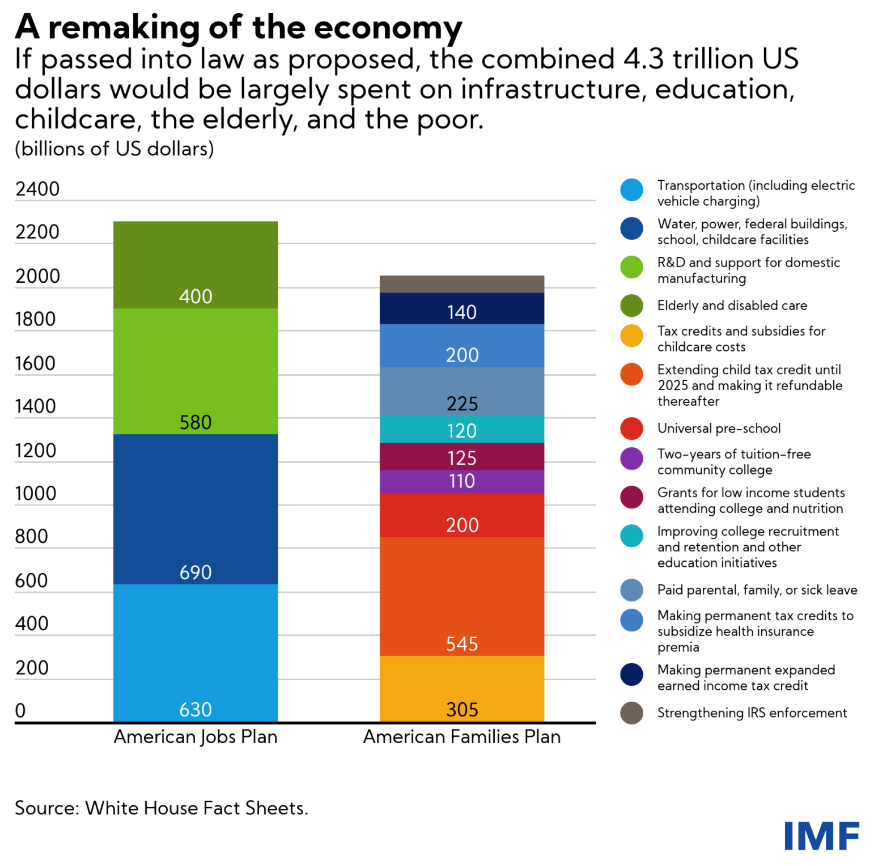
The above chart shows how the proposed US$4.3 trillion boost to the US economy will be applied.
So, the purpose of this spending is to stimulate economic activity and boost economic growth. The International Monetary Fund (IMF) has estimated that the AGP and AFP may add a cumulative 5.3% to the level of economic growth as measured by GDP over 2022 – 2024, as the spending ramps up over the next few years.
In the chart above, you’ll see different types of government spending, with some having more of a multiplying effect than others.
For example, cash transfers to households such as for the children’s tax credit, are more likely to boost spending in the economy. Childcare support on the other hand, may increase parent participation in the labour force. Some good analysis has been done on this model. However, it still needs to get across the line (both houses in the Senate need to agree).
As you know, there has been a spike in the inflation rate in the US. The rollout of these measures outlined above may add somewhat to inflation pressures, although there remains the expectation by the US Federal Reserve that the current inflationary pressures are transitory.
Anyway, these initiatives (assuming they get through ‘the house’) are to be rolled out over the next decade, which should alleviate immediate inflation pressure.
The current inflation projection suggests inflation may be in the vicinity of 2.5% by the end of 2022. America has a sufficient economic base to implement both of those spending plans. That said, there will need to be other additional steps in the mix somewhere to help bring down public debt.
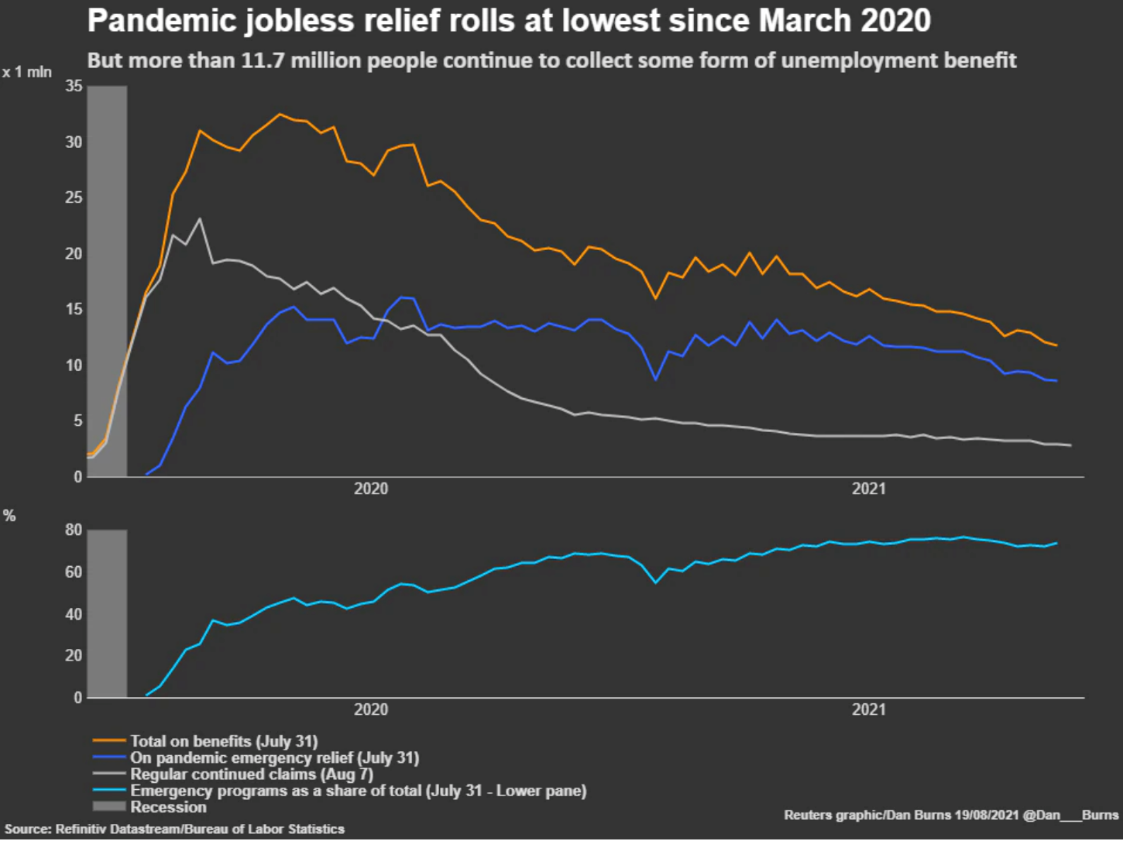
The above graph tracks the decline in benefit and relief payments over 2020 and 2021.
The US economy created a significant 943,000 jobs in July this year. The number of people continuing to receive benefits after an initial week of support dropped 79,000 to 2.8 million at the week of the 7th of August 2021. The point here is that this is the lowest level since March 2020.
So, unemployment continues to decline.
However, a significant number of people still remain unemployed. This is partly why the US Fed has not initiated tapering before now. As stated elsewhere, though, Jerome Powell and others in the US Fed (some have a strong voice around this point) are looking to initiate tapering before Christmas.
Indeed, one voice within the Federal Reserve suggested immediate tapering, all of which should be completed by March 2022. However, I believe that is highly unlikely.
Under the leadership of Jerome Powell, the US Federal Reserve has performed admirably, maintaining transparency and an even approach to maintaining market stability.
China
The coronavirus still causing problems.
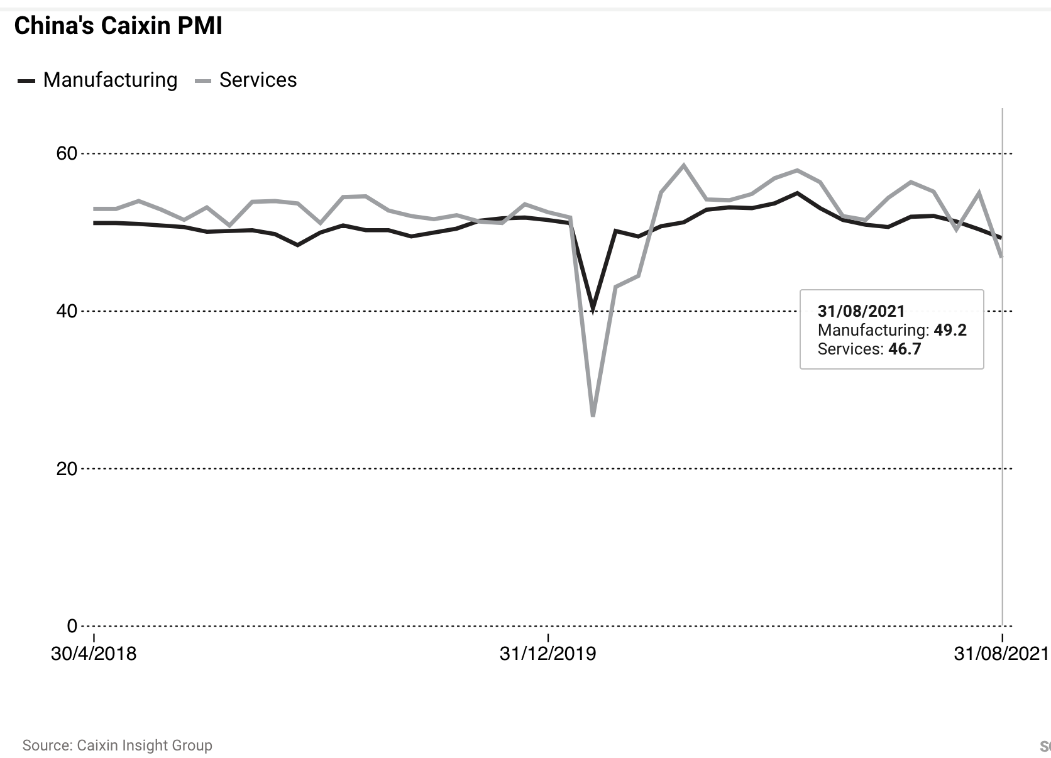
The above chart tracks activity in manufacturing and services across China.
Although China’s economy has performed well over 2021 after effectively containing the coronavirus in 2020, recent flare-ups have created problems in some areas. Notably, the services sector has been affected recently by lockdowns which have been implemented to help contain recent outbreaks in certain areas of China.
Some reports from the popular media has portrayed this as a derailing of the Chinese economy – not at all. Obviously, with lockdowns, some services will not operate, and this will see a decline in services activity. It’s only to be expected.
Ultimately, these lockdowns will help China to get on top of the virus, so that those services can reopen once again and continue to trade – hopefully staying open for the long-term.
The Caixin Market Services PMI fell to 46.7 in August from 54.9 in July. That is a direct result of those lockdowns. This is on top of an early report showing China’s official non-manufacturing purchasing managers index fell to 47.5 in August. As you know, a reading below 50 means contraction. Not ideal however it is only one month’s data. One month’s data is not a trend.
China’s headline economic growth slowed down to 7.9% in the second quarter of this year (year on year) after hitting 8.3% in the first quarter. Although, of course, it was from a very low base.
A while back, Beijing announced they were looking to double China’s GDP by 2035; however, more recently, it appears that policymakers might be looking to address social issues to ensure social fairness and justice.
This is partly why we might be seeing the crackdown on large tech companies. Although it’s difficult to know for sure, there are some concerns that China is possibly returning to a more nationalised economy that favours stability and protected state enterprises. It would seem to be several backward steps given what’s been achieved across the Chinese economy over the last 20 years.
On another note, Chinese president Xi Jinping recently announced plans to set up a new Stock Exchange in Beijing to expand China’s role as a global services hub – interesting.
He also mentioned in a recent speech that he’s looking to establish free trade zones with China that could help global economic recovery.
Traditionally we think of the likes of New York and London as international financial hubs; however, with advances in technology, who’s to say that China cannot set itself up as a global hub, certainly for Asians initially and its trading partners?
Xi Jinping talks about working with all sides for the greater good. However, amongst all that, I wonder if the underlying agenda is also for China to be less reliant on the global economy and more self-contained?
Of course, the bottom line is that China matters to the global economy and any slowdown in China would impact international trade.
China also has the world’s second-largest services economy. Services exports grew 23.2% to ¥1.34 trillion (US$ 207 billion) between January and July this year compared with the same period last year.
In the same period, imports declined by 4% to ¥1.47 trillion, according to the information released by the Ministry of Commerce recently.
The Chinese government’s push to reduce China’s economic reliance on exports to services is slowly unfolding.
Chinese service sector output reached ¥29.6 trillion (US$ 4.6 trillion) in the first half of this year or 55.7% of GDP compared to last year, where this figure stood at 54.5%. Not much difference but is evidence that this number is tracking in the right direction as far as the Chinese government is concerned.
China needs to trade with the rest of the world; however, it has become more vocal.
They’ve been suggesting for a while that China will be working hard on developing strong trading relationships (e.g. the Belt and Road Initiative) and reducing its reliance on trading with certain countries in the world (e.g. The United States of America and some of its allies).
Although difficult to gauge at this point, the slowing down of trade with other countries like the US will impact some countries and some specific industries more than others, as China continues to focus on its goals, as always taking the long-term strategic view.
The United Kingdom
Freedom day (!)
Freedom Day in Britain was on the 19th of July 2021, when the government opened up the economy and appeared to move away from lockdowns.
The Brits had been in lockdown for a lot of 2020, as you may know. On the other hand, here in New Zealand, we’ve also had some lockdowns but with a much-reduced duration.
By comparison, Kiwi’s have been relatively free roaming.
I remember when the 19th of July arrived, thinking that this could be a huge mistake given all the mounting data about how transmittable the Delta strain had become. There were a significant number of letters to the Prime Minister protesting the opening up of their economy. In short, Boris Johnson and his political party have taken a significant gamble that the combination of lockdowns to frustrate the virus, vaccination rollout and other measures will be enough.
New coronavirus cases
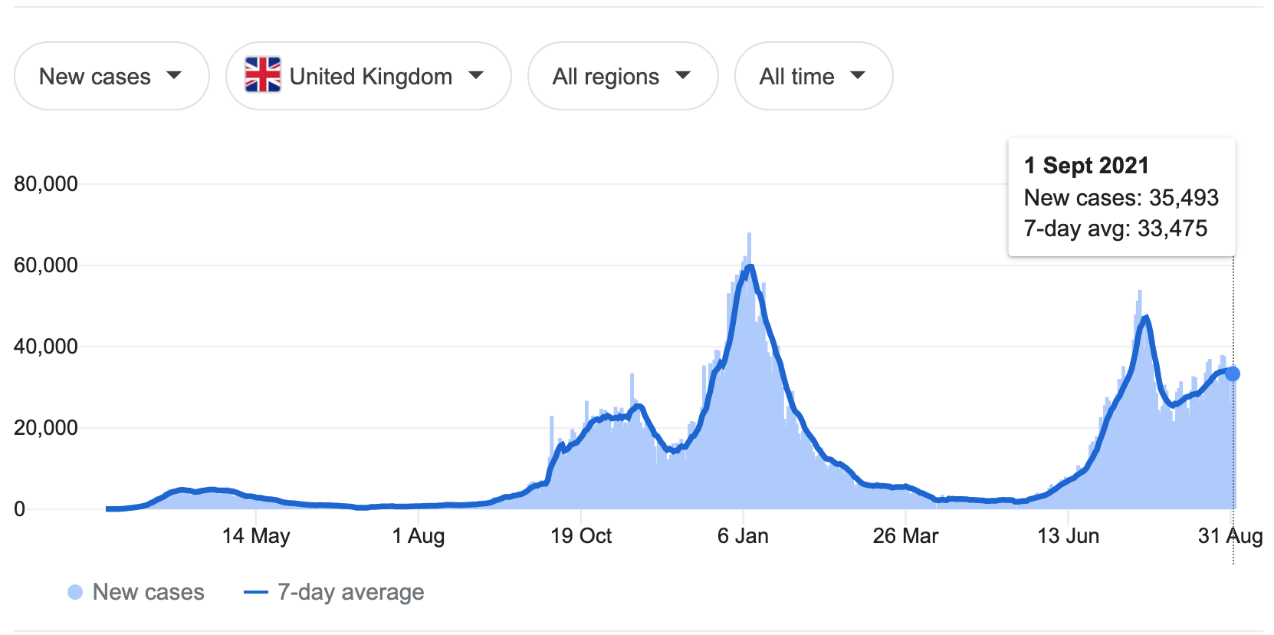
The above graph tracks the number of new coronavirus infections across the United Kingdom.
Look closely at the graph above, and you’ll notice the peak in cases after the 13th of June. Interestingly, that peak is right on or close to the 19th of July (Freedom Day).
Then, contrary to popular belief and to the surprise of many (myself included), you can see how the number of new cases falls away. Although it’s not shown in the graph above, if you look at where the lowest point is after the peak (between the 13th of June and the 31st of August) the number of new cases dropped to 21,687 on the 2nd of August 2021. As you can see, though, since then, case numbers have started to increase again.
Percentage of the population vaccinated
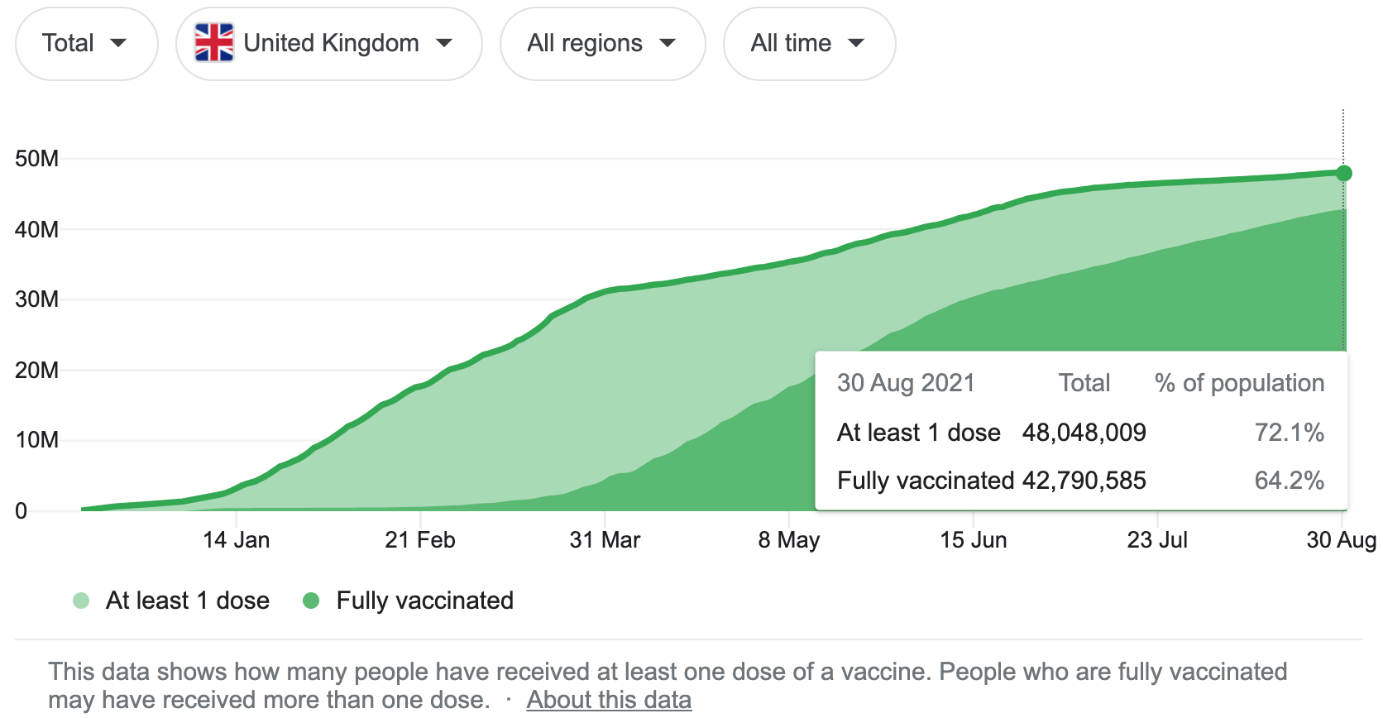
As the above graph shows, as of the 30th of August 2021, 72.1% of the population in Britain have had at least one dose of the vaccine. 64.2% were fully vaccinated.
Although it depends on who you listen to, I go along with those that suggest somewhere around 90-95% vaccination is required along with other measures to have some degree of confidence that the virus can be contained. Below that level, the probability appears to drop dramatically because of how infectious the Delta virus is.
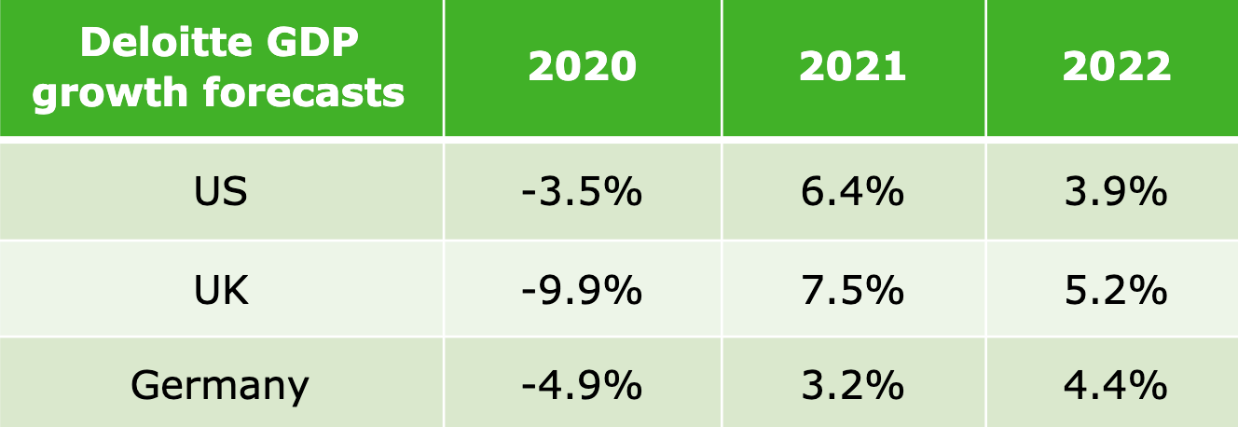
The above table tracks economic growth across the US, UK and Germany over 2020 and projects to 2021 and 2022.
Like other developed economies, Britain is in a good position (compared to developing countries) to recover from the coronavirus pandemic recession.
Like other countries around the world, the central bank in Britain has supported the economy, focused on stabilising unemployment and the economy. Economically and in terms of the vaccine rollout, they are on track, although they are not there yet. Crucially, we all await the outcome of the infection rate across Britain on a daily basis.
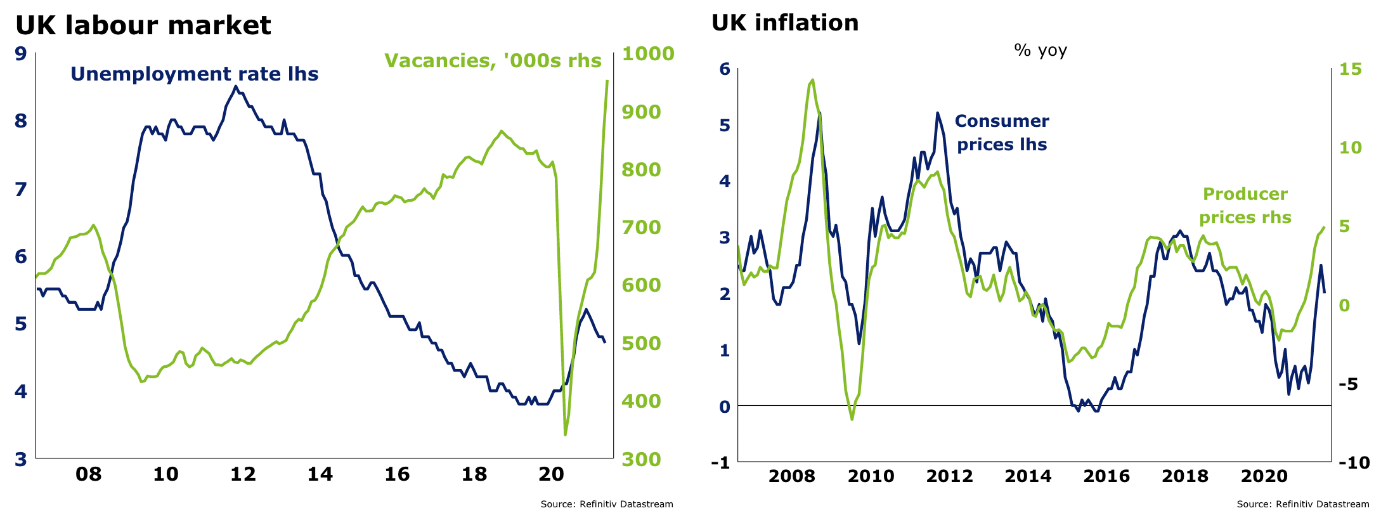
The graph to the left tracks the unemployment rate (the blue line) and the job vacancy rate (the green line), the chart to the right tracks inflation with the blue line tracking consumer prices and the green line tracking producer prices.
It is interesting to note that data from online jobs search agency Adzuna shows job adverts across all industries dipped slightly in August but remains about 20% above pre-pandemic levels.
Demand for work in domestic help, construction, and hospitality is also running well above pre-pandemic levels. The data also shows that graduate vacancies have almost fully recovered.
All in all, it’s not a bad outcome given the significant event economically and globally as a result of the coronavirus pandemic recession. Albeit with the support of the UK central bank, Britain’s economy is on track to recover.
It will be interesting to see whether their gamble regarding the vaccination rollout and other measures will be enough to contain the virus and ultimately provide herd immunity. They’re not there yet…
Australia
Australia continues to battle Delta
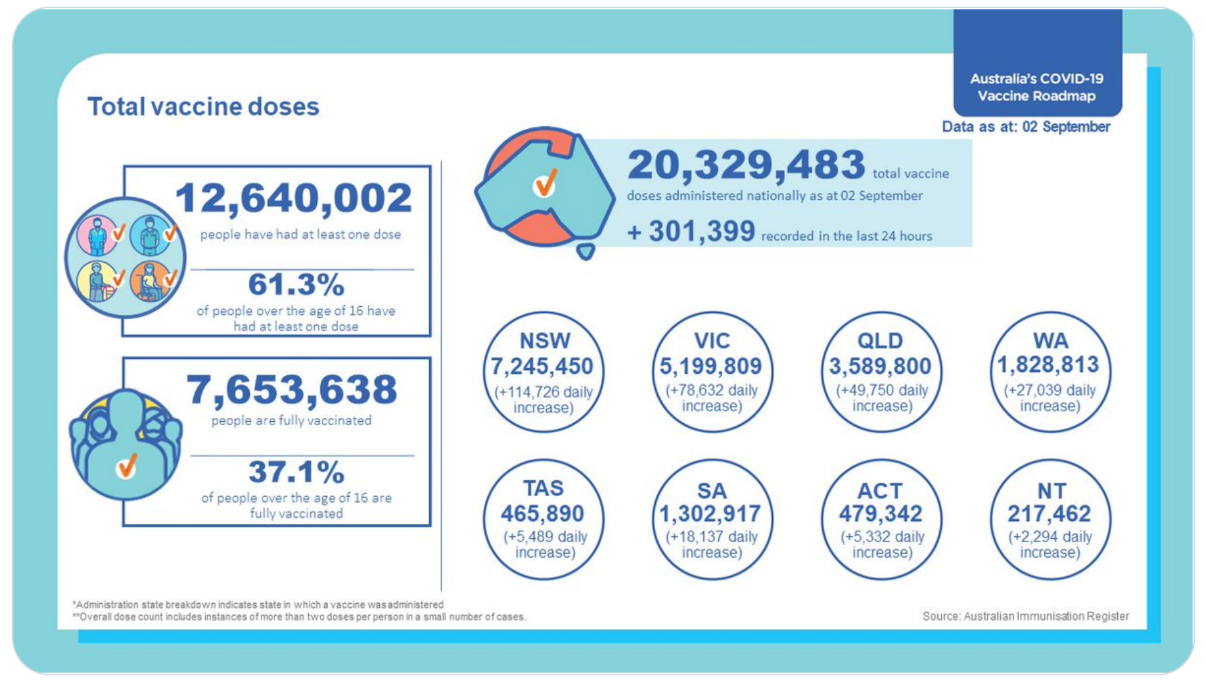
The above infographic provides a useful overview of Australia’s coronavirus situation.
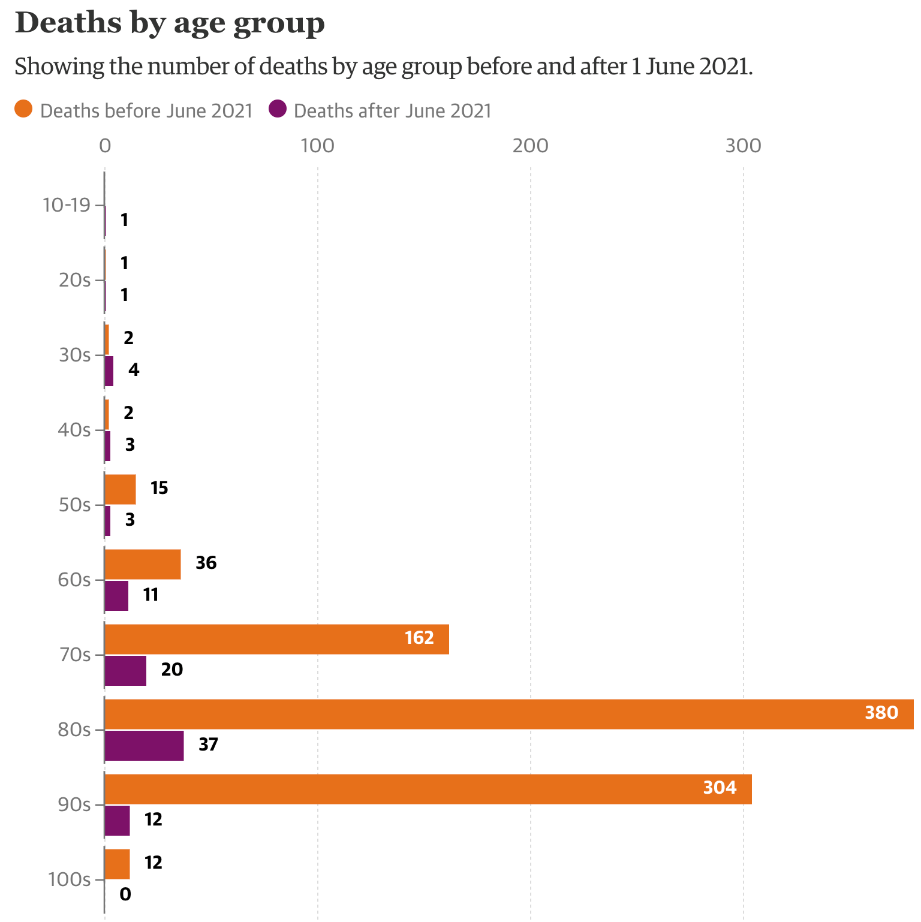
The above graph tracks the number of deaths from the coronavirus across Australia by age, segmenting the deaths between those before June 2021 and those after June 2021.
Interesting to see that Australia has a more in-depth array of statistical data available compared to New Zealand. It appears difficult for New Zealand to go much beyond nominal numbers, which I consider simplistic.
It’s not until we get into some ratio analysis and other different types of statistical comparisons that we start to understand what’s going on (beyond the number of cases each day!).
In Australia, we noticed a similar number of men and women have died since the pandemic began.
When broken down by age, we know that many of the women who died were in their 90s. This ties in with the fact that women generally have a longer life expectancy than men. Therefore, it’s not unexpected that more males than females have died in every age group under 80.
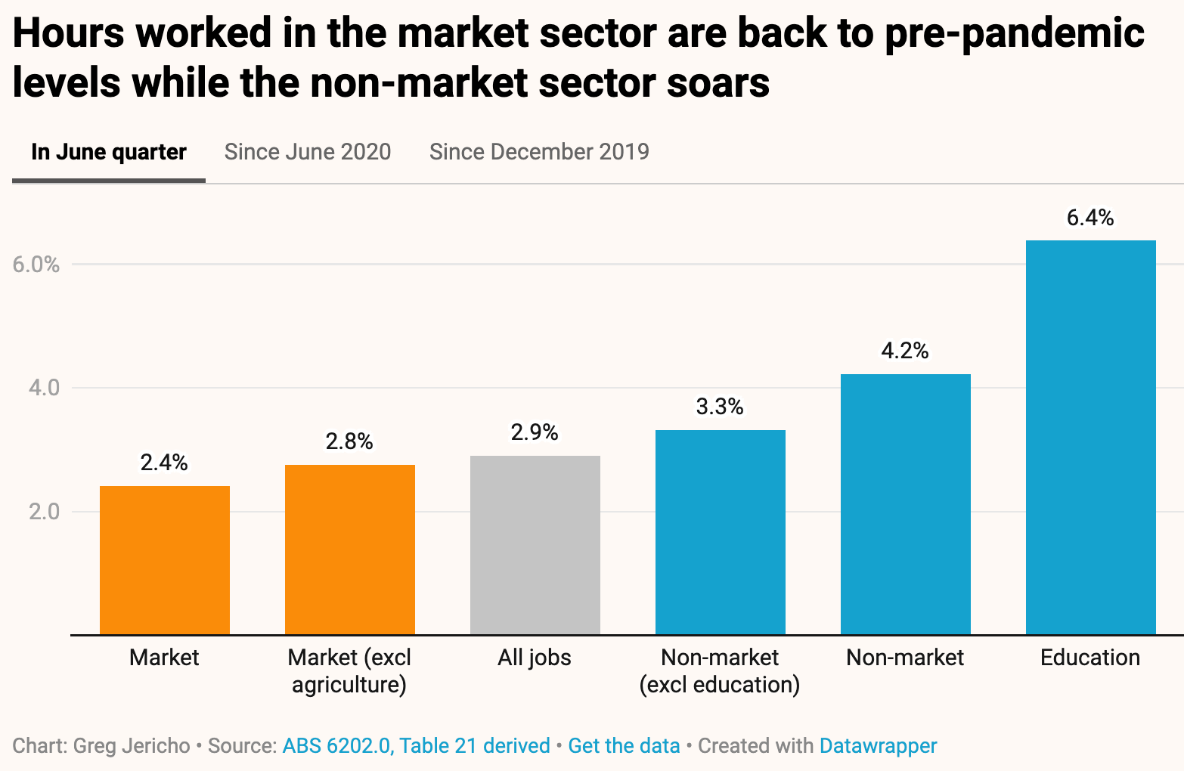
The above bar graph tracks the increase in the number of hours worked in each sector for the June quarter of 2021.
The bottom line is that unemployment in Australia dropped to 4.9% of the labour force, which is the lowest number since December 2010. That is an excellent achievement for Australia (and the Australian central bank, by the way).
At the risk of getting into too much detail, the underemployment rate grows from 7.4% to 7.9% but the significant lockdown drove that in Victoria and saw underemployment in that state increase from 7.7% to 10.1%.
Even so, the level of underutilisation in Australia of 12.8% (which includes underemployment and unemployment) is as low as it has been for about seven years. The bottom line is that fiscal stimulus truly does work.
Elsewhere, there is a debate across Australia about what percentage of the population should be vaccinated before opening up the economy.
Large corporates are pushing for an easy level of around 70-80% (funny that!), whereas academics and the healthcare system favour a rate closer to 90%.
We’ll see where the debate gets to in Australia. What do you think should be here in New Zealand?
New Zealand
New Zealand battles the Delta strain of the coronavirus
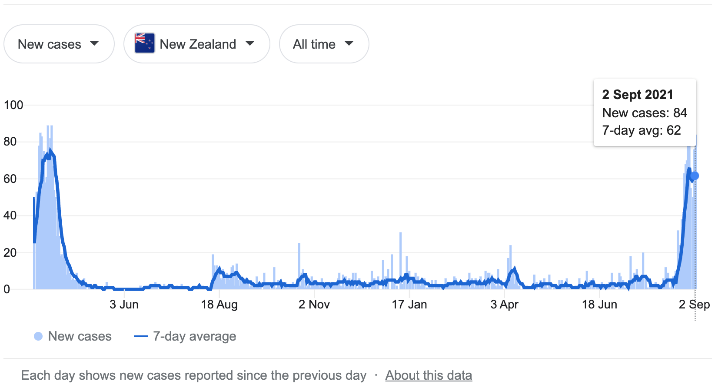
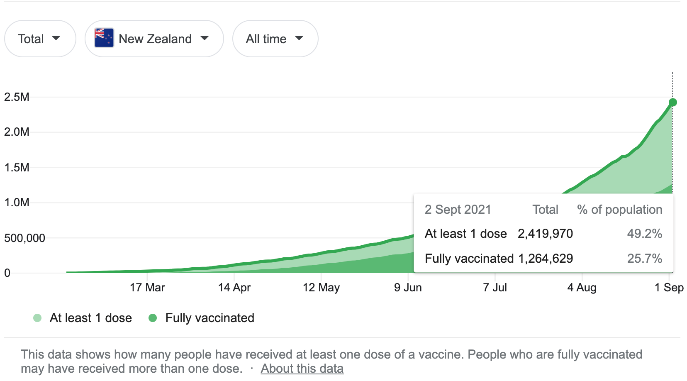
The graph to the left (the blue graph with the blue line) tracks the number of new cases and the 7-day moving average. The graph to the right (the green graph with the green line) tracks the number of people in New Zealand with one dose and the number fully vaccinated.
Well, here we go again.
There is a lot being said around the coronavirus and the new Delta strain. What matters for us, apart from individually how it impacts our personal lives and those around us, is from a market and economic point of view.
In general terms, for our clients, this latest round of coronavirus spread has so far had a limited impact on our investment portfolios. However, individuals and their families are impacted differently.
Although the fight against the virus fronted by the Labour Party is not perfect, New Zealand and the general population could be in a much worse position than we are now.
The bottom line is that, providing the support from the New Zealand Reserve Bank continues alongside that of other central bankers worldwide (let’s face it, we trade with other countries still), the spread of the virus is contained in the not-too-distant future; the medium to long-term impact from a market point of view and economic point of view will be limited.
Of course, some sectors are more affected than others. Unfortunately, there will be a layer of small businesses and individuals who will be unfortunate casualties. At least here in New Zealand, there is a safety net.
Anyway, it seems that if we can stay on track with the help of vaccinations, lockdowns and other measures, containment is more likely.
This means that with containment more likely, New Zealand as a whole has a better chance of getting back to normal (however that may look).
It would be interesting to see what impact a mostly vaccinated population has on those that aren’t.
For example, will there be any limitations to the freedom of movement for those not vaccinated?
Should there be?
In my case, I have had both vaccination shots and might even consider a booster at some point, not because I have concerns about my health, but rather, those around me.
GDP – New Zealand
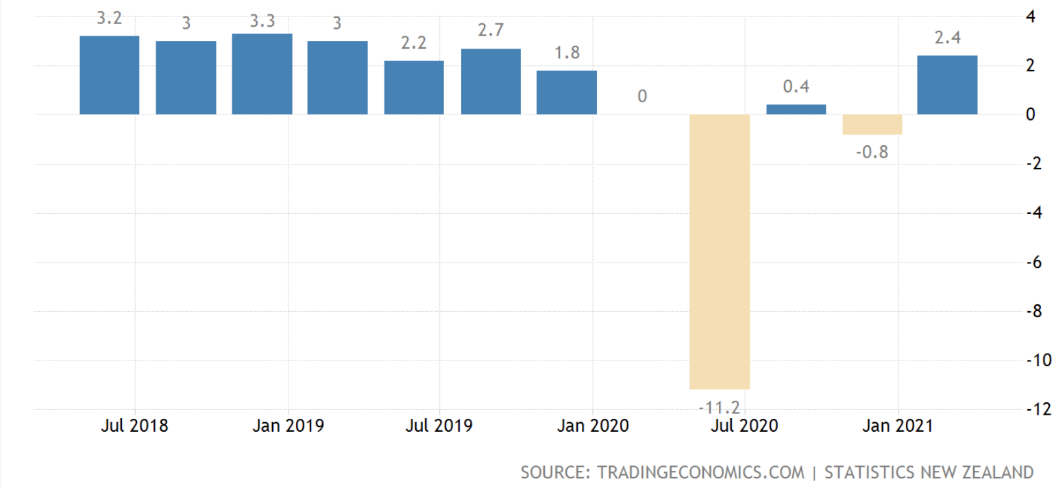
The above graph tracks an increase or decrease in economic growth across the New Zealand economy.
Although it would be interesting to see the latest data on how the spread of the Delta strain of the virus has impacted the New Zealand economy, so far, it appears that the economy has been reasonably resilient.
Of course, some sectors such as hospitality and tourism have been impacted more than others.
Ongoing Reserve Bank support, including low interest rates, is helping the New Zealand economy to continue to function. Whilst it’s not ideal for everyone, generally, the economy continues to function relatively okay and will likely emerge in reasonably good shape, all things considered.
Not wanting to be negative. However, the real risk is that New Zealand fails to contain the virus; it mutates into a much more difficult to contain strain that we struggle to control. This could potentially lead to much more serious damage to the New Zealand economy, not to mention the lives of everyday Kiwis throughout New Zealand.
Of course, we could just simply take the view, like some countries have tried, where we allow the virus to run its course through the population to develop herd immunity without the aid of vaccines or much in the way of other measures. The collateral damage generally is just a statistic. That is of course, until you look at who is affected. Whose mother, father, child, etc…
Although it’s not the only approach, the combination of vaccines and other measures such as masks, social distancing, etc. means that we have one way of getting on top of this virus. It may never be gone, however it may not damage our economy and people’s lives to the same degree that way.
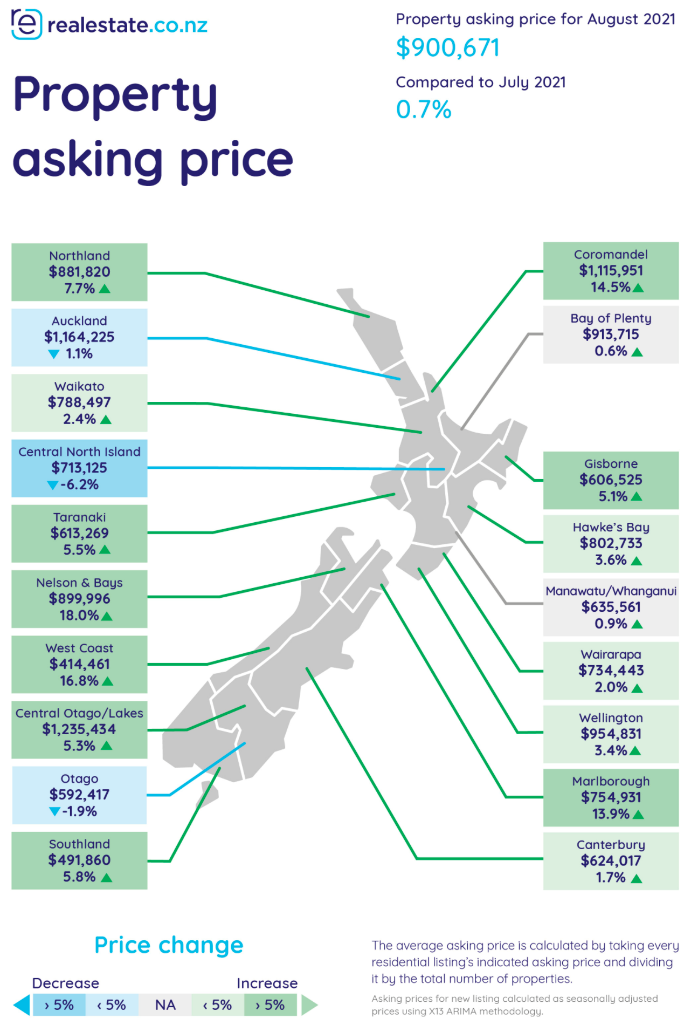
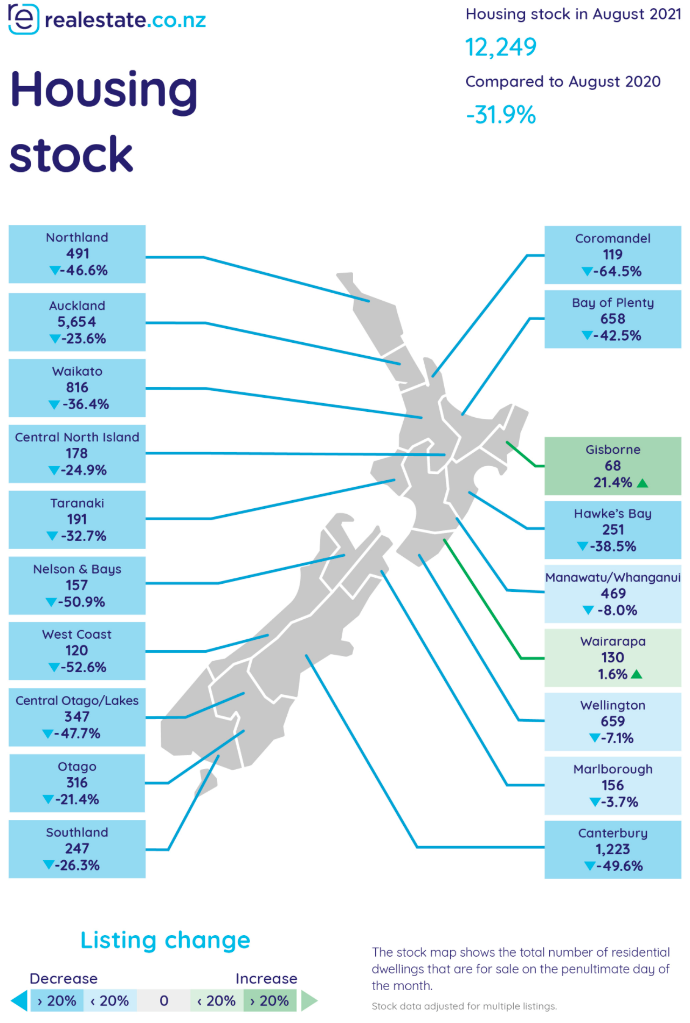
The map on the left shows asking prices for property across New Zealand. The map to the right shows the change in the level of housing stock across New Zealand.
Although varied from location to location around New Zealand, the average increase in the asking price for August compared to July was 0.7%.
More interesting is the comparison from August this year to August 2020, which shows the level of new property listings declined by a significant 27.5% over those 12 months. Obviously, lack of supply of property is helping to support residential property prices around New Zealand along with low-interest rates. This is being offset by lower numbers of new arrivals into New Zealand.
By the way, did you notice recently that the Reserve Bank in New Zealand (RBNZ) wants to limit lending to those with less than 20% deposit for their own home to 10% of bank lending?
Currently, banks can lend up to 20% of their book at less than 80% of the loan-to-value ratio. This means that this tightening of the availability of funding for property will mean some would-be property purchases will not be able to proceed. Of course, this helps to slow down the velocity of buying and, therefore, the pace of increase in property prices.
The one initiative that has been talked about that so far that has not surfaced yet, is the loan-to-income or debt-to-income ratio.
This is where banks would be forced to limit the amount someone could borrow for a home based on the borrowers income compared to the level of debt ( e.g. be able to borrow no more than say for example, 8 times their income), in addition to the existing measures already in place.
In short, this would mean that there would be another layer of would-be purchasers not able to buy or upgrade. Again, this would help slow down the increase in property price rises, or, depending on how this one is applied, if it’s tough enough, it could even stop price growth.
That said, this debt-to-income ratio has been applied in the likes of the UK, and although it does have some impact, at least in the experience of the UK, it didn’t seem to have significant impact long term. However, combined with other factors, it can be quite a powerful measure. Let’s keep an eye out for this debt-to-income ratio.
To Summarise…
In my view, the Chinese Communist Party crackdown on large tech companies, the education sector, and other areas within the Chinese economy is not an attempt to unravel the capitalist advances made over the last two to three decades.
I believe it is more about rationalising the excesses in the economy to rationalise the distribution of wealth more evenly and potentially more fairly across the population. The Chinese are very strong on the long-term view and I think this is a long term strategy.
As I have mentioned elsewhere, the Chinese have become more vocal, which suggests there could potentially be some threat to US-based companies operating in China (e.g., Starbucks, Apple come to mind).
Whilst possible, put simply, it would seem highly unlikely that the Chinese would substantively penalise either company or others, knowing that the US will be forced to respond. Not only that, but, those companies also employ lots of Chinese citizens. Further, they have lots of other options in terms of “sticking it to America”.
Although China is looking to become more self-sufficient, there is no quick fix. It’s going to take many years, possibly decades, and in the meantime, China, like all other large economies, relies on other countries, including the US, for global trade.
A good example would be the well-publicised spat between China and Australia recently. Over that period, we saw the most amount of iron ore sold to China out of Australia in history, all while that argument was going on.
The Delta strain of the coronavirus has unfortunately shown just how problematic this type of event can be. Everyone has an opinion about it.
The reality is, it’s more than just a conversation. It’s real. It impacts people’s lives and, as we’ve seen, can also impact, not only one or two countries’ economies but also the global economy.
Fortunately, whether we agree with the methodologies or don’t, we appear to be on track for some degree of containment of the virus, which will take us all back to something closer to normality, even if it’s not quite the same ‘normal’ as it was in the past. For example, wearing a mask is decidedly inconvenient but nothing compared to the pain and suffering delta can inflict on certain members of the community.
So, China is a possible risk for the global economy, although only to some degree in my view. The Delta virus is another risk. It looks as though there is a good possibility of a reasonable degree of containment. The real danger here is that its containment is too slow, allowing the virus to mutate again, which is potentially much more problematic … to be avoided!
The market continues to watch the US Federal Reserve and the level of inflation to get a guide on tapering and interest rates.
The recent jobless number out of the US was a lot lower than expected, which will be a factor helping to slow down tapering and continue to hold interest rate increases out of the US until further into the future. Tapering initiated by Christmas has been one suggestion, and interest rates at some point in 2022 is another.
Closer to home, though, interest rates are already rising. If they do increase, I suspect it won’t be by much unless the current risks suddenly disappear, which would seem unlikely.
Finally, I talked recently about the volatility that seems to turn up around September and October each year.
Who knows what this year may bring however it would be nice to see the correction of some sort.
A solid 10 to 20% might seem unsettling but would provide us with some good buying opportunities.
In the meantime, it doesn’t mean that there is no opportunity. It’s just that the prices that we’re paying to take advantage of some great businesses that are available to us, is more than we’d prefer to pay.
That’s why a decent correction over the next couple of months would be ideal – what do you think?