The Global Economy
Global Economic Update – Quarterly Update – May 2018

Peter Flannery CFP AFA
“If you have one economist on your team,
it’s likely that you have one more than you’ll need.”
Warren Buffett
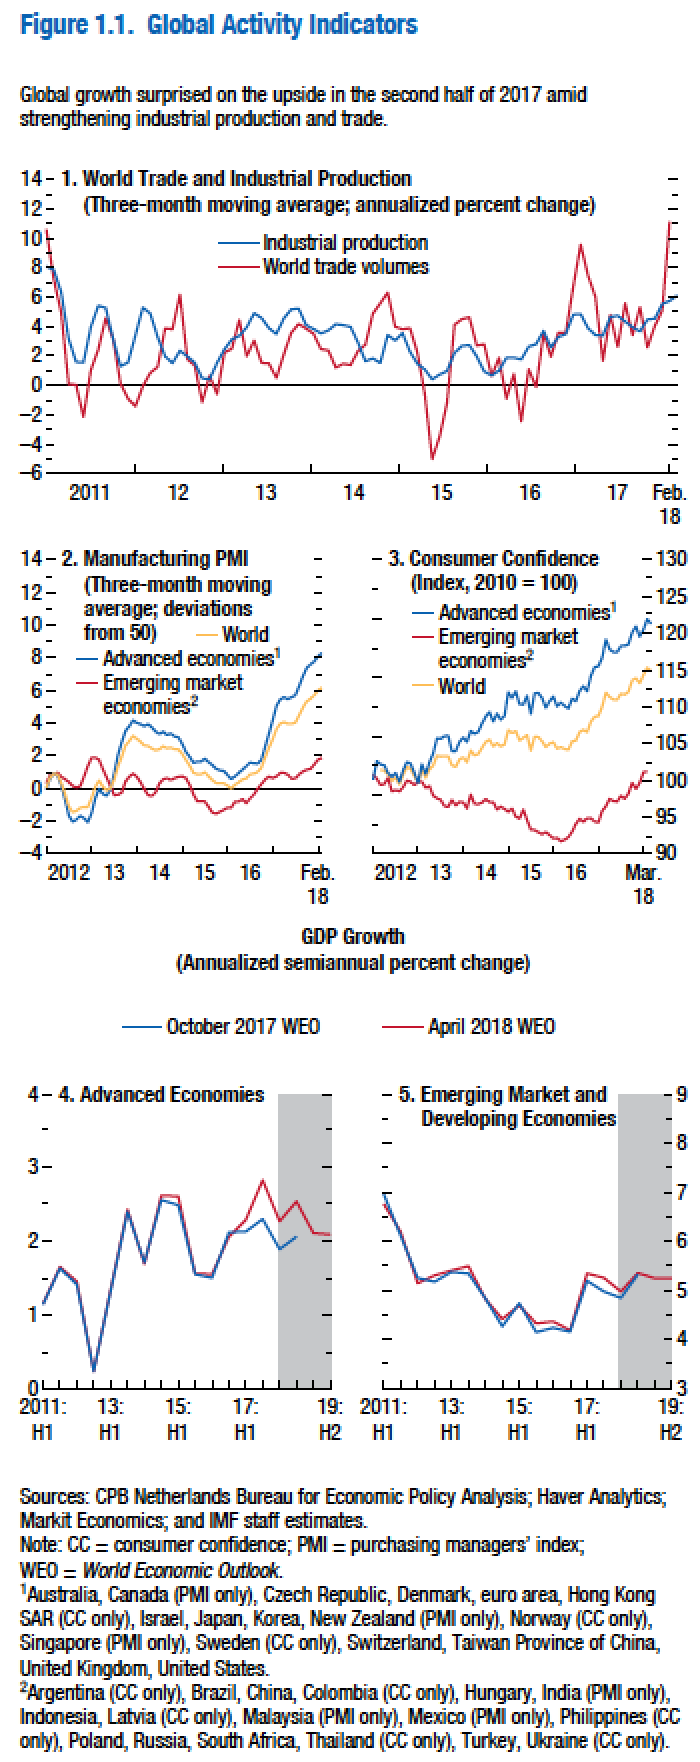
The above looks like a lot to take in. Those five charts above show improving economic conditions globally. See below for more detail.
The top chart you may recall from two weeks ago shows that world trade is trending up (the blue line) and has been since around 2016. The red line shows a spike in world trade volumes which again whilst an unsustainable increase, is nonetheless part of a trend heading in the right direction. With industrial production and global trade improving, this forms a promising platform upon which the global economy can continue to grow. It also helps to stabilise the global economy and to provide somewhat of a buffer against slipping back into a recessionary phase (although to be clear it’s inevitable at some point given the number of variables at play and the cyclical nature of that global economy). For now though, those indicators are looking positive.
The middle two charts which you will also recall from two weeks ago shows that manufacturing (the chart headed up 2. Manufacturing PMI) as measured by a three month moving average in each case, for advanced economies (the blue line), the emerging market economies (the red line) and the global economy as a whole (the gold coloured line) is also trending in an upward direction. Again as mentioned earlier, this supports global stability and ongoing economic growth, at least in the near term.
Looking at chart no. 3 on the right of the manufacturing PMI chart and we can see that consumer confidence levels are also improving. The blue line shows that consumer confidence in advanced economies is improving and at a higher pace than consumer confidence in emerging market economies (the red line) which is nonetheless improving and of course the gold coloured line shows that consumer confidence globally is also in an upward trend.
Confidence is important because when consumers are confident they will spend money which helps economies to grow. When businesses are confident they are more likely to invest in infrastructure and more staff which helps them to grow their businesses. For economies to grow, employees might be paid a bit more but also additional people will be employed in businesses who in turn will spend more money, who in turn will keep the wheels of their respective economies turning, which can indeed lead to more confidence.
Of course my outline it is an over-simplification but does provide you with the idea of why an improving consumer confidence trend is important for economies and for the global economy.
As you can imagine, when scary things happen, consumers are less likely to spend and business owners will become more cautious as they seek to manage risk. On the other hand, in the absence of negative activity (and a melodramatic media blowing things out of proportion) the so-called wealth effect prevails and consumers are happy to not only spend money but also to borrow to consume bigger ticket items. Business owners focus on the opportunity to grow and expand and are likely to invest in that environment.
The two lower charts at the bottom (chart numbers 4 and 5 previous page) show economic growth as measured by GDP. The chart on the left shows some historical economic growth data as well as the world economic outlook (WEO).
As you can see, the outlook for advanced economies (the red line) shows economic growth continuing but slowing down somewhat. The chart on the right (chart no. 5) refers to emerging market and developing economies. There you will see economic growth is underway at a faster pace than advanced economies and the outlook is for ongoing expansion, but at a slightly slower pace. These of course are projections and they may or may not become reality but do provide a useful guide to help with decision making. Obviously if those red lines were in a sharp downward direction this would signal trouble ahead. An easing back as highlighted in those charts whilst not ideal is not necessarily a major problem.
Inflation and wages growth
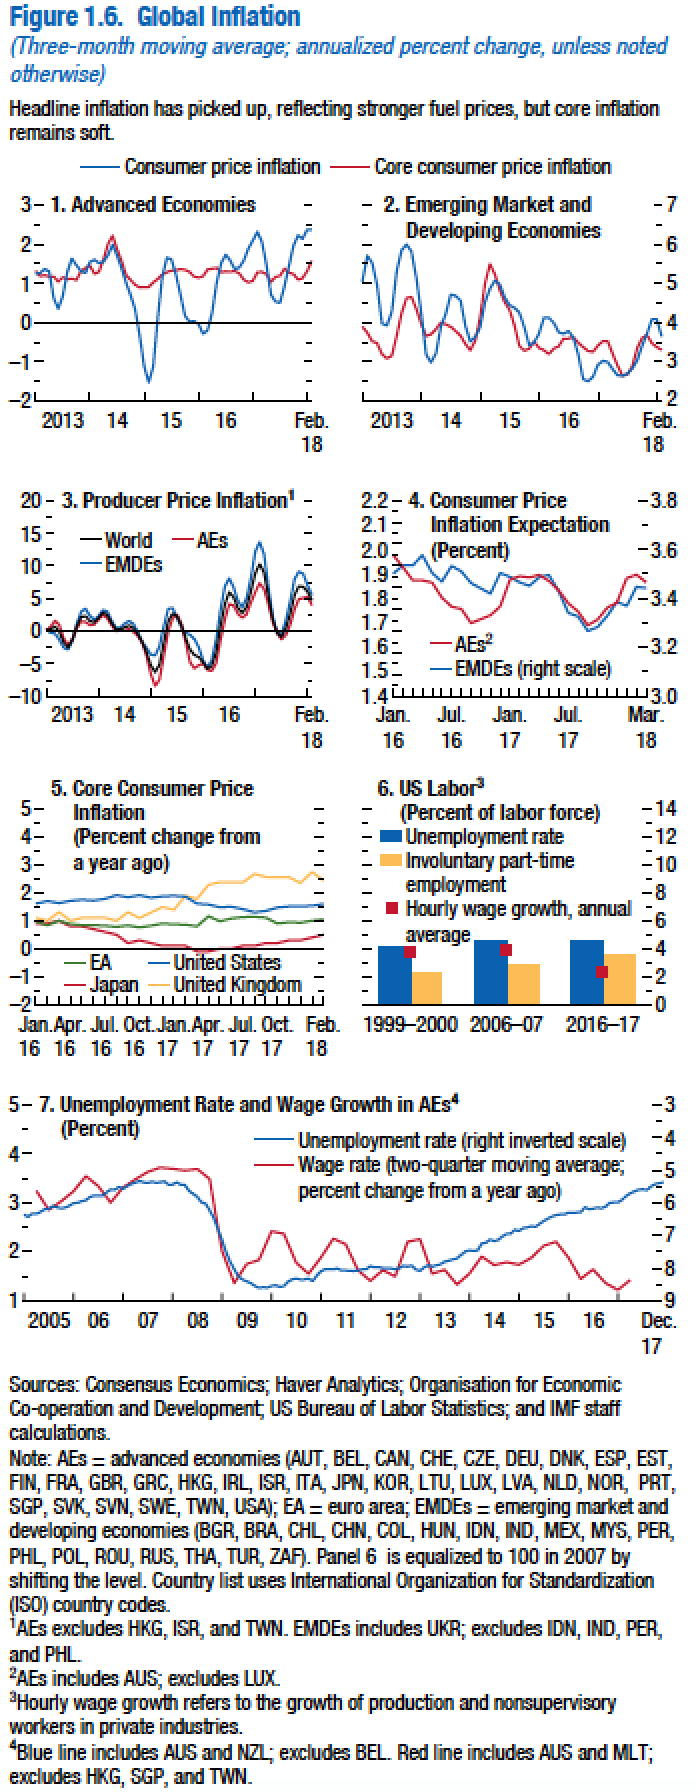
Looks like a lot to take in but let’s take a closer look at the key indicators.
Inflation, wages growth and interest rates are key indicators that the markets are watching closely right now – hence why I mention them here. By the way, core inflation excludes fuel and food prices. Both of the top charts show that core consumer inflation is basically trending sideways (the red line). Then if you go down to chart no. 5 you can see that inflation in the UK (the gold coloured line) is in fact tracking upward as is Japan (the red line) although from a low point whereas the European area and the United States are generally tracking sideways. In other words consumer inflation is not rising much which means that deflationary effects remain strong.
Chart no. 6 (page 2 above) is about US employment. Of interest is the small red square blocks showing wages growth and as you can see wages growth is underway but has been indeed declining particularly over the last 10 years.
This brings us to chart no.7 (the bottom chart) which shows the unemployment rate and wage growth in advanced economies. The blue line is measured by looking at the right hand grid. You can see the blue line stops just under 5.
Effectively the blue line is tracking declining unemployment and as you can see if you go back to around 2009 unemployment was around 8½% and steadily over time towards 2014, 2015, 2016 (the grid on the bottom of the scale showing the years) you can see the blue line tracking up which because it is an inverted graph means that it is showing unemployment reducing (note the numbers start at 9 down the bottom and finish at 3 at the top).
Note that unemployment has been declining significantly and is now even lower still than this chart shows.
The real point of this chart though is that wages growth has been relatively stable (the red line and the left side axis) but recently there was a slight uptick in wages growth particularly in the US which rattled the markets earlier this year.
The bottomline here is that wages growth has been low which is baffling for many economists because normally when unemployment declines wages growth rises. This has not happened (at least so far).
It is worth remembering that, particularly in the US market, right now there is real focus on wages growth, rising interest rates and rising inflation. As those indicators rise it is possible that markets will react and become volatile – watch this space.
United States of America
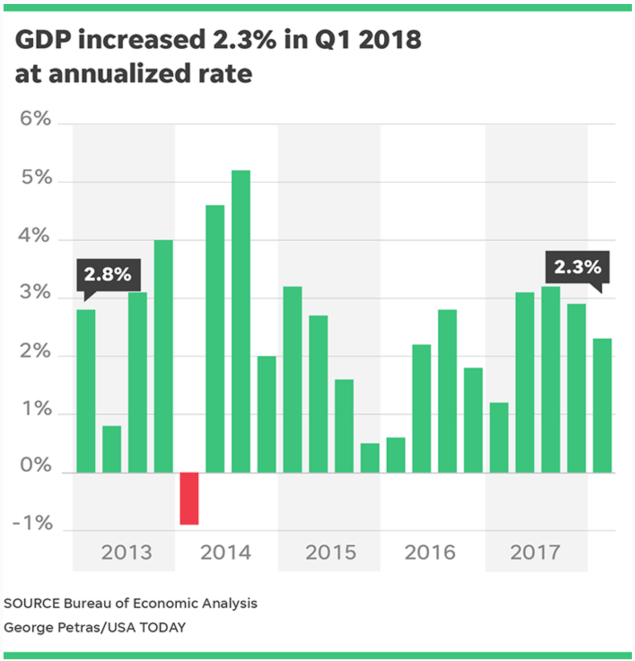
The US economy continues to grow at a slightly higher pace than was expected.
The US economy as measured by gross domestic product (GDP) grew at a rate of 2.3% (annual rate) which was slightly better than was expected. This was a good result given the usual sluggishness of the first quarter. Interestingly too, consumer spending accounts for more than two-thirds of the US economy and it slowed to a 1.1% rate of growth in the first quarter. There is some evidence that consumer spending in the last quarter was slowed down by declining motor vehicle sales, footwear and clothing, along with a slowdown in food expenditure. This is possibly because of the tax cuts that are about to kick in now. Residential construction in the US increased by 12.8% over the October to December 2017 period which is a significant pace of growth. Looking ahead, government spending is expected to accelerate over the next quarter given the recent approvals by Congress of more government spending.
Fed. Funds Rate
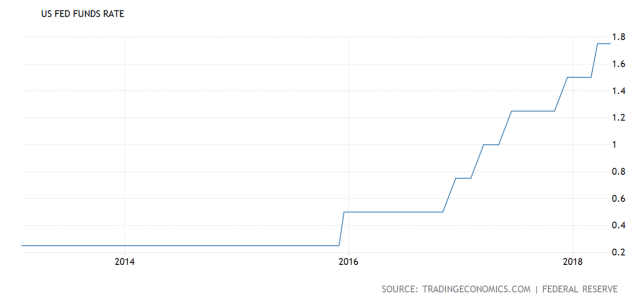
Interest rates in the US continue to track upwards.
The Federal Reserve in the US left its target range for the Federal funds rate steady at 1.5% to 1.75% during its May 2018 meeting. This was in line with expectations as the Federal Reserve maintains its cautious growth approach to raising interest rates. Policymakers are watching the unemployment rate decline and economic activity continuing to rise although at a moderate pace. There are some suggestions that a rate hike in June is on the table. That means interest rates will go up again consequently, putting slightly more pressure on rates in New Zealand to rise also – although those rate rises might be further out into the future perhaps.
US Inflation
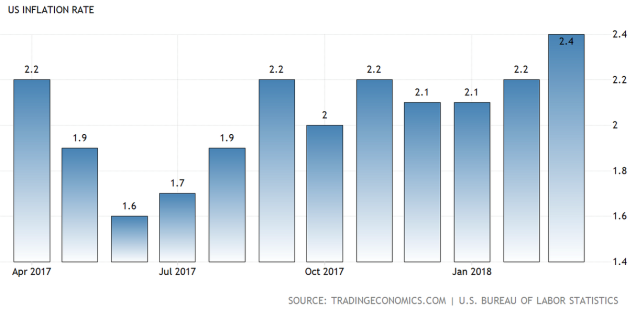
Inflation is rising although slowly.
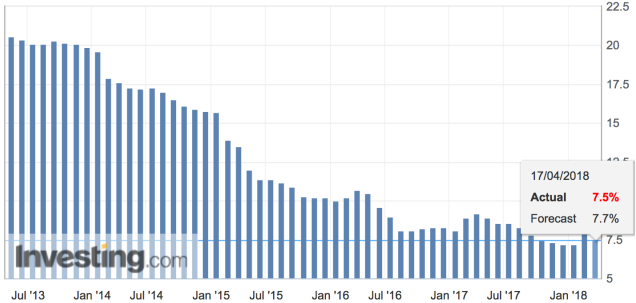
US inflation is running at the highest rate in over a year, coming in at 2.4% year over year in March 2018. The boost to inflation appears to be mainly due to housing and used car prices. Interestingly, petrol prices were down 4.9%, the largest drop since May 2017 – a different story to what’s happening here in New Zealand!
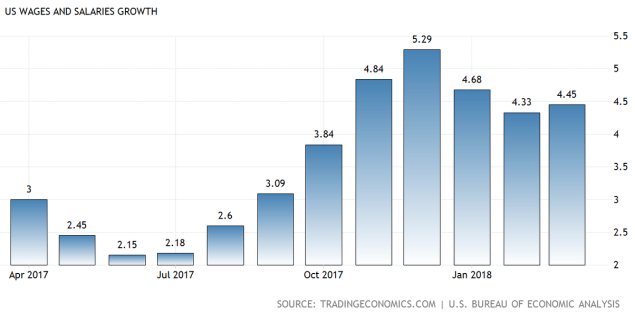
US Unemployment And Wages Growth
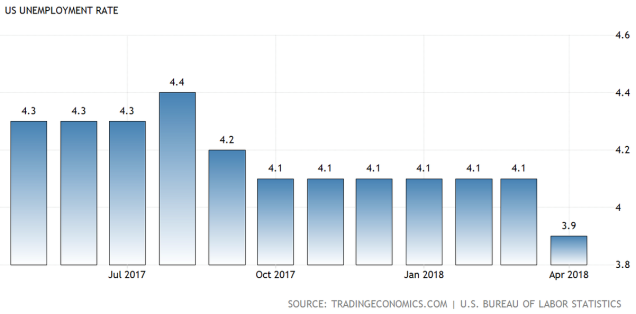
The top chart shows unemployment declining. The lower chart shows sluggish waages growth. Unemployment continues to decline and usually wages growth picks up in this environment – but not quite so much of late.
Unemployment based on the Bureau of Labour statistics is now down to 3.9%, the lowest level for 17½ years.
Usually as unemployment declines wages growth picks up however whilst wages growth is running at a bit over 4% which is not too bad, as you will see from the chart below, the long term trend for wages growth in fact is down. This appears to be symptomatic of an economy that is struggling to increase the pace of growth sustainably.
US Wages Growth
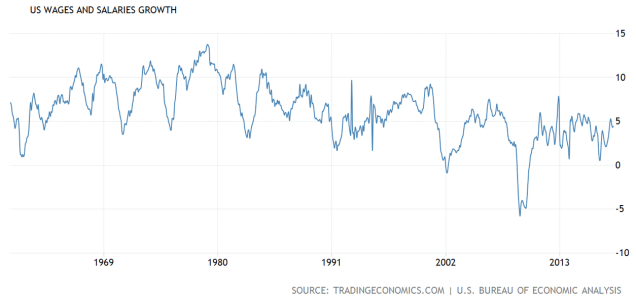
Note the trend from around 1980 to now.
Although the short term trend looks like an uptick in wages growth, the long term trend has definitely been a downward one for wages growth. This is important because wages growth will help boost consumption and better living standards but of course it will likely also rattle the markets who will see wages growth as an indicator of rising interest rates ahead.
Overall the US economy has stabilised and continues to grow. The tax cuts for both corporations and everyday Americans will have some impact that will be positive. Although on the other side of the ledger there is the mounting debt that needs to be serviced not to mention paid back in the long term.
For now though, US debt remains manageable and in my view is not a concern for the US economy. It’s not ideal but not a deal breaker for economic growth in the US economy at the moment.
China
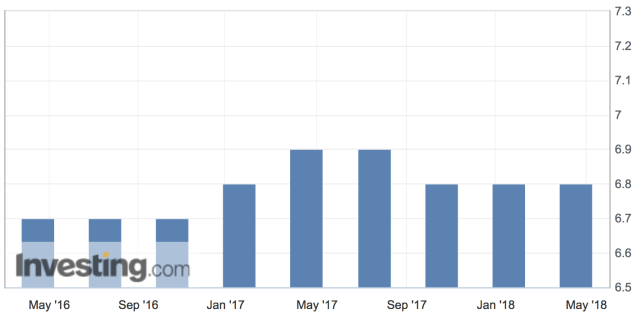
Economic growth in China remains stable and continues on.
China’s economic growth as measured by GDP came in at 6.8% year over year which is slightly above market expectations of 6.7%, according to official data. Supporting this number was an increase in property investment and also quite strong consumer demand as well. This is not a bad result for China with three consecutive quarters showing what can only be described as stable economic growth. The Chinese government maintains its economic growth target at 6.5% – so far they appear to be on track to meet this target.
Industrial Production
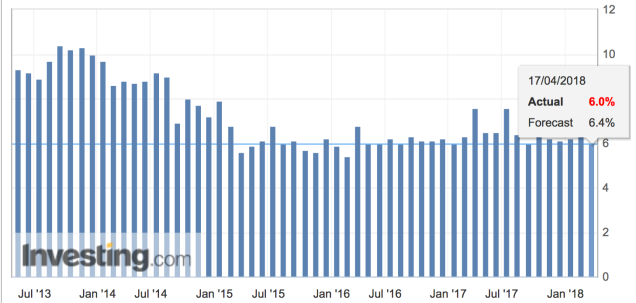
Although below forecasts, industrial production remains stable to the long term trend.
China’s industrial production increased by 6% year over year in March 2018 which came in below market expectations of 6.4% after a 7.2% gain in the previous period. This number came in as the smallest increase in industrial production since last August. Not a major problem but nonetheless a number to keep an eye on.
Retail Sales
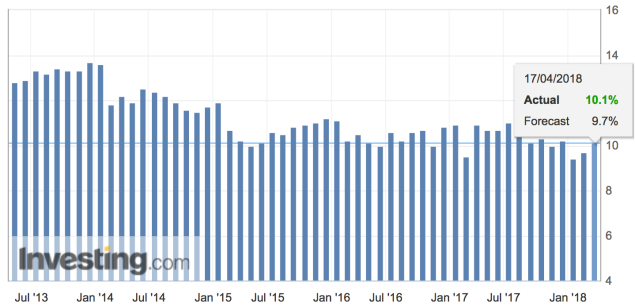
This chart measures retail sales year over year.
Meanwhile, retail sales in China beat expectations in March rising by 10.1% from 12 months ago, boosted by sales of furniture and home appliances, clothing and cosmetics. The Chinese consumer is alive and well. This is interesting because an important shift for the Chinese economy is somewhat away from manufacturing and exporting towards a more consumption based economy, more along the lines of other developed economies around the world.
Fixed Asset Investment
The pace of Chinese fixed asset investment has declined a bit.
Fixed asset investment measures the change in the total spending on non-rural capital investments such as roads, factories, electricity infrastructure and property. Generally a higher reading is positive and a lower reading is considered bearish or negative. The number came in slower than was expected at 7.5% from a year ago down from 7.9% in the first two months of the year. Economists were expecting fixed asset investment to come in at 7.6% over the first three months of 2018.
The Chinese economy continues to grow at a steady pace and without doubt, the Chinese economy, which in my opinion is vigorously managed by the Chinese government, is quite stable. It will be interesting to see what the data tells us over the next three months as to whether any cooling in investment growth, structural reforms or rising trade protectionism will have any impact. China is well prepared but of course not immune to protectionist trade policies that could be implemented in the future.
Europe
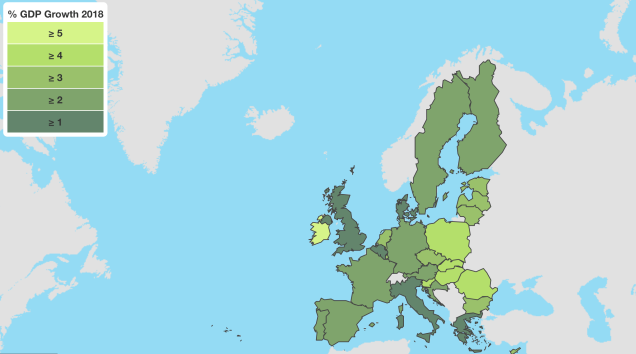
The darker the colour the lower the growth – the brighter the colour the faster the economic growth.
The European economy grew at its fastest pace in 10 years over 2017 as the recovery became more broad based among member states. This economic expansion appears to be supported by high levels of confidence, low interest rates (our old friend!), low energy costs, improving private balance sheets, better labour market conditions and possibly the synchronised global expansion that is underway.
Early 2018 however has seen the pace of growth slow down a bit although this is due mainly to short term influences that may have less impact moving forward.
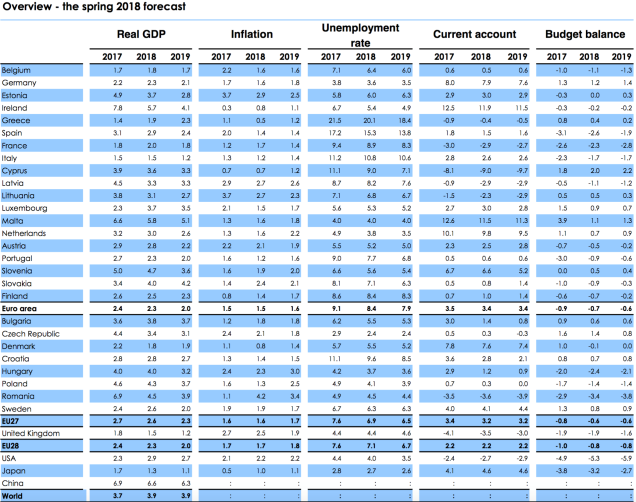
The actual numbers for 2017 with the outlook for 2018 and 2019.
Although we always need to be cautious about projections into the future, the above chart does provide some idea about the potential path for the European economy over the next couple of years. However it does provide the actual performance in each of those areas outlined on the above chart over 2017. Clearly, economic growth is underway in Europe, although still a bit early to say whether or not it is fundamentally sustainable long term. After all, it remains based on fiscal stimulus including low interest rates and low energy costs. Mind you, we will take economic growth under these conditions rather than the alternative which is not nearly so pleasant.
Economic growth in Europe is expected to remain reasonably strong, perhaps moderating a bit as monetary stimulus is gradually withdrawn and global trade growth eases back somewhat in the future. In general terms the outlook for economic growth sits at around 2.3% over 2018, slowing to around 2% in 2019.
UK
Is the slow burn of Brexit manifesting itself on the British economy?
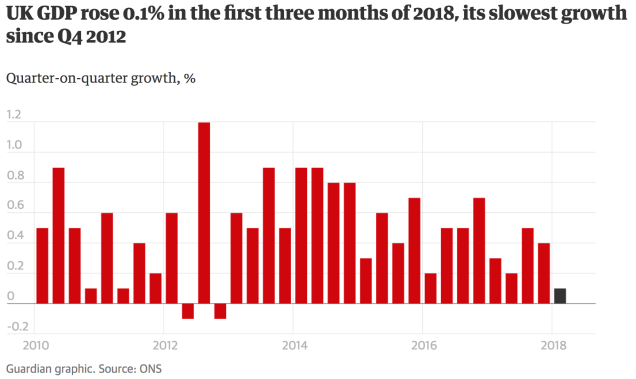
Economic growth in Britain fell to its slowest pace since the fourth quarter of 2012. Construction appears to be partly the cause not helped by the collapse of construction company Carillion which may have had somewhat of a knock on effect to smaller subcontracting firms.
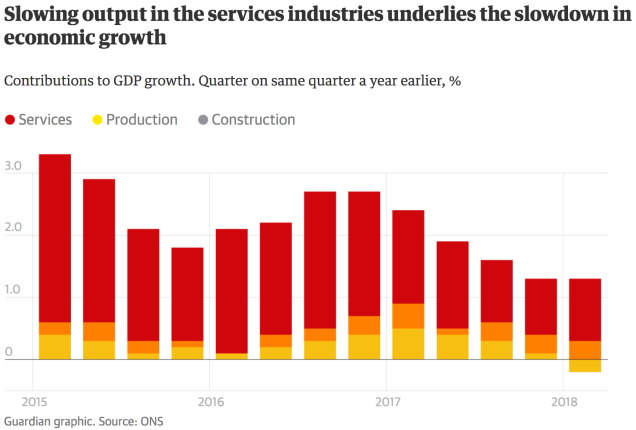
The combination of decline in services, manufacturing production and construction creating problems for the UK economy.
Although the strong performance by manufacturers over 2017 continues to provide support for the UK economy, this appears to have come to an end over the first quarter of 2018. Factory output was up 1.3% in the last quarter of 2017 but only by 0.2% in the first quarter of 2018 and … you guessed it, the slowdown in the Eurozone has led to weaker demand for UK exports however there is some evidence that manufacturers have run into some capacity constraint issues following many years of under investment. Let’s wait and see whether more evidence of this emerges. This is important because this is not so much a Brexit issue but rather a poor planning and an under investment issue by UK manufacturers.
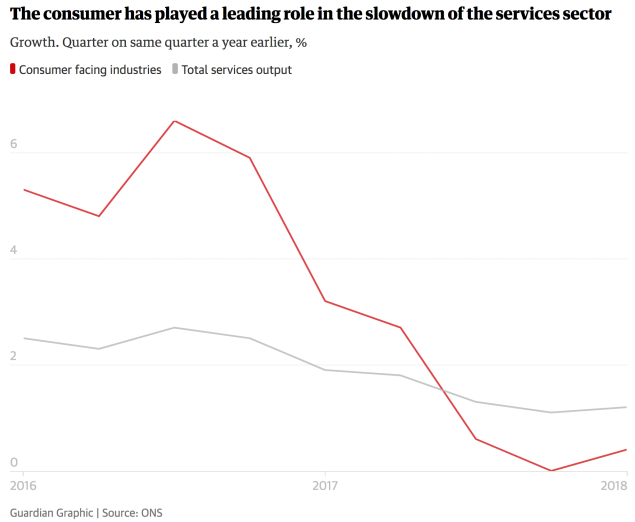
The above chart shows how important consumers are to the UK economy.
The lack of spending power for consumers appears to be having some impact on the service sector, which accounts for approximately 80% of the UK economy and appears to have grown by only 0.3% in the first quarter of 2018.
UK Inflation
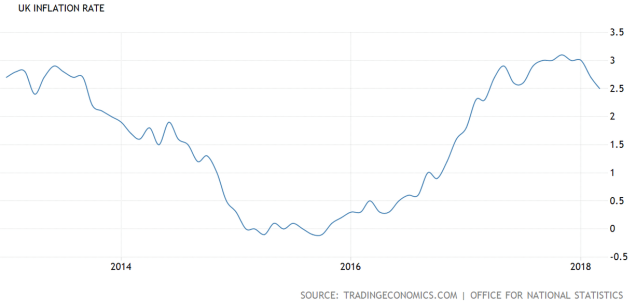
Inflation is reasonably healthy but declining.
The inflation rate in Britain fell to 2.5% in March 2018 from 2.7% in the previous month and was below expectations of 2.7%. This looks like the lowest reading since March last year. The question is whether it’s the start of bigger declines ahead?
UK Interest Rates
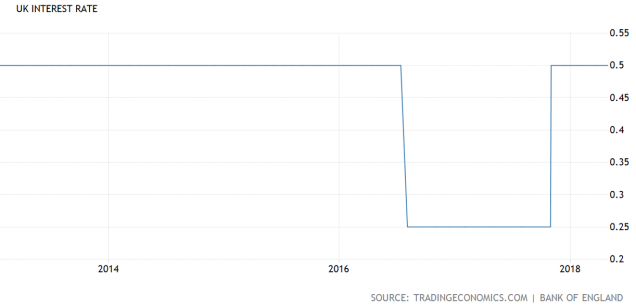
The recent interest rate rise leaves interest rates at around half a percent. Interesting …
The Bank of England voted by seven votes to two to keep the bank rate at 0.5% on 22 March this year. They think that wages growth is likely to pick up in response to the tightening labour market and inflation will remain above the 2% target. They also reiterate that ongoing tightening of monetary policy (raising interest rates etc) will be appropriate to return inflation sustainability to its target which raises expectations of a rate hike this month. With economic growth under pressure it would seem a surprising move to raise interest rates again so soon – what do you think?
The UK economy has been reasonably stable throughout the Global Financial Crisis but is beginning to look a bit more fragile without even the impact of the low burn of Brexit fully manifesting itself across the UK economy. An interesting time lies ahead for the UK economy – let’s watch this space.
Japan
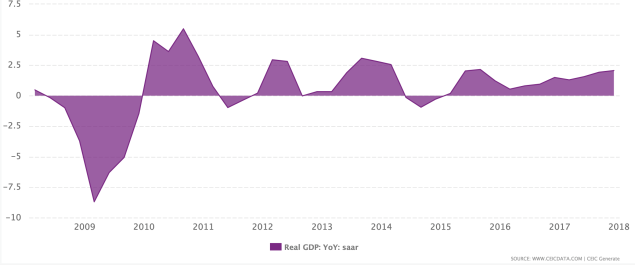
The Japanese economy continues to grow.
The Japanese economy entered 2017 on a slightly weaker footing due to exports declining and imports increasing strongly over the fourth quarter. Still, despite this, the economy successfully expanded for the eighth consecutive quarter (in the fourth quarter), the longest run of growth since a 12 quarter stretch that ended in 1989. That of course was the wakeup call for Japan’s famous economic bubble back then. As you know Japan has struggled to emerge from that bubble even now. The latest round of economic growth though looks promising but of course, like Europe and the US, the growth is supported by fiscal stimulus. Indeed in Japan’s case the so-called “printing machine” has been literally “smoking” with one of the largest fiscal stimulus packages ever unleashed on any economy ever.
The Bank of Japan expects economic growth in the Japanese economy to continue at a rate of between 1.3% and 1.5% over 2018 (which ends March 2019). Interestingly, in the following fiscal year the Bank of Japan sees economic growth at between 0.7% and 0.9% – not much! Japan’s economy remains caught up in the grip of deflationary funk, so far unable to escape its clutches. This is important to remember because Japan is by some measures the world’s third largest economy.
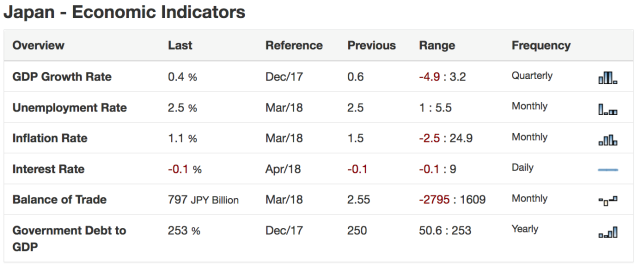
Note negative interest rates and a negative trade balance – not ideal.
Inflation
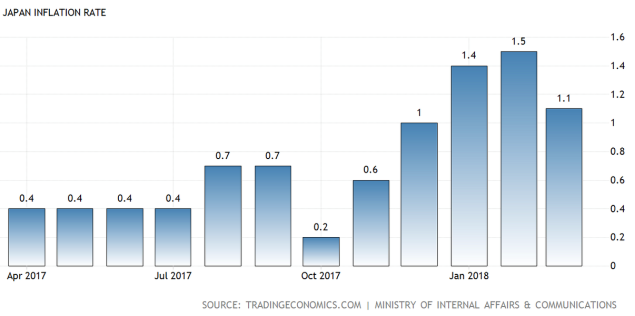
Inflation has increased over the last six months.
Consumer prices in Japan increased by 1.1% over the 12 months ended March 2018. This represents the lowest inflation rate since December 2017, due mainly to a significant slowdown in the cost of food.
In March, food prices increased by 1.9% over the previous 12 months which was quite a bit slower than the 3% rise year over year in February.
Interest Rates
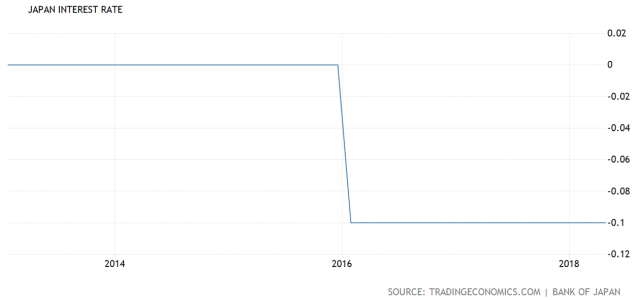
Interest rates in Japan remain negative.
The Bank of Japan left its key short term interest rate unchanged at – 0.1% at its April 2018 meeting as widely expected (keeping interest rates negative). Policy makers also kept their target for 10 year government bond yields around 0% but dropped their target date for reaching 2% inflation (that’s deflation for you!).
Japan’s economy looks likely to continue its moderate expansion over 2018. This is due significantly to highly accommodative financial conditions and the fiscal spending through the government’s large stimulus measures. If business fixed investment in capital assets continues to increase this will help to support economic expansion, as will the required 2020 Olympic Games related investment. Exports should also help to underpin economic expansion in Japan on the back of synchronised economic growth around the world. So, fragile low and slow growth but steady as she goes for now for the Japanese economy.
Australia

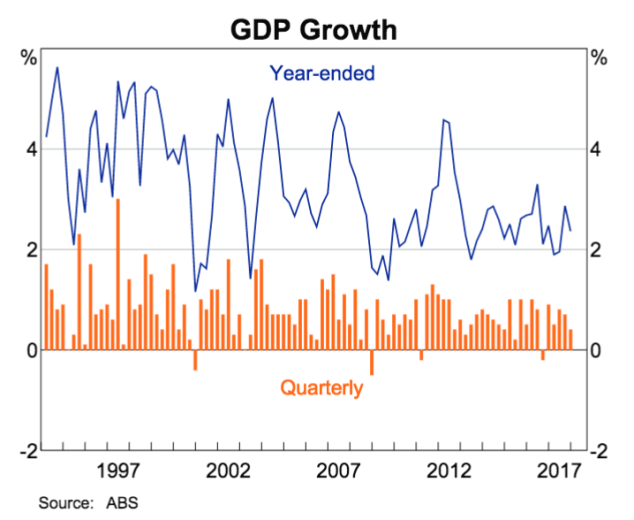
Economic growth in Australia came in lower than expected over 2017. The blue line shows the annual economic growth whereas the orange bar charts show quarterly economic growth.
The Australian economy grew at an annual pace of 2.4% over 2017 which would have been disappointing for the Reserve Bank of Australia. In general terms household consumption and government spending boosted economic growth over that period while net exports were down along with a decline in housing and resource investment, both of which were drags on the expansion of the Australian economy over 2017. Interestingly, over the year to December, the value of goods and serviced produced amounted to AUD$1.8 trillion or about AUD$73,000 for each of Australia’s 24.5 million people.
Australia’s economy has expanded for 26 years without a recession.
Interest Rates
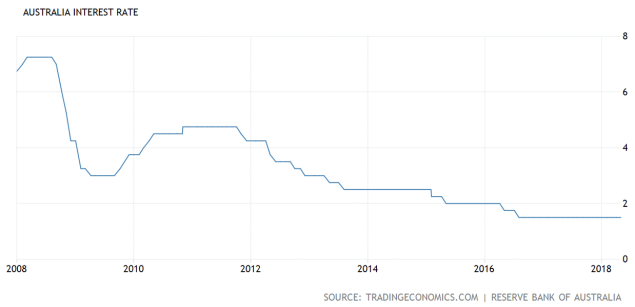
Interest rates without doubt remain on hold.
The Reserve Bank of Australia left the cash rate unchanged at a record low of 1.5% at its meeting in May which was widely expected anyway. Policy makers expect the Australian economy to grow slightly above 3% over 2018 and 2019, supported by positive business conditions and stronger growth in exports, even though the outlook for household consumption looks a bit uncertain due to high debt levels.
The labour market improvement appears to be slowing down with unemployment seemingly stuck near 5.5%. Employment growth in 2017 was 3.4%. The three month annualised employment growth in 2018 has slowed to 1.2%. Since falling from 5.9% to 5.6% through to December last year, the unemployment rate has made little progress since then.
Inflation
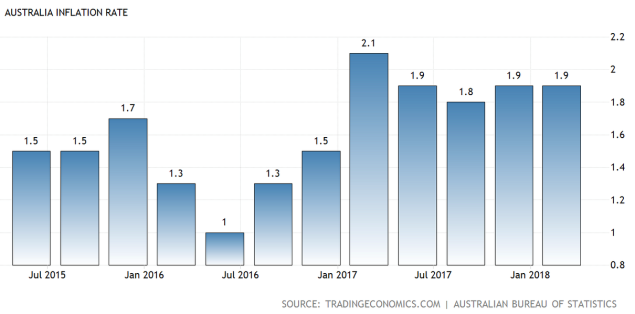
Inflation in Australia remains steady but more subdued than preferable as far as the Reserve Bank of Australia might be concerned.
The Consumer Price Index in Australia rose by 1.9% through the year to March 2018 which was the same as in the previous quarter and was slightly short of the market consensus at 2%. Main contributors appeared to be the cost of housing and transport that were a bit softer while the price of food seemed to rebound in Australia over that time.
The case for a rate hike in Australia would appear to be pushed further out into the future with inflation among other factors looking low and slow. As mentioned earlier, the labour market won’t be helping either with unemployment which seems to be stationary at around 5.5%.
Wages Growth
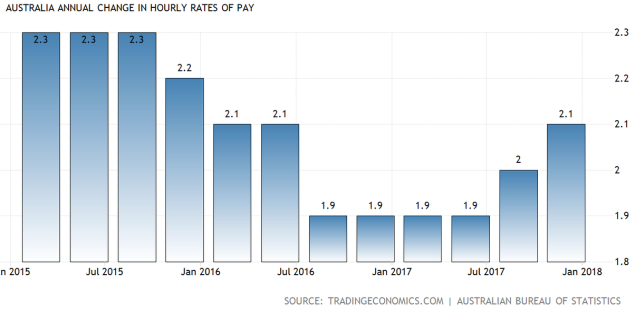
Wages growth improving slightly but remains sluggish.
With unemployment in Australia not improving much of late, there would seem little chance that wages growth will improve any time soon. This will weigh on the Australian Reserve Bank governor’s decision making around interest rate hikes in Australia in the future. Without declining unemployment eventually leading to wages growth, inflation in Australia may remain relatively subdued for a while longer.
Housing Prices
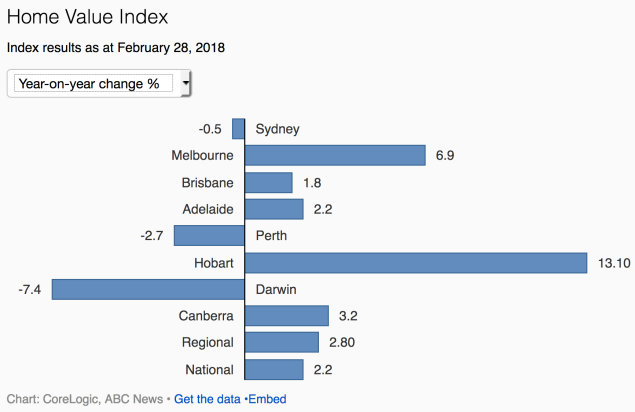
As at February 2018 market price movements for housing in Australia over the previous 12 months.
Like New Zealand, in Australia, property has been a favoured investment behind money in the bank for decades, however prices do not always rise in a straight line. Whilst some predict serious trouble ahead for property investors in Australia and property prices, I have the view that a more moderate slowdown is likely to unfold although it does depend on a number of variables. These variables include interest rates, supply and demand / immigration / migration and demographic shifts that may unfold in the fullness of time. As a point of interest, Robert Kiyosaki’s claim that housing in America would crash and burn in 2016 because baby boomers would be down selling proved to be a myth. The housing downturn in 2008 and 2009 in the US was caused by other factors, unrelated to baby boomers downsizing. Another example of a wild claim predicting the future – apparently that’s something that’s really difficult to do, still people try / pretend.
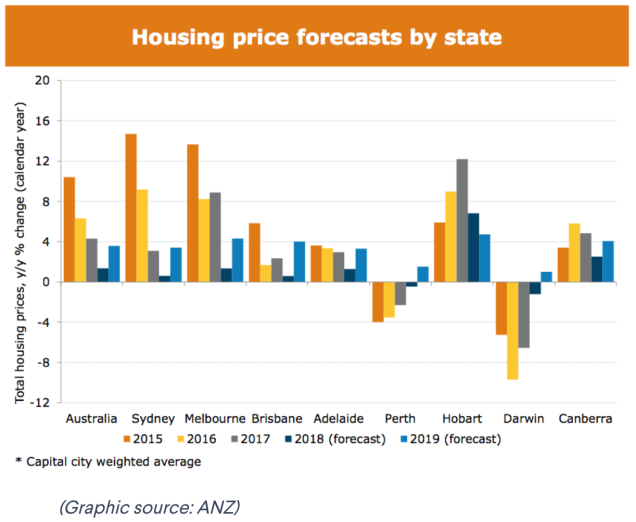
The above chart shows an April 2018 view of how things might look in the future.
In Australia it appears that first home buyers are replacing investors as tighter regulations governing the number of investor interest only loans allowed begin to impact. Interest only loans have been a favoured tool of many a property investor over the years not only in Australia and but also in New Zealand and the UK as well as Canada too. Whilst they may have a place, a portfolio of interest only loans relies heavily on house prices rising in order to make any ground long term.
Residential property is a good investment when it’s done properly. Otherwise costs such as insurance, interest and certainly maintenance costs could render some residential property investments no better than parking money up in the bank but with a lot more hassle. Anyway, in Australia first home buyers enjoy stamp duty discounts in New South Wales and Victoria which is another incentive for them to get involved in the housing market. Interest only loans though will take the edge off house price increases in Australia.
Unsurprisingly, property investors with interest only loans that are leveraged to the hilt, so to speak, will be sensitive to interest rate increases in the future. Luckily for them this would seem unlikely this side of Christmas. They have time to consider how they are positioned.
New Zealand
Dairy auction price
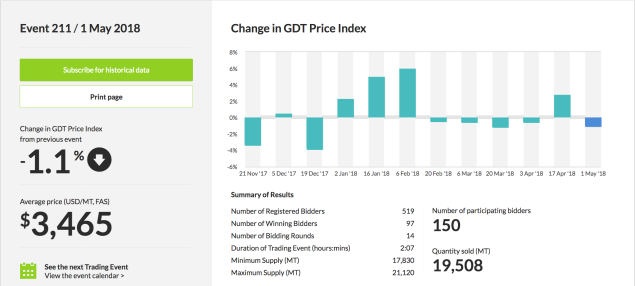
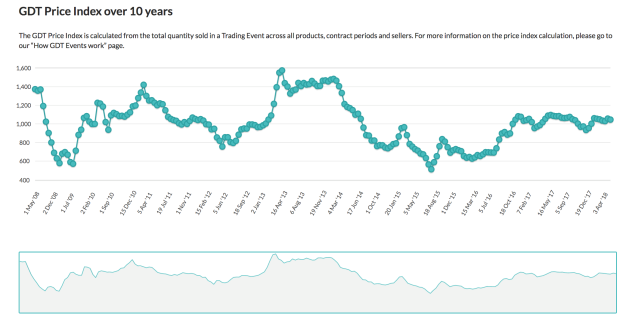
Milk price volatility continues.
Although the recent May 1 2018 auction was down, prices for dairy over April moved higher, up 2.7% over the month and 7% over the year. According to ANZ, one of the obvious influences seems to be sluggish European production across some of the larger export regions such as Germany, the UK, Netherlands and France. It appears that the combination of sluggish production in Europe and an uptick in demand from China and the Middle East has helped to push milk prices up over April.
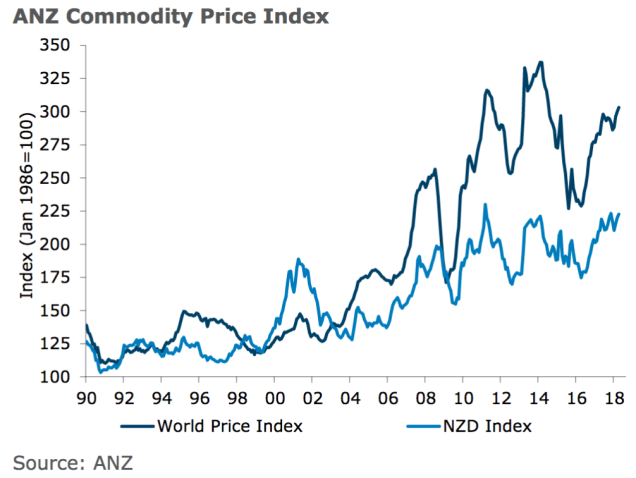
Commodity prices continue the long term trend in an upward direction.
Although forestry prices continued to move slowly higher (up 0.2% month over month) the aluminium sector saw aluminium prices jumping 8% from one month to the next on trade and global political tensions. It seems that China’s move to improve air quality has meant slowing down in production of Chinese aluminium which of course helps support prices elsewhere in the world. The real boost however came from US sanctions on Russia which cramped trade on one of the world’s largest aluminium producers.
Economic Growth (GDP)
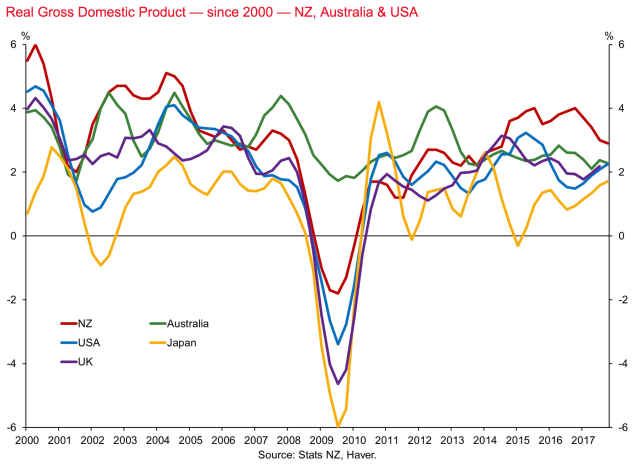
New Zealand’s economic growth (the red line) is tracking favourably.
The New Zealand economy grew by a slower than expected 2.9% over 2017 with the December quarter growth coming in at 0.6%.
Interest rates
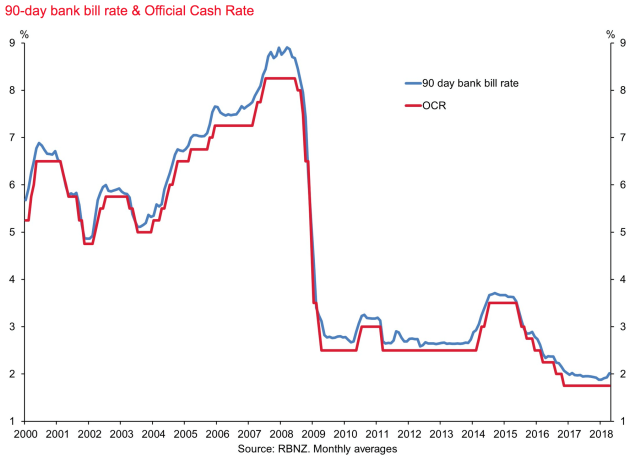
Note the official cash rate remains on hold however the 90 day bank bill rate is starting to move upwards.
The Reserve Bank of New Zealand by the way now has a new governor. Adrian Orr who was in charge of the New Zealand Superannuation Fund and in my view a smart and successful fund manager (they are a rare breed!) who I think will add real value as the new governor of the Reserve Bank of New Zealand. The official cash rate remained unchanged at a record low of 1.75% at the meeting on March 21 2018 as widely expected. The Reserve Bank takes the view that whilst global economic growth continues to improve, unsettled weather did impact materially on agricultural production recently. The central bank appears to be taking the view that monetary policy will remain accommodative for a considerable period of time because of numerous uncertainties that remain. At this stage it appears that the official cash rate may be on hold until around mid-2019 – time will tell.
Mortgage Rates
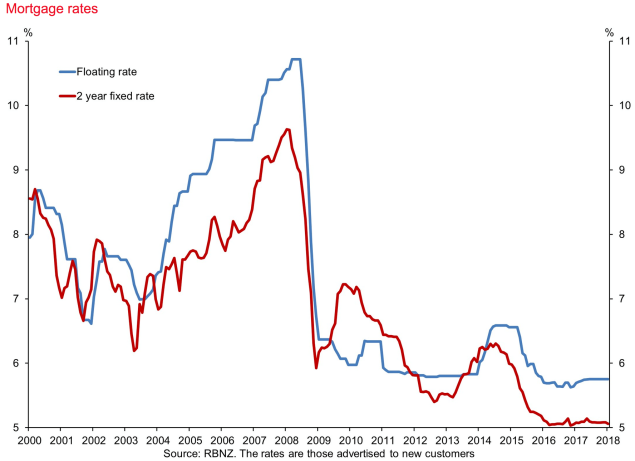
Note the floating rate is quite a bit higher than the two year fixed rate.
Mortgage interest rates vary across timeframes and are only partially impacted by the official cash rate. There are other variables that can impact on mortgage interest rates such as interest rate rises offshore. For example, the US Federal Reserve is on a path to raise interest rates until further notice. One would expect at some point that the higher cost of capital offshore will impact on borrowers in New Zealand.
This is particularly so given the fact that New Zealand’s economy is narrow and in theory more risky than other larger and broader based economies. This means that we pay more for our money here in New Zealand generally than people in other countries around the world. Of course there can be a time when interest rates in, for example, the US track higher than interest rates here in New Zealand, however I would expect an adjustment to take place to normalise interest rates at some point in that situation.
Anyway, the direction for interest rates is likely stable to an upward movement but slowly over a period of time. Staggered fixed rate maturities as usually is recommended for borrowers. Perhaps more importantly, it is important to resist the temptation to load up on one year or two year cheap rates just because those interest rates are the lowest. That could well be the winning tactic however it does rely heavily on nothing changing and that is unlikely to be the case. Better to have a staggered interest rate lock in maturity profile across the five year time horizon in order to maintain control (and avoid giving control to the markets and the banks).
Residential property
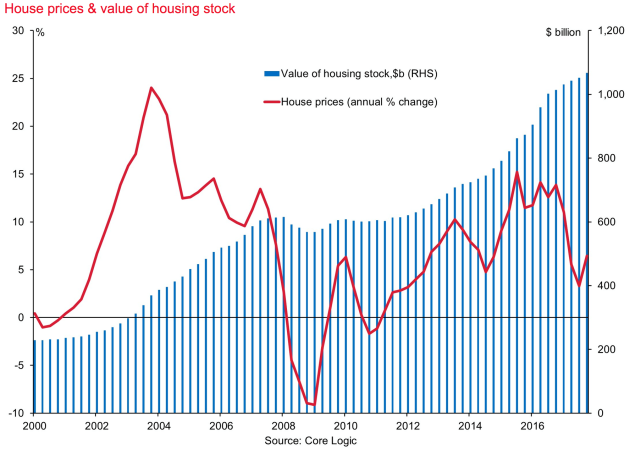
The value of housing stock continues to rise even though house prices are more volatile than some investors might have thought.
As we have seen in the past, prices rise in Auckland and eventually flow through to other main cities and then eventually to the regions. For the year ended March, Auckland prices declined by 2.2% finishing up at around $880,000 on average which was lower than the record price of $900,000 at the end of March 2017. In Wellington prices for the same period were up 10% to $583,000 (up from $530,000), Hawke’s Bay up 11.7% to $445,000 (up from $398,500) and Gisborne up 17.9% to $300,000 (up from $280,000).
Other regions that saw strong increases in price during March were Manawatu / Wanganui (up 12.3% to $292,000) and Otago (up 11.1% to $405,500). The REINZ House Price Index for New Zealand, which measures the changing value of property in the market, increased 4.2% year on year to 2710 – a new record high. The HPI Index for New Zealand excluding Auckland increased 7.2% from March 2017 to a new high of 2546. Auckland’s HPI increased 1.0% to a new high of 2909 for the same period. Although the good news is that we may need to wait for a while, however at some point it will be interesting to see what impact increasing interest rates might have on property prices next year. The other variable worth watching of course is immigration which also tends to be a key driver of property prices.
The New Zealand economy remains stable with economic growth running at a bit under 3% which is okay but not stellar. Because we are a narrow and to some extent vulnerable economy, it will be interesting to see how any trade tariffs should they eventuate impact on New Zealand. So far so good but let’s wait and see.
Property price rises have gone from appearing to move in an upward direction in a never ending straight line to being quite mixed depending on where you live. The regions it seems are enjoying price rises and the likes of Wellington city whereas Auckland and Christchurch for example are seeing either prices flat line or decline slightly.
We have a new governor of the Reserve Bank here in New Zealand which will be interesting. Regardless, it seems that interest rates won’t be rising fast any time soon and the Reserve Bank official cash rate could be on hold until mid-2019. It will be interesting to see what Adrian Orr brings to the table as the new Reserve Bank governor.
To Summarise
There has been a lot of noise about trade sanctions particularly between the US and China. Long story short, both countries know that they need each other and that trade sanctions are not a winning strategy. The trick will be how Donald Trump can position America to even out the unfair imbalance that currently exists between the two economies. Frankly he has a point.
The tax cuts in the US will help to support economic growth although the build-up in debt longer term will need some serious economic growth not only to service it but to even think about paying some of it back. For now though the US economy like much of the global economy is enjoying a period of slow but steady growth.
Europe also is heading in the right direction and China remains stable. Although most didn’t notice it, I noted earlier this year that China moved for the first time on the significant shadow banking time bomb that was just waiting to explode. Whilst they haven’t fixed anything as yet, they appear to be taking action and I imagine they will look to contain that issue more medium term.
Japan’s economy is showing steady growth although it is fragile but probably helped more medium term with activity relating to the upcoming Olympics in Tokyo in 2020 – let’s face it, it’s not far away!
Many commentators point to global debt as a significant problem about to blow up in all of our faces. I’m not convinced about that. I don’t believe that the level of debt is ideal or that the servicing of it is not going to a drag on economic growth in the future . That said, the debt is at a manageable level even though anyone who understands it wishes it were lower. I can’t predict the future but I would argue the central banks around the world have everything to lose and nothing to gain by allowing debt levels to severely compromise the global banking system for any length of time.
You may recall 2008 when the banking system stopped functioning at least three times that I am aware of.
Whilst it was a precarious time and a dangerous situation, common sense and logic prevailed. No guarantees for the future of course however with everything to lose and nothing to gain by allowing things to get out of control, I imagine governments and central banks around the world will pull together once again should the need arise.
Trade tariffs are potentially a tricky business as well although despite Donald Trump’s bluster, China appears to be adopting an even handed approach.
Whilst I’m not sure that it’s worth mentioning, it is news that North and South Korea are talking. Can Kim Jong Un be trusted?
Regardless, for you and I it’s business as usual and right now I don’t see an immediate “black swan” right in our faces but I will keep you posted …
“Question: Why did god create economists?
Answer: In order to make weather forecasters look good.”