Why is the Turkish Lira’s Sharp Decline a Danger for Everyday Kiwis?
Global Economic Update – August 2018

Peter Flannery CFP AFA
“If you have one economist on your team,
it’s likely that you have one more than you’ll need.”
Warren Buffett
The Global Economy

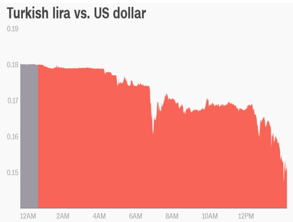
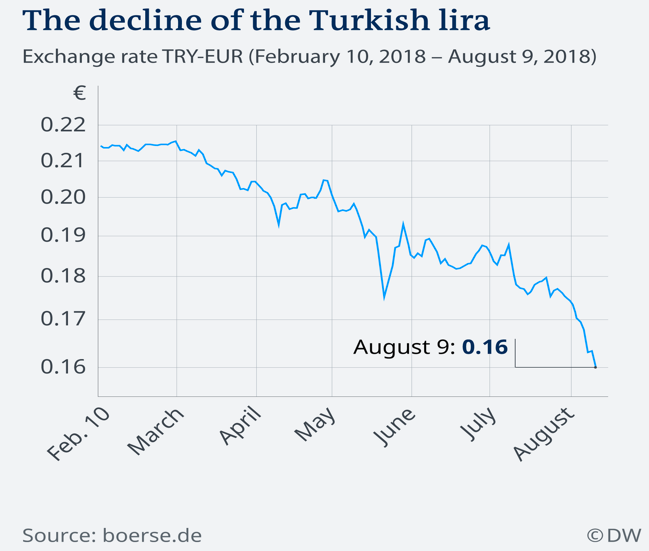
Turkey’s currency has declined sharply after Donald Trump’s announcement to impose trade tariffs on aluminium and steel out of Turkey.
Almost out of nowhere, it seems Turkey is suddenly in the news in a not so good way. The Turkish currency has plummeted by around 17% against the US Dollar. The market now worries that a number of European banks, that are exposed to Turkish debt, might be compromised as a result. The flow on effect from this (imagine one or two European banks defaulting), worse case scenario, could see the banking crisis and resulting credit crunch like 2008 suddenly re-emerge once again. The decline in the Turkish Lira and rising borrowing costs is an immediate headache for many Turkish construction companies, who have borrowed in foreign currency, even though they receive their revenue in local currency. Obviously, a declining Lira means any debt owed outside of Turkey has immediately become more expensive in a meaningful way. This is relevant because Turkey’s recent economic growth has been driven significantly by construction within the Turkish economy, which has largely been funded by offshore debt.
Why did the currency decline? The Turkish Government believes that American pastor, Andrew Brunson, was involved in the failed 2016 coup attempt in Turkey. Donald Trump wants him to be released. Mr Erdogan, Turkey’s President, refuses. So, Donald Trump announced that the US will be imposing trade tariffs on the aluminium and steel imported by the US.
Turkey’s economy, at around $860bln, is not huge and sits at around 6.5% of total Eurozone GDP. It is also a key NATO ally and is strategically important geographically, acting in some ways as a wedge between Europe and the gulf region for more than 50 years. Although I could always be wrong, I do not see this as the unravelling of the world economy as we know it, however the implications are potentially quite significant. I will keep you posted.
Elsewhere in the global economy, China and the US continue their trade tariff banter, with China so far not backing down. By the way, both the Chinese economy and the US economy appear to be growing steadily. Indeed, synchronised economic growth remains in place around the world currently.
Here are some of the risks that I outlined regarding the global economy at our recent Invercargill roadshow
Although the US Federal Reserve continues to increase the Federal Funds Rate, other countries are still working through, what I have termed, ‘deflationary funk.’ In other words, economic activity, whilst certainly positive, as measured by GDP, remains significantly supported by the liquidity bubble (high levels of debt, low interest rates and ongoing central bank support). We can say that the global economy remains stable, however we cannot say that the global economy is ‘out of the woods’ so to speak and home free. Not by any stretch of the imagination can we say that.
At the same time, I do not think we can say that the global economy is riding for a significant fall at any moment. Let’s face it, that idea has been promoted for the last five years or more and yet, the global economy remains as stable as it has been for a long time. Sure, levels of debt are high and yet, the global population continues to grow and economic expansion increases the ability of the economy to service a growing amount of debt. The debt is too high. That does not mean that economic Armageddon is around the corner, as many internet jockeys around the world would have us believe. Sure, economic events pop up and create uncertainty from time to time. That does not mean to say that someone who promotes an ongoing, negative scenario is right just because they say it long enough, that an event eventually emerges.
The global economy is supported by central banks but remains stable and continues to grow.
The United States of America
Economic Peaks
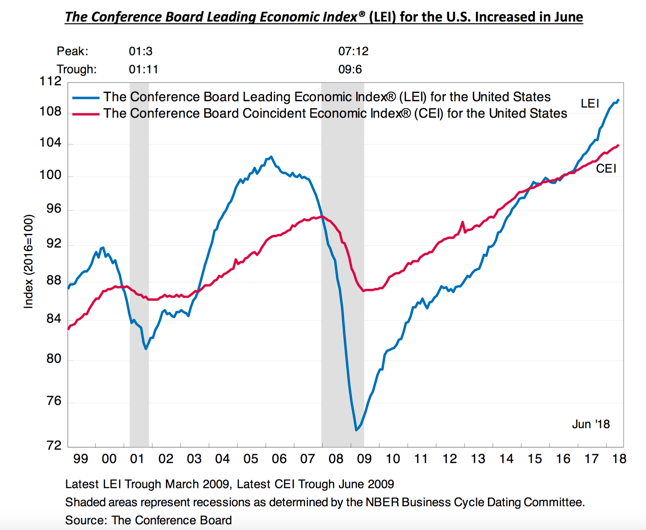
The above chart attempts to highlight economic peaks and shows this may not have been reached in the US yet.
The Conference Board Leading Economic Index for the US includes average weekly hours for manufacturing, average weekly initial claims for unemployment insurance, manufacturers’ new orders for consumer goods and materials, the ISM index of new orders, manufacturers’ new orders for non-defence capital goods excluding aircraft orders, building permits for new private housing units, stock prices based on the largest 500 common stocks, the leading credit index, the interest rate spread for 10 year treasury bonds less federal funds and average consumer expectations for business conditions. I know that was a bit of a mouthful, but I thought you might like to know what the index is based on.
Anyway, the Conference Board reckons that the US economy may peak around mid-2019. Time will tell.
Economic Growth
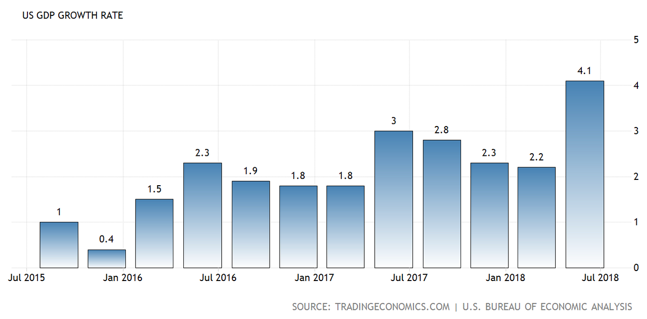
Economic growth in America just surprised on the upside.
The US economy grew by an annualised rate of 4.1% over the second quarter of 2018, which was well above the estimated 2.2% expansion previously predicted. This represents the strongest growth rate since the third quarter of 2014. It appears to be driven by increased consumer spending and soybean exports. Personal consumption rose 4% and contributed 2.69 percentage points to growth. Fixed investment added 0.94 percentage points to growth and residential property investment continued to decline slightly and therefore not contributing to economic growth. Exports, on the other hand, jumped 9.3%, with imports growing at a much slower pace. The net result was a positive impact at 1.06%, which was an improved number on the previous -0.02% in the first quarter and the highest contribution to economic growth since the last three months of 2013. Government spending and investment added 0.37 percentage points to growth.
Fed Funds Rate
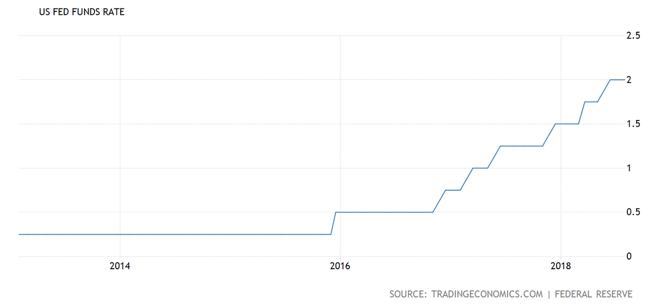
Interest rates in the US are tracking in an upward direction.
Although the US Federal Reserve kept the target range for the Federal Funds Rate at 1.75% to 2% during its August 2018 meeting, a number of economic indicators suggest that another rate hike in September is likely. Specifically, the labour market has continued to strengthen and also economic activity has been rising quite strongly. The unemployment rate has remained low, with household spending and fixed investment growing strongly. When determining the timing and size of interest rate adjustments, the Fed Committee usually assess realised and expected economic conditions relative to its maximum employment objective and its 2% inflation objective. Let’s all keep an eye out then for what the Fed has to say in September.
Inflation Rate
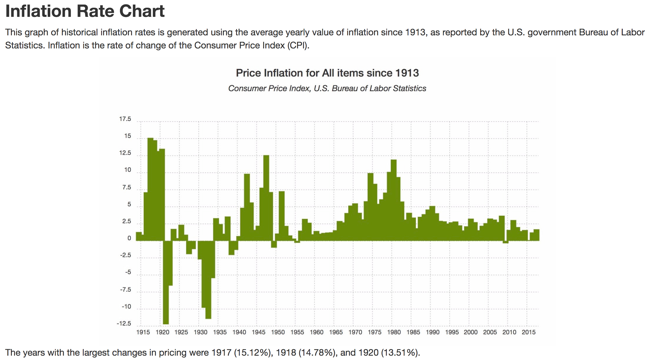
The above chart shows annual inflation year by year since 1913.
The impact of inflation is not always easy to see. Let’s take a look at the purchasing power of $20 since the year 2000 in the US. By 2010, it took $24.92 to buy the equivalent of what $20 could have bought in the year 2000. By 2018, it now takes $29.05 to buy what $20 could have bought in 2000.
Whilst we live in a period of relative deflation, nonetheless the impact of the rising cost of goods and services for us as consumers continues to grow and compound, even though we may not necessarily be aware of it. This is one reason why New Zealand’s favourite investment is the worst investment over time – term deposits in the bank.
US Inflation
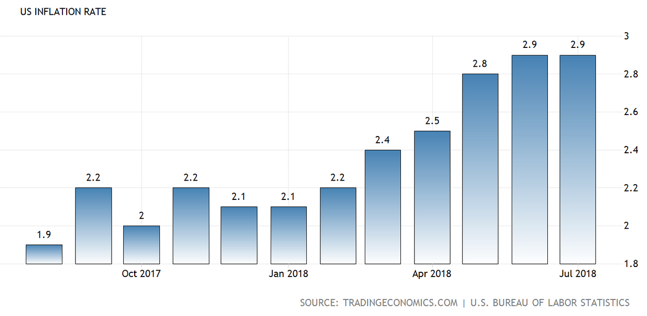
US inflation continues to rise but at a slow pace.
Inflation in the US stood at 2.9% in July 2018, mostly unchanged from the previous month and slightly below expectations of 3%. Still, inflation remains at the highest level since February 2012. The main upper pressure came from fuel oil (34.7% versus 30.8%), petrol (25.4% from 24.3%), shelter (3.5% versus 3.4%) and transportation services (4% versus 3.7%).
Meanwhile, food inflation remained pretty much unchanged at 1.4%, while prices rose at a softer pace for medical care services (2.3% versus 2.5%). By the way, core inflation, which excludes food and energy costs, rose 2.4% in July from 2.3% in June. It was the highest rate since September 2008.
Unemployment Rate And Wages Growth
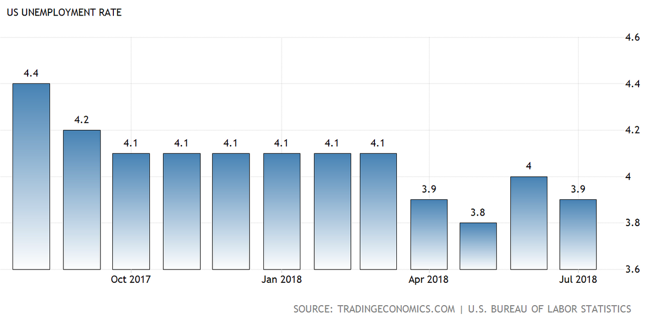
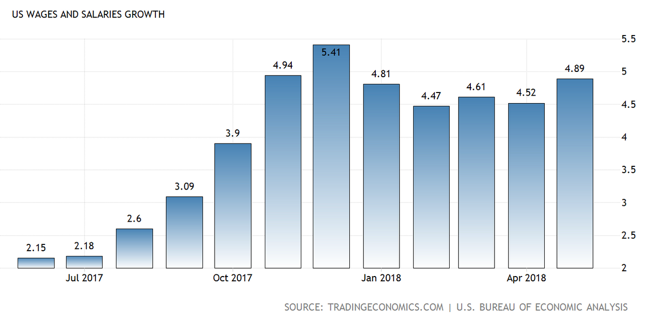
Unemployment or the US jobless rate, as they call it in the US, continues to decline (the top chart), with a small increase in wages growth (the lower chart).
As the top chart above shows, the US unemployment rate fell to 3.9% in July 2018 from 4% in June 2018, mostly in line with market expectations. This means that the unemployment rate reached an 18 year low of 3.8% in May. The number of unemployed people declined by 284,000 to 6.3 million and employment was almost unchanged at 156 billion.
The labour force participation rate was 62.9% in July and unchanged over the month and over the year.

Income inequality. Low unemployment does not equal wages growth.
Sluggish and uneven wage growth is one factor that has been suggested as a key driver behind widening income equality in the United States. For example, a recent study found that in 2016, Americans at the top tenth of the income distribution earned 8.7 times as much as Americans in the bottom tenth ($109,578 versus $12,523). In 1970, when the analysis began, the top tenth was earning 6.9 times as much as the bottom tenth ($63,512 versus $9,212). Other arguments suggest that the job mix or the pool of workers has shifted outside of the formally defined labour force, some of whom are neither employed nor seeking work. Also, general declines in the manufacturing and production sectors, with a shift toward growth in low wage industries, is another factor. Yet another reason is cited as the increase in the amount of employee benefits that are now being paid, thus having an impact on the level of actual wage or salary that is subsequently paid as a result. What we do know about this area is that no one seems to be able to agree on the cause of sluggish wages growth.
As you may know, rising employment or declining unemployment generally leads to wages growth, which means that everyday citizens get paid more, which contributes to increased spending and so the money cycle goes around. Wages growth though has been noticeably absent so far, as unemployment continues to decline in the US.
China
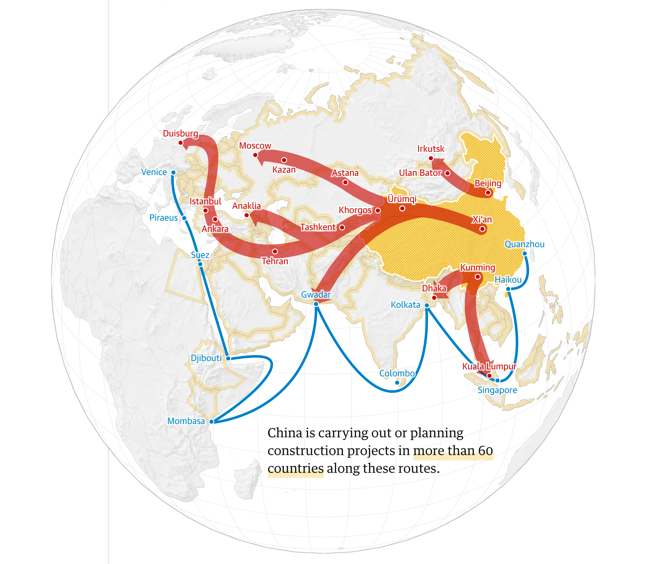
The above chart shows the land and shipping lanes that help make up the so called “belt road initiative”.
China’s belt road initiative, often described as a twenty first century silk road, is made up of a ‘belt’ with overland corridors and a maritime ‘road’ of shipping lanes. It has been described as a state backed campaign for global dominance, as well as a stimulus package for a slowing Chinese economy, as well as a massive marketing campaign for Chinese investment around the world. President Xi Jinping announced his grand plan to connect Asia, Africa and Europe in 2013. The initiative includes approximately 71 countries that account for about half of the world’s population and 25% of global GDP.
Increased trade globally, on the surface, has merit. However some are concerned that China may use its size and scale to gain control over smaller debt reliant economies by obtaining certain access to natural resources or, for example, silence on human rights issues when those smaller economies struggle or default on loans to China. This is just an example of one of the areas of controversy and what concerns the global community. I raise the belt road initiative to you in this update, just so that you are aware of it as something that we should all take into account as we think about China as a member of the global community and a major player in the global economy. The impact of the belt road initiative on economic activity will be interesting.
Economic Growth
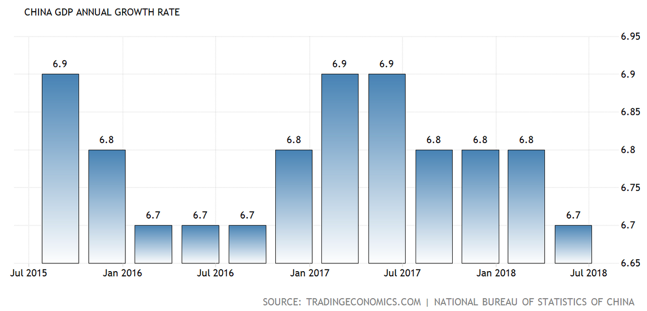
Economic growth in China remains relatively stable but has dropped slightly in July.
The Chinese economy grew by 6.7% year on year in the second quarter of 2018. This is a slight easing from 6.8% growth in the previous period and was in line with market projections. As it happens, this result was the weakest pace of economic expansion in China since the third quarter of 2016 and comes in the midst of an intensifying trade tariff battle with the US. For the first half of the year, China’s economy grew by 6.8% compared to the same period in 2017, as it attempts to deleverage debt and contain a number of financial risks inherent within the Chinese economy (eg shadow banking). The key drivers of growth include spending on construction, however other economic investments appeared to be weakening prior to the dispute with Washington. Also, some forecasters are expecting a slowdown since Beijing tightened lending controls last year in order to help rein in surging debt. It seems likely that action by Washington will cause the Chinese economy to slow down somewhat, although to what extent is difficult to gauge. China will be considering its range of options, one of which is to lower the Renminbi, which would counteract the impact of trade tariffs, however it would likely be met with a strong response from Washington.
Perhaps of greater concern for Beijing is the slowing domestic demand within China. Chinese leaders are looking to develop self-sustaining growth, driven by domestic consumption and to reduce reliance on exports and investment. Consumer spending has recently risen more slowly than planned, leaving economic growth potentially a bit more dependent on debt supported investment – less than ideal if that trend continues.
It is worth noting that only a small proportion of the threatened trade tariffs have actually been implemented. Some forecasters suggest if the trade tariffs are implemented by both sides, that could slow economic growth in China by 0.3 percentage points, which is not ideal for the Chinese economy but not a massive number. Also, as the Chinese have pointed out, the trade tariffs unilaterally started by the US, will impact both economies, not just the Chinese economy.
Industrial Production
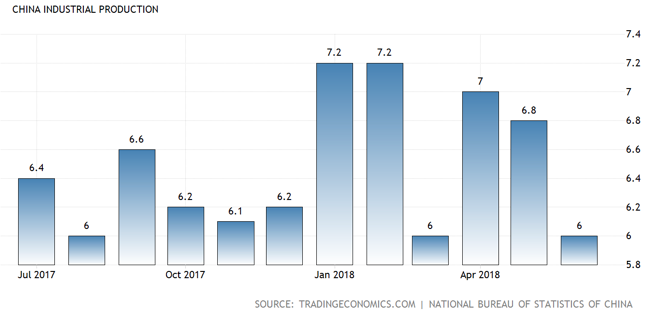
Purchasing Managers Index (PMI)
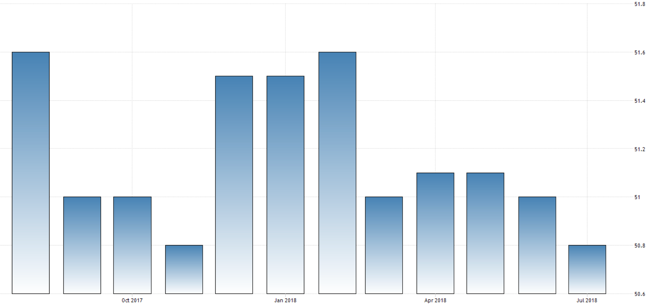
Industrial production growth (the top chart) declined, missing estimates. The Purchasing Managers’ Index (the second chart above) also declined.
Industrial production growth, whilst still a healthy 6%, for the year ended June 2018 declined from 6.80% year ended May 2018. The Manufacturing Purchasing Managers’ Index (PMI) remains above 50 (that means expansion = good) but declined to an eight month low in July. July’s decline mainly reflects some degeneration in outputs and new orders growth. Also, it is noteworthy that supplier delivery times decreased slightly too. New export orders, interestingly, steadied at low levels in July, probably reflecting the rise in trade tensions with the United States.
The level of sales at 15 major Chinese retailers fell by 3.9% in July from a year earlier. This raises some concern over whether Beijing can increase the reliance on a domestic economy and reduce reliance on the export side of the economy, given the intensifying US/China trade tariff tug of war currently underway. Retail sales were sluggish in July, however there was a 6.5% rise in cosmetic sales, which was one bright spot.
Interest Rates
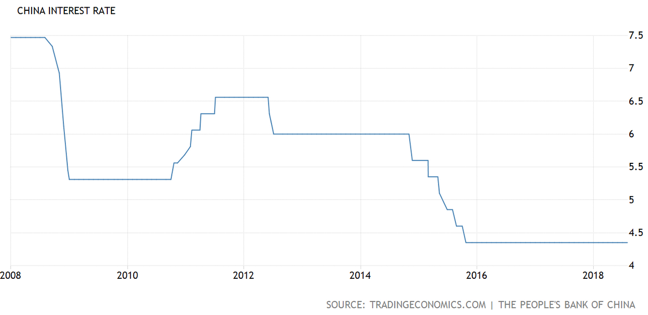
Interest rates in China remain on hold, not unlike many other countries around the world.
China’s interest rates have broadly followed the declining path of most economies around the world over the last decade and currently remain on hold. Although moving interest rates up or down will not solve all of China’s problems, they do have a buffer or ‘some gas in the tank’ so to speak in terms of being able to lower interest rates if need be. That said, China is a prolific user of all manner of macro prudential tools, of which interest rates are but one. That is partly why the Chinese economy remains relatively stable and continues to grow at the current pace.
The Chinese economy, as I mentioned, remains stable and whilst the potential trade war with the US could create a serious head wind for the Chinese Government and the Chinese economy, so far, whilst it is still early days, there has been minimal impact. Only a small proportion of the proposed tariffs on either side have actually been implemented. It will be interesting to see just how far America goes. As I mentioned at the Invercargill roadshow recently, because China exports much more to the US than the US exports to China, it would appear difficult for China to win a trade war by responding in kind alone. That is why they may look at other approaches, such as lowering the Renminbi against the US dollar, in order to negate the impact of trade tariffs and at the same time, make the Chinese manufacturing sector more competitive.
Europe
Currency woes could have a serious impact on the Turkish economy, potentially flowing across Europe.
It will be interesting to see how long the Turkish Government stands up to Donald Trump and the might of the US economy. Turkey is no match for America. Turkey is of interest to us though because the question must be asked around what are the flow on effects of the Turkish economy reversing its recent strong growth? Simply, the construction industry has supported Turkish growth over the last several years, which means that a reducing Turkish Lira equates to a sharp increase in the amount of debt Turkish companies owe but more importantly, the amount of servicing immediately required. To be clear, cashflow is usually the problem with debt, not the debt itself. A significant number of Turkish construction companies will be needing to find additional cashflow, to service what is now more expensive debt because the Lira has declined. As an aside, inflation in Turkey has hit nearly 16%, however the central bank in Turkey remains reluctant to raise interest rates in response.
New analysis by Berenberg Bank, however, does not see much impact long term of high Turkish inflation on inflation, with the corresponding low interest rates in the Eurozone on. They maintain that even if the Eurozone exports to Turkey were to fall by around 20%, this would reduce economic growth in the Eurozone by around 0.1%. Turkey’s annual GDP of $860bln (€750bln) is only 6.5% of the Eurozone’s economic growth, as measured by GDP. Some commentators suggest that even if exports from the Eurozone to Turkey dropped dramatically, previous experience shows that European companies are quick to identify and switch to new markets.
There is still the issue of Eurozone bank solvency to consider. One spokesperson from the International Monetary Fund (IMF) mentioned that the Europeans should have known that they should not lend to distressed banks (e.g. Turkish banks). He went on to say that this is one of the most important principles of the free market economy – if you lend money, you take a risk and must accept the losses. Whilst this may just be banter, this spokesperson is suggesting that the IMF will not be stepping in to save banks that get into difficulty because they lent money to Turkish banks. I suspect that if there is a danger that a European bank might default, the widening losses and the contagion effect of other banks being compromised because of it, is something that the IMF would be watching closely.
Economic Growth
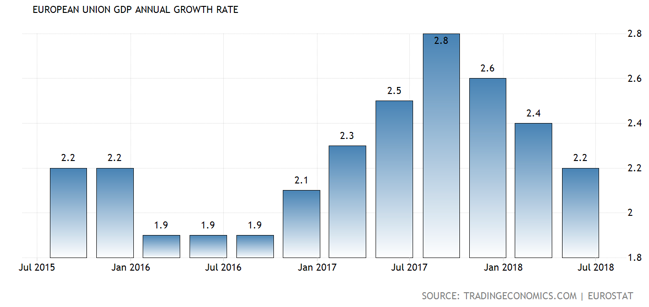
Economic growth, whilst slowing slightly, continues to track favourably.
The European Union’s economic growth expanded at a rate of 2.2% year over year in the second quarter of 2018. This is a slower expansion than the 2.4% growth in the previous period. Annual growth in the European Union, as measured by GDP, averaged 1.77% from 1996 until 2018, reaching an all-time high of 4.60% in the second quarter of 2000 and a record low of -5.40% in the first quarter of 2009. Among member states, the largest economies are Germany (29% of total GDP), France (20%), Italy (15%) and Spain (10%). Like most developed economies, household consumption is the main component of GDP and accounts for 56% of its total use. Low oil prices, low interest rates and an accommodative European Central Bank are all supporting European economic growth currently. We look forward to the day when economic growth is a function of productivity rather than ‘creative financial massaging.’
Eurozone Indicators
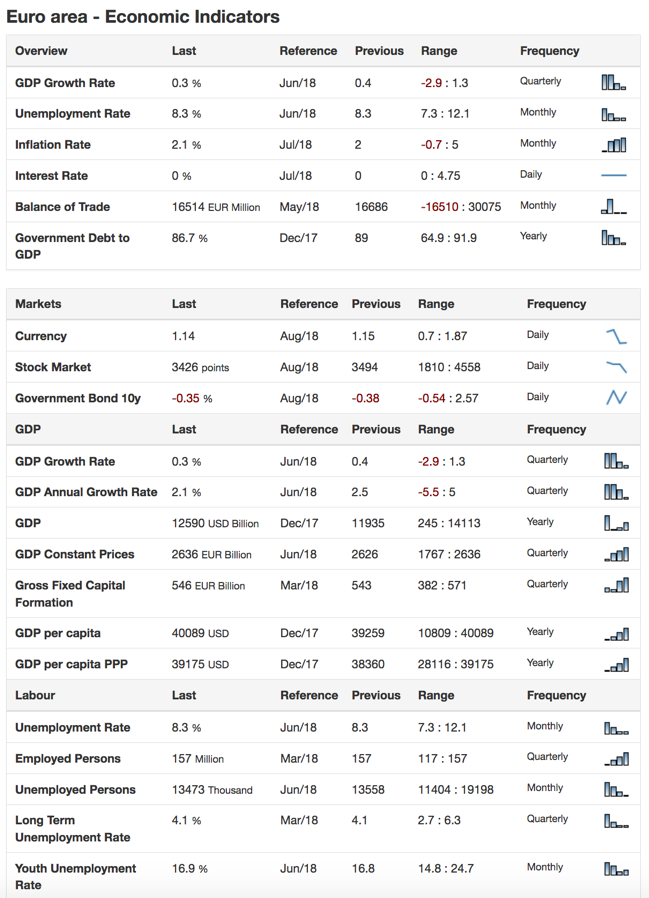
The Eurozone is generally stable, although supported by central bank intervention.
Although economic growth slowed down a bit recently, economic expansion, nonetheless, remains on track and positive. Unemployment is declining and inflation running at around 2.1% is at a level that the European Central Bank will not be too unhappy about. Interest rates, however, remain at zero, which is an example of the central bank intervention that are regularly mentioned throughout economic updates.
Interest Rates
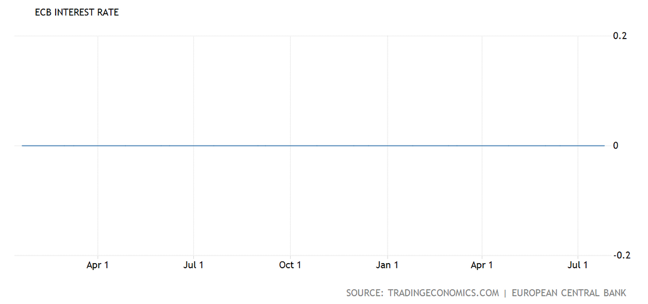
A funny looking chart, showing that interest rates remain at zero in the Eurozone.
Interest rates remain at zero because the European economy is still working its way out of the global financial crisis of 10 years ago (how time flies!). Simply, the economic structure and productivity of the Eurozone needs to improve significantly before interest rates can be normalised. Interestingly though, the UK (still part of the Eurozone, as we speak) recently increased interest rates, which looks like a brave move in the face of Brexit and sluggish economic growth.
Wages Growth
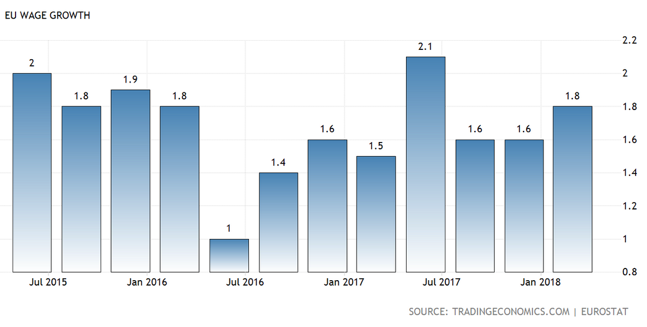
Like elsewhere in the world, wages growth remains stubbornly slow.
Wages and salaries per hour worked in the Euro area rose by 1.8% year on year in the first quarter of 2018, following a downwardly revised 1.6% gain in the previous period. Wages growth in the Euro area averaged 1.76% from 2009 until 2018, reaching an all time high of 3.40% in the second quarter of 2009 and a record low of 0.80% in the third quarter of 2010.
The European economy continues to remain stable, still supported by central bank intervention, low oil prices and low interest rates. Brexit, of course, has had minimal impact as yet. It is steady as we go in the Euro area for now. Turkey is something to watch, however indications are, it may not have a significant impact on the Euro area as a whole, although I suspect if a European bank is compromised, the impact could then be greater.
The United Kingdom
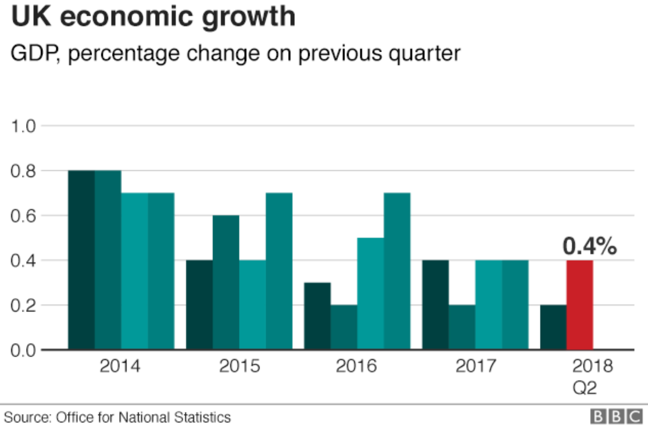
The above chart shows a useful and much needed jump in economic growth for Britain.
In Britain, the Office for National Statistics (ONS) showed that the economy grew by 0.4% in the second quarter of 2018, compared with the rate of 0.2% in the first quarter of this year. They note, however, that the underlying growth remains modest. Their information shows that the economy grew by 0.1% in June, down from a more robust 0.3% in the previous month. The service sector, which accounts for nearly 80% of the UK economy, grew by 0.5% in the second quarter of the year. Construction jumped by 0.9% but industrial production fell 0.8% during the period. Interestingly, the ONS also mentioned World Cup celebrations as a contributing factor to the pick up in growth.
Chancellor Philip Hammond stated that they are pleased to see the recovery of the economy in the second quarter and pointed to this number as an indicator of the fundamental strength of the British economy. However the ONS stated, quite correctly, that these quarterly movements may not reflect the underlying real trend in economic growth, which amounts to a trending slow down. Amusingly, Labour’s Shadow Chancellor, John McDonnell, stated (of course he would, being in opposition), that growth is anaemic, councils are going bankrupt and the National Health Service is now in a permanent crisis and get this … as well, “Holiday makers are being hit by the Tories falling pound.” The holiday maker issue sounds a bit like one of those ‘first world problems’ so to speak!
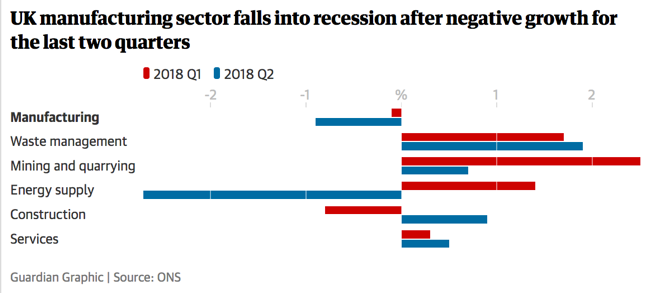
Two consecutive quarters of negative activity is a standard indicator of recession and not always a cause for alarm but certainly something to watch.
The manufacturing numbers in the chart above show that trade acted as a drag on economic growth in the second quarter. This suggests that there was no longer a boost for manufacturers from the weak pound, making sales of UK made goods, since the EU referendum, more competitive.
Imports and Exports
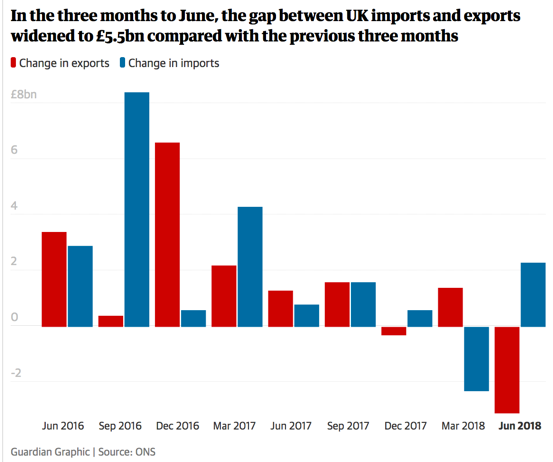
The gap between imports and exports widens in a not so good way.
Britain’s trade deficit (the difference between imports and exports) widened by £4.7bln, to reach £8.6bln in the three months to June, due mainly to falling exports of goods and higher levels of imports. Interestingly, these figures also showed the UK becoming more reliant on the European Union for trade. This is despite the efforts of ministers to seek out exporting opportunity elsewhere in the world. It appears that over the last 12 months, exports and imports of goods to and from the European Union, increased by more, compared with non-European Union countries.
Interest Rates
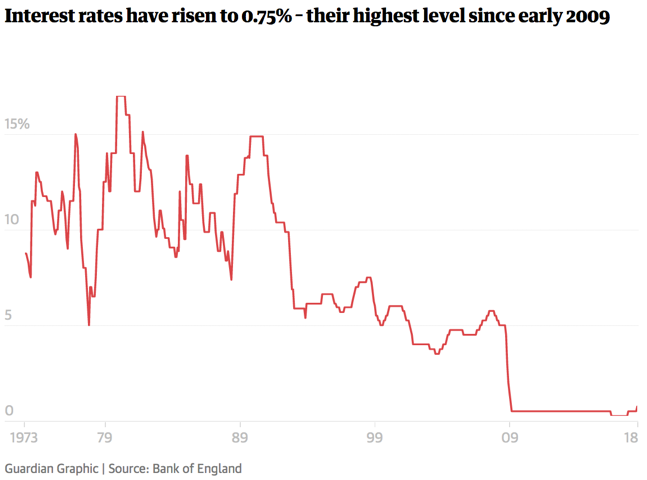
Interest rates rise in Britain (that small blip lower right on the above graph).
The Bank of England has raised interest rates above the emergency level that were lowered after the financial crisis 10 years ago. Mike Carney, the central bank’s governor, pointed to the lowest unemployment rate since the mid-1970s, that risks reigniting wage growth pressure. The rate, by the way, was increased from 0.5% to 0.75%. Mike Carney has suggested that if Brexit causes problems, they can look to adjust the rate again as necessary. Although nearly 70% of home buyers in Britain have fixed rate mortgages and will therefore be unaffected initially by the rate rise, other borrowers, including businesses, will pay more for their mortgages each month. Obviously, those with significant levels of debt and therefore debt servicing, may be impacted more so than those with lower levels of debt, who have their interest rate locked in for a period of time.
Britain’s economy has up until recently performed quite well, although lately the trend in economic growth has slowed, which moving into Brexit will be interesting to watch. The rise in interest rates, although not surprising given the reason for raising rates, could be reversed if economic activity does not improve in Britain. On the Brexit front, it seems that many in the UK are having second thoughts.
Japan
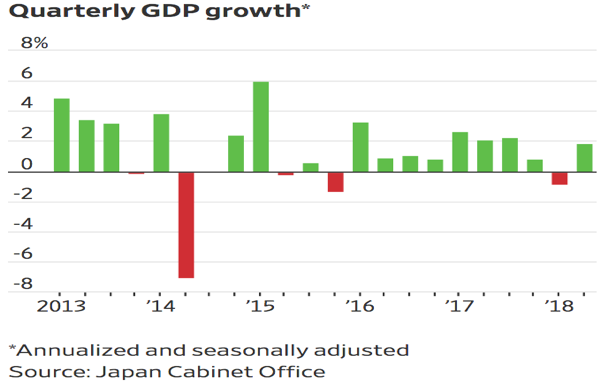
Economic growth picks up after a decline in the first quarter of 2018.
After declining in the first quarter of 2018, economic growth has picked up in the second quarter at an annualised pace of 1.9% after a revised 0.9% contraction (the red bar to the right of the chart above) in the first quarter.
Interest Rates
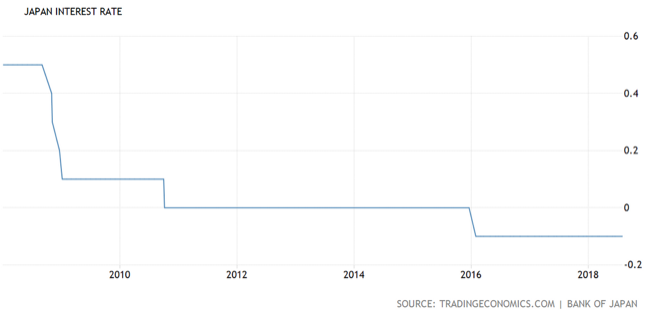
Note: interest rates remain negative (below zero).
The Bank of Japan left its key short-term interest rates unchanged at -0.1% and said they will keep interest rates extremely low for an extended period of time at its July 2018 meeting. At the same time, the Bank of Japan kept its 10-year government bond yield target at around 0% but said the yield could fluctuate depending on economic developments.
Inflation
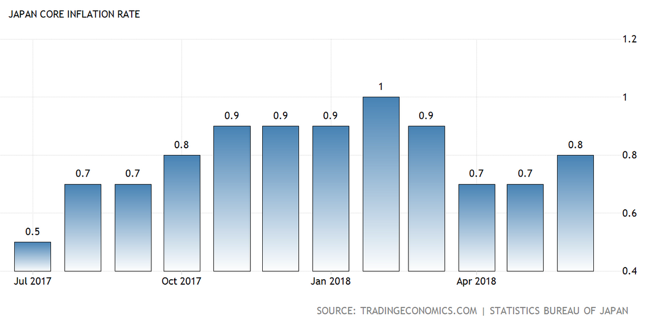
Inflation in Japan remains subdued.
Japan’s core inflation rate, which excludes fresh food, rose to 0.8% in June 2018 from 0.7% in May and was largely in line with estimates. This uptick in inflation offered some relief for central bank policy makers, who continue to struggle with the ongoing impact of prolonged, deflationary forces delaying economic recovery.
However, that slight uptick could be short lived because it appears to be due largely to recent gains in oil costs, with the prices of other goods barely picking up. The short of it is that this indicator underscores the significant challenge the Bank of Japan continues to face in hitting its elusive 2% target.
The Japanese economy continues to struggle along, supported significantly by central bank intervention and the strong use of macro prudential tools, to help support the economy and hopefully, one day, return it to sustainable economic growth.
Australia
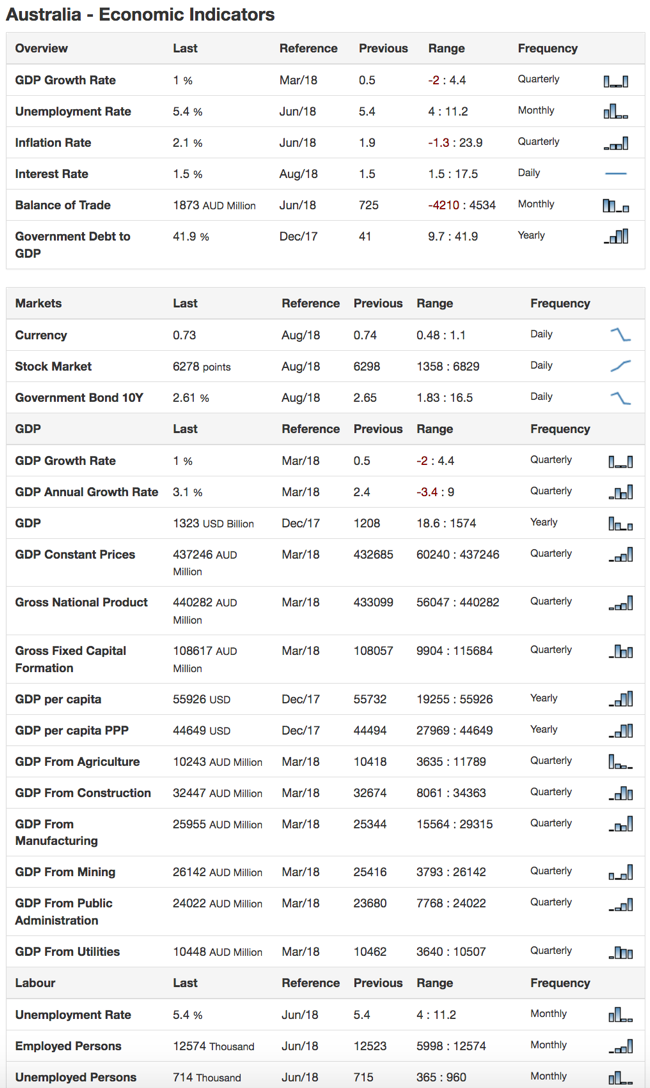
Australia continues to track reasonably well.
Although mining can make up a significant proportion of economic activity, the downturn in mining globally and the subsequent positive economic growth in Australia since then is testament to the fact that Australia is more than just a mining economy. Australia’s economy is dominated by the service sector, which makes up 65% of total GDP in Australia. Interestingly though, its economic success, prior to the global financial crisis, was based on mining, which represented 13.5% of economic activity in Australia. Agriculture, by the way, represents 2% of GDP, as the country is now a significant exporter of commodities. Manufacturing and construction together represent a bit over 20% of economic activity in Australia.
Economic Growth
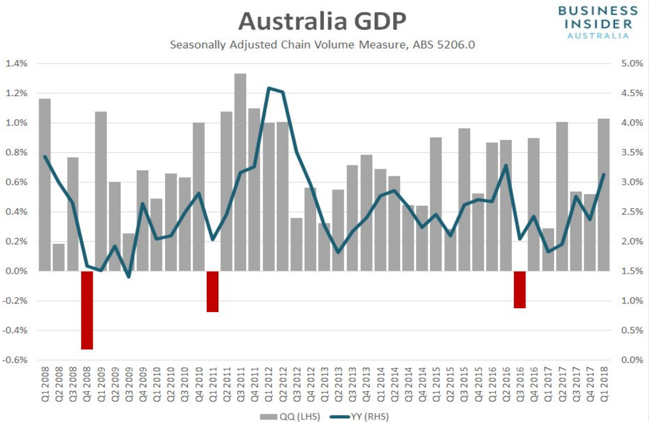
Economic expansion in Australia continues.
The Australian economy grew by an annual rate of 3.1% in the first quarter of 2018, following a 2.4% expansion in the prior quarter. The main contributors were household consumption, government demand, stronger exports and an increase in business inventories. The Australian economy is not booming but is certainly demonstrating sustainable economic growth. Indications are that economic expansion in Australia may sit at around 2.75% to 3% per annum over the next several quarters.
Interest Rates
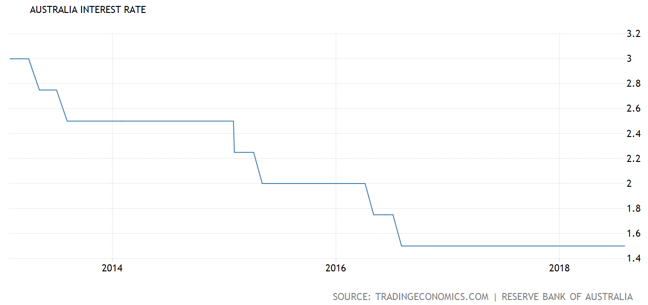
Interest rates in Australia remain on hold.
The Reserve Bank of Australia left the cash rate unchanged at a record low of 1.5% for two years running at its August meeting. This is the longest policy pause in the central bank’s recent history. Sluggish inflation and wages growth are two key contributors to interest rates remaining on hold.
Unemployment
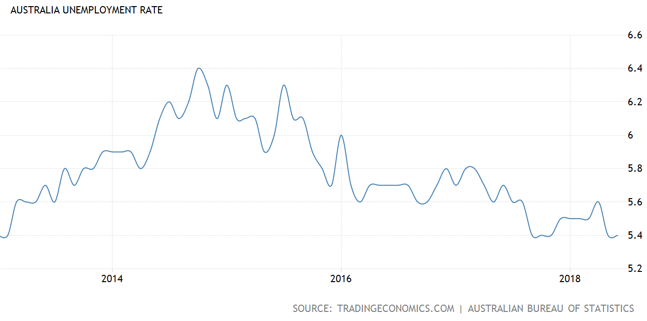
Unemployment in Australia continues to decline.
Australia’s seasonally adjusted unemployment rate stood at 5.4% in June 2018, the same as in the prior month and in line with market consensus. This is the lowest level since last November, as the economy added around 50,900 jobs, while the number of unemployed climbed by 1,100. A lower unemployment rate ideally should at some point put pressure on wages to grow.
Wages Growth
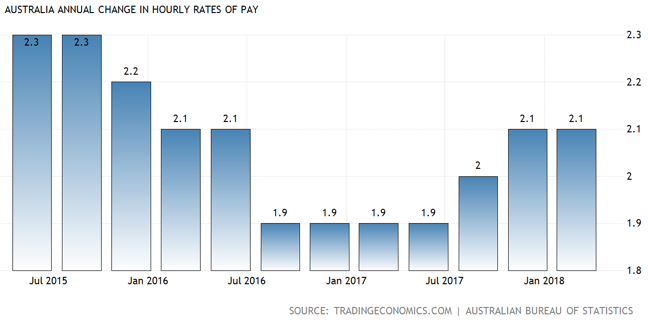
Wages growth remains sluggish, like other economies around the world.
Australia’s seasonally adjusted wage price index rose 2.1% year on year in the quarter ended March 2018, the same as the prior quarter. Like many other developed economies, wages growth remains stubbornly slow, despite declining unemployment.
Property Prices
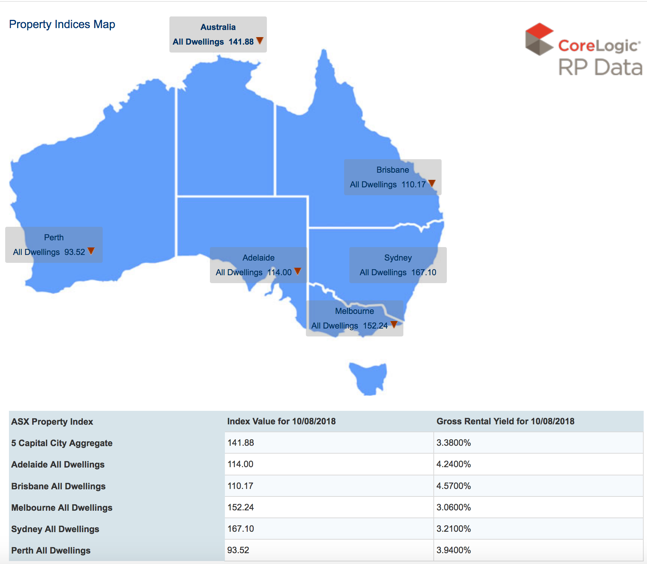
Property prices decline in Australia. Note: the gross rental yields all below 5%.
Property prices across Australia are generally declining, although this would appear to be a natural market adjustment, as opposed to an all out property crash. It is interesting to note that in Australia (this is likely to catch on in New Zealand as well, as New Zealand banks are mostly Australian owned banks), the easy lending conditions of the past are disappearing. For example, there is much greater scrutiny of borrowers’ bank accounts, in order to establish spending patterns. In short, it is more difficult to borrow money in Australia, as those easy leaning conditions of the last 30 years or so come to an end. NZ will likely follow.
Auction Clearance Rates
Auction clearance rates decline.
In April this year, the media made a big noise about auction clearance rates declining in Sydney by 58% and in Melbourne by 65%. The inference by the media, of course, was that a property crash was imminent. Indeed, it must be underway already! The reality is that short term data does not always reflect longer term trends. Indeed, those numbers were nonetheless significant and worth being aware of, however the increases in net migration ($250,000 for the year to September 2017) is helping to support property prices to some degree.
The Australian economy continues to grow, supported in part by synchronised global growth. Property and construction are important to the Australian economy and with banks imposing tougher lending conditions, the property slow down eventually will reach an end point as the market normalises. This may take quite some time as interest rates in Australia remain accommodative, which of course helps to underpin still high property prices.
New Zealand
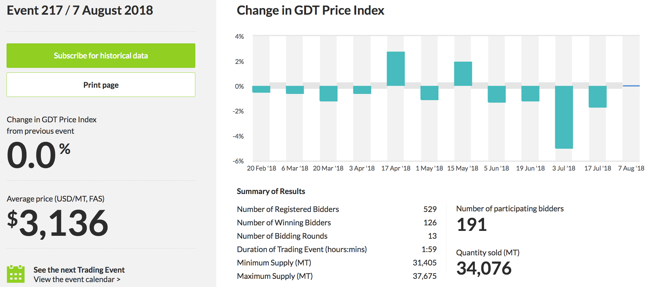
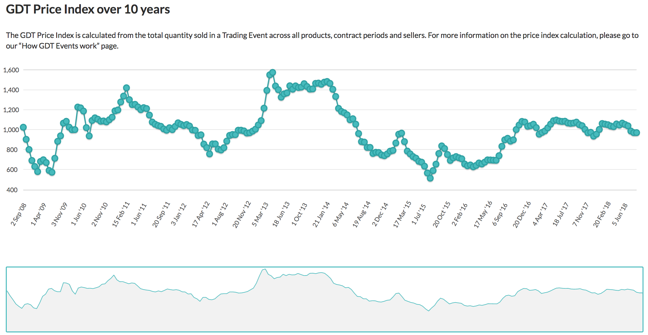
Ongoing volatility but mostly below the line, i.e. negative.
The 6.5% month on month fall in dairy prices created most of the weakness in the dairy price index, which is down 7.1% on 12 months ago. All five dairy components declined, with butter prices leading, down by 8.9% month over month. It appears that increasing inventory levels, particularly in China, and solid domestic milk production, supported by good weather conditions, has helped create the current price volatility. There still seems to be good demand for whole milk powder, which may help limit further downside in the short to medium term.
World Prices
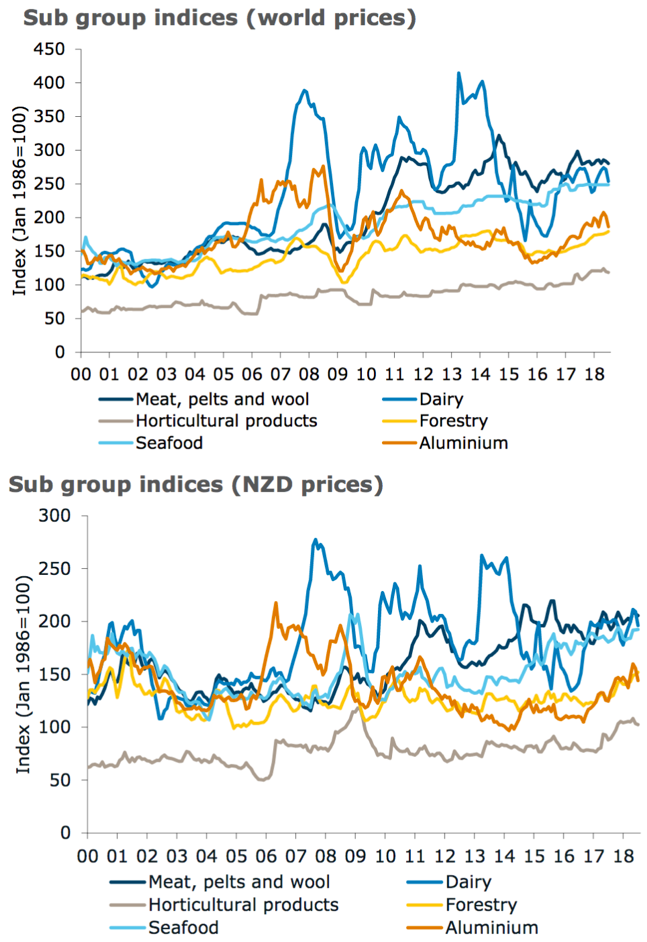
Look closely at both charts to see the difference in the top chart world prices and the bottom chart New Zealand Dollar prices.
Commodities are typically highly volatility because they are not capital assets but rather commodities relying on supply and demand. Simply, where there is demand, the price of that commodity will rise and where there is limited or no demand, the price will fall. Interestingly, meat and wool are having a good time at the moment (see the black line on both the top and bottom charts above).
Economic Growth (GDP)
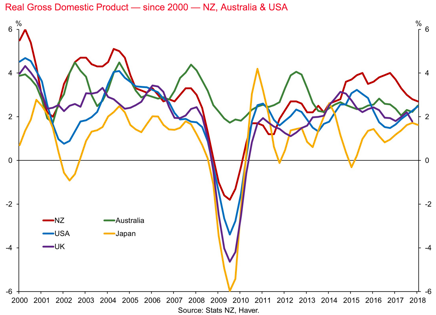
Economic growth in New Zealand appears to be slowing.
Economic growth in New Zealand, as measured by GDP, rose 0.5% in the March quarter. This is followed by a 0.6% increase in the December 2017 quarter. This quarterly number equates to an annual economic expansion in New Zealand of 2.7% for the year ended March 2018. Construction appears volatile, however growth in services appears to have offset the volatility in the construction sector. Notably, construction appears to be slowing down, with a 1% decline over the March quarter and a lacklustre increase in activity of 1.4% over the year. We await the release of the second quarter data, to see where that trend in economic growth is heading.
Mortgage Interest Rates
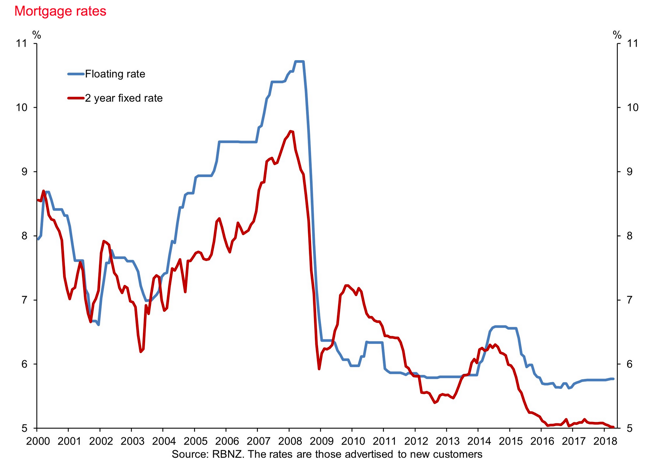
Note the gap between the floating rate and the two-year fixed rate. Note also that the bottom axis starts at five and not zero.
Interest rates in New Zealand remain accommodative, with the new Governor of the New Zealand Reserve Bank, Adrian Orr, maintaining an on hold position. Interestingly, he noted that the on hold position could be in place until 2020 (although of course subject to change, depending on market conditions). This provides a relatively stable period ahead for interest rates, taking into account the fact though that interest rate rises can also be caused by the bank’s need to source funds for lending from outside of term deposits, by going offshore. Interest rate rises offshore will have an impact, as will economic conditions. The more risky offshore financial institutions believe the global economy to be, the more they will charge to lend money out to borrowers. To be clear, lending institutions do not often lend money unless they believe they are being properly compensated for the risk. The point here is that it is not just the Reserve Bank of New Zealand that determines the interest rate on mortgages.
New Zealand Residential Property
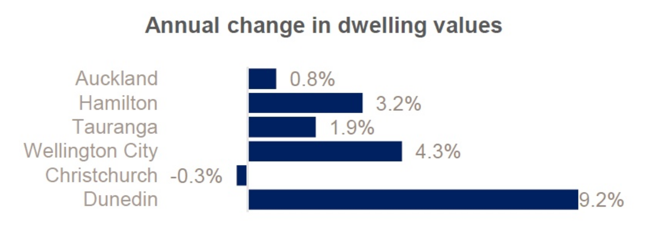
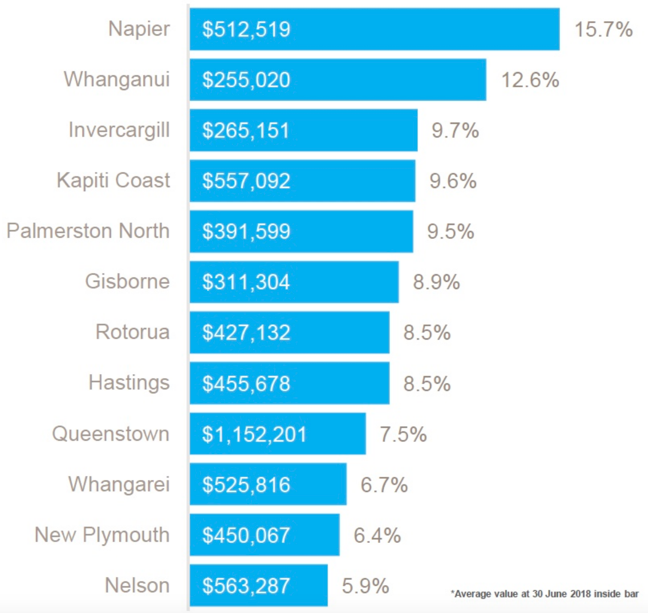
Note the provincial areas showing reasonable growth, whereas some of the main centres (except Dunedin) slowing down.
Residential Property in New Zealand remains somewhat of a ‘mixed bag’ in terms of price rises. Auckland is showing strong growth but more recently has backed off, whereas a number of the provincial areas are now picking up the pace. It is difficult to see any sign of a massive correction in property. The majority of mortgage holders have interest rates locked in and so any sharp change in interest rates in an upward direction, would have no impact immediately and give mortgage holders time to adjust. The Australian banks are tightening up on their lending criteria and this will flow across here to New Zealand, to include the likes of tighter scrutiny over interest only loans and more in depth analysis using customer bank statements of personal household expenditure. Lending conditions are getting tighter, which means that those at the margin will find it increasingly difficult to obtain bank finance. Even those who have strong equity now have no guarantees of being able to obtain a loan without the necessary cashflow to support the servicing and repayment of the debt. Immigration has slowed down somewhat but nowhere near the election banter that was proposed by Winston Peters. Nonetheless, the slow down, along with tightening lending criteria will have some impact on property prices in the future. The cynics may argue that once again, those that are well positioned (the so called “rich”) get richer while those less well positioned (the “poor”) get poorer. Mind you, it is nothing that some real hard work and disciplined savings cannot eventually resolve.
The New Zealand economy remains steady, however economic growth appears to be easing back slightly. It will be interesting to see where economic growth sits after a couple of years of the current government and the spending spree that is currently underway. Interest rates now, all things equal, appear to be on hold until perhaps 2020, although we will need to keep an eye on global conditions, which can also impact on interest rates.
To Summarise
The rhetoric between China and the US around trade tariffs continues. Whilst the implications, if you listen to the mainstream media, are serious, it is worth bearing in mind that most of the trade tariffs are proposed and have yet to be implemented. However, we have already seen one exporter to Iran be caught in the middle of the recent sanctions imposed there, although it remains to be seen how widespread any impact for New Zealand would be. It will be interesting to see how this plays out given the disproportionate trading between the two countries, meaning that China has limitations on how much impact any trade tariffs it might impose because it exports significantly less to America than America exports to China. China in theory could simply run out of goods upon which to place tariffs on (but it won’t be that simple)!
As I mentioned last quarter, tax cuts across the US economy are impacting positively (thank you Donald Trump!), however longer term, these tax cuts will need to be paid for somehow. Hopefully that is through increased economic expansion, which if the most recent report is anything to go by, could be underway, surprisingly.
Europe continues to be heading in the right direction, still supported by low oil prices, low interest rates and central bank support.
China also remains economically stable, although it will be interesting to see how trade tariffs, if and when imposed on China, will impact on economic growth there. They may need to think outside the square if they are going to take on Washington. One example could be to lower the Renminbi, in order to help offset the impact of Washington imposed trade tariffs.
Japan’s economy continues to struggle along. The Japanese Central Bank continues to support the economy with massive quantitative easing, that remains in place. Progress in Japan is VERY slow.
The Australian economy remains relatively steady and the New Zealand economy also is steady, however business sentiment has declined quite a bit over the last few months and we are seeing a slight but noticeable slow down in economic expansion. Is this the start of more to come?
Global debt is at a high level and not desirable. You and I cannot do anything about it, except of course position ourselves by keeping debt at sensible levels, based on a worst-case scenario rather than a best-case scenario and also investing in quality assets rather than popular assets. Global debt is manageable at these levels and whilst I can always be wrong, it remains difficult to see the much talked about economic catastrophe emerging anytime soon because of those high debt levels (that “trigger” will emerge from elsewhere). The high level of debt though may amplify an unexpected economic event.
I talked about those ‘grey swans’ in the presentation I delivered at the Invercargill roadshow recently. You can review them again if you like by clicking the link at the start of this economic update (page one, right column), however as I have mentioned previously on the odd occasion …. right now, it is a case of steady as we go.
“Ask five economists and you will get five different answers, six if one went to Harvard University.”
Edgar R Fiedler