Markets Remain Volatile
Market and Economic Update – Week Ending 19th October 2018

Peter Flannery CFP AFA
“If you have one economist on your team,
it’s likely that you have one more than you’ll need.”
Warren Buffett
MARKETS REMAIN VOLATILE – OF COURSE
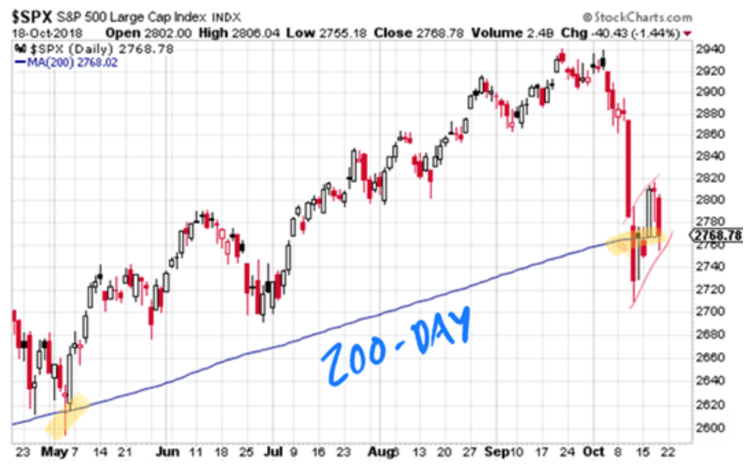
The above chart shows the movement in the S&P500 large cap index.
The US markets started to bounce back until last Thursday, when the market became uncertain once again. Although we have seen much larger declines in the past from time to time, nonetheless this type of volatility at this level (approximately 6% decline) does rattle the market and the uncertainty does not always melt away quickly. Bear in mind, of course, that the market is a random walk, with no plan. The share traders will tell you that the market needs to see those jagged lines solidly moving in an upward direction, to know that everything is going to be okay (“The trend is your friend.”)
The US markets have powered onto higher levels lately, making new records, whilst most other markets around the world have been flat or indeed, like China, declining at a reasonable pace. Anyway, US stocks fell more than 1% on Thursday as the European Commission issued a warning regarding Italy’s budget – you may recall that I canvassed Italy’s situation in some depth last week .
Also, the markets have become concerned about the possibility of strained relations between Saudi Arabia and the United States. Then, there is an old favourite from way back, that has been with us for some time, which is rising interest rates. Indeed, the spike in US treasuries a couple of weeks ago is what started the current share market correction. More recently, we have seen the US Federal Reserve receive strong criticism from Donald Trump about its ongoing plan for further interest rate increases. You may recall that I mentioned some months back, that rising interest rates would inflict some pain on certain factions of the market – I suspect this has only just begun.
US – Saudi relations are under the spotlight because there may be greater tensions if the Saudi leaders are found to have been connected to Khashoggi’s disappearance. This is the journalist that walked into an embassy and mysteriously appears to have never exited (at least under his own steam, so to speak). The implication here is that strained relations between the US and Saudi Arabia could lead to sanctions, which in turn could restrict oil supply and potentially prompt a rise in energy prices.
So, Italy remains in the spotlight, the trade war (so-called) and the rhetoric around this issue continues. There is the strained relations potentially between Saudi Arabia and the US and our old friend rising interest rates. It sounds all very negative, EH!
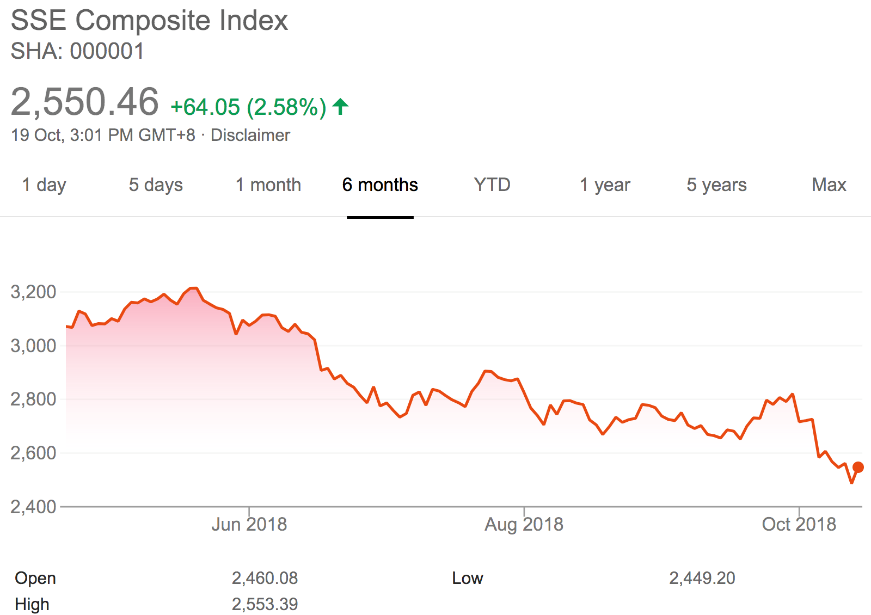
The above chart shows the steady decline in the Chinese Shanghai stock market index, as this market tracks lower and lower.
China’s economy, whilst stable, continues to show ongoing signs of slowing economic growth. Recent data shows that third quarter growth in China was hurt by the weakest factory output since February 2016, as automobile manufacturers reduced production by over 10% in the midst of a sales slowdown. The weakness appears to be coming mainly from manufacturing generally. I suspect we will see a review of fourth quarter forecasts in due course. Also, economic growth slowed down to 1.6% for the quarter, down slightly from a revised 1.7% in the second quarter but meeting expectations. Many economists were expecting China’s full year growth to come in at 6.6% this year, which would comfortably meet the Chinese Government’s 6.5% target (and the 6.3% target for next year). However, there are some indications that growth is slowing faster than expected in China. By some estimates, economic growth as measured by GDP could slow to somewhere between 6.0% and 6.2% next year.
The so-called ‘trade war’ between China and the US continues, with plans for bilateral trade talks to resolve the dispute having stalled recently. This is partly what triggered the Shanghai composite index decline and continues to put some pressure on China’s already slowing economy and weakening currency. At the same time, infrastructure investment rose 3% for the 12 months ended September 2018. Also, retail sales rose 9.2% in September from a month earlier, which was a bounce back after several months of lack lustre growth. Regardless, the Chinese Government appears very focused on their target of 6.5% economic growth for the end of 2018. As mentioned last week, the People’s Bank of China announced a fourth reserve requirement ratio cut this year, increasing moves to lower financing costs and help stimulate growth in the Chinese economy. In my view, China will do whatever it takes to support economic growth in their economy and are well versed in the use of macro prudential tools that support and stimulate economic activity in China.
US 10 year treasuries
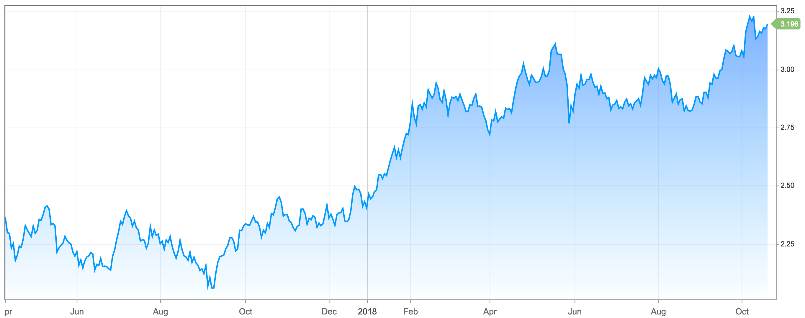
The above chart shows US 10 year treasuries.
As you can see from the chart above, 10 year US treasuries have eased back from the spike of two weeks ago but appear to be continuing to rise. The yield on the benchmark 10 year treasury note was higher at around 3.196% recently, while the yield on the 30 year treasury bond was higher at 3.378% as well. Also, the yield on the two year treasury note returned to levels that have not been seen since 2008, rising above 2.912% last Friday afternoon.
The minutes of the Federal Reserve’s September meeting were released last week, showing that officials have been discussing plans to continue with the planned rate hikes (Donald Trump will not be pleased!), with some members even suggesting there could come a time when the committee could go beyond the neutral level of interest rates, in order to implement a more restrictive policy to keep inflation under control. The stock market will not be pleased with this news, which means that we as value investors are pleased (lower process = better buying)!
Meanwhile, back in New Zealand, annual net migration continues to fall from record levels last year. Net migration was 62,733 in the year ended 30 September 2018, down from 63,288 in August and 70,986 one year earlier, according to Statistics New Zealand. Departures have actually increased 9.3% to 66,249, which is the highest number for a September year since 2013. Migrant arrivals, however, have slipped 2% to 128,982. One of the factors apparently driving these numbers is departures of non-New Zealand citizens to areas other than Australia. This may be a reflection of the increase in arrivals of those on temporary work and student visas that we saw in previous years. This, of course, is important because New Zealand’s strong inbound migration has been a key contributor to economic growth in recent years. Although slowing down, the current level of immigration remains a tailwind for the New Zealand economy for the rest of 2018 at least.
China gave New Zealand the biggest boost to tourist numbers, up 11% or 45,200 to 452,944 in the year ended September 2018. Australia still provides the largest number of visitors at 1.47mln, which is up 0.5% from September 2017.
