Interest Rates to Drop Lower Still!?
Market and Economic Update – Fortnight Ending 9th August 2019

Peter Flannery CFP AFA
“If you have one economist on your team,
it’s likely that you have one more than you’ll need.”
Warren Buffett
The Markets
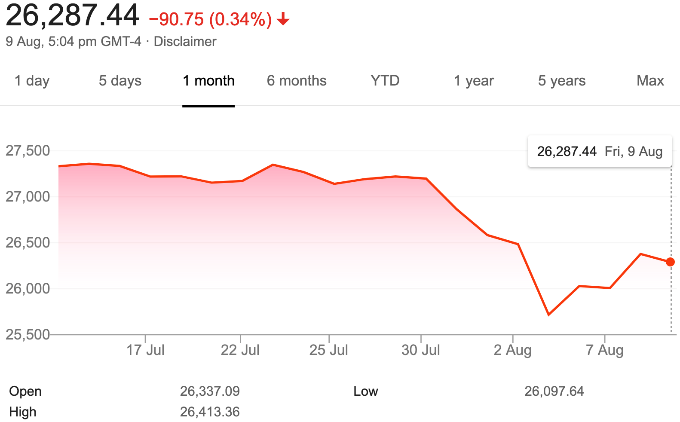
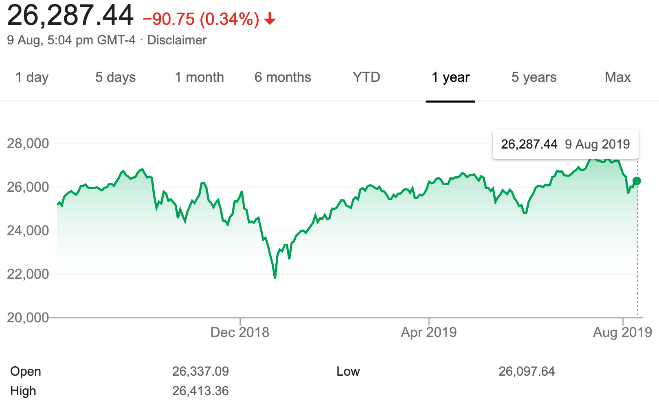
The chart on the left hand side shows the US market has declined over the last month, whereas the chart on the right shows the US market is still ahead over the last 12 months.
There has been some market volatility over the last week or so. This was caused mainly by Donald Trump telling the world that he was taking China to the International Monetary Fund (IMF), to lay a complaint against them for currency manipulation. Basically, if the Renminbi (yuan) is low compared to the American dollar, then Americans can buy more Chinese goods (not what Donald Trump wants) because they cost less due to the lower Renminbi.
As to whether the Chinese have indeed been manipulating their currency is difficult to know. It is likely that the decline in the Renminbi is just simply due to Donald Trump’s announcement that he is imposing additional tariffs on Chinese goods recently and the currency has therefore declined. This is probably because traders across the market might believe that this signals a greater possibility of slowing economic growth and potentially a recession.
Traders, I imagine, are also worried about a so-called currency war, where the likes of the US and China could start to battle it out to see who can reduce their currency the most. This might spin off around the globe and create difficulties for many other economies, who in turn may need to lower their currency in order to remain competitive and be able to continue to trade successfully with other countries. New Zealand, being a small economy has little say in the matter.
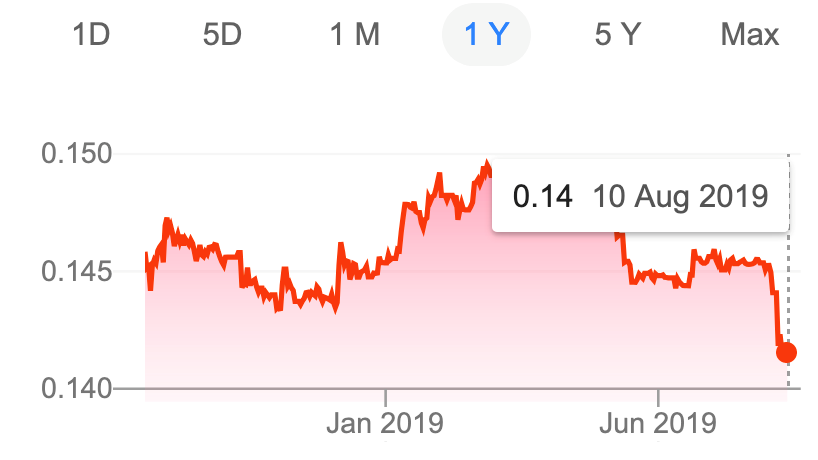
The above chart compares the Renminbi to the US Dollar.
The media love this type of event. It allows them to make a big noise about how worried everyone is about a currency war escalating into a recession. Of course, it is possible; however, just because the markets make a big noise about, it does not make it so. That said, if there is a big enough noise for a lengthy period of time, the market does start believing it.
So, the decline in the Renminbi has raised the prospect of a currency war between China and the US. The reason this is news is because for the last 11 years or so, the Renminbi has remained above seven to the US Dollar. The recent slip below this threshold is what the markets and the media are taking as a signal for a currency war between the US and China. So far, there appears to be minimal support at the IMF for Donald Trump’s claim that the Chinese are manipulating their currency. As for the New Zealand Dollar, it will likely (if not already) decline against the US Dollar as part of the reaction.
ECONOMIC UPDATE
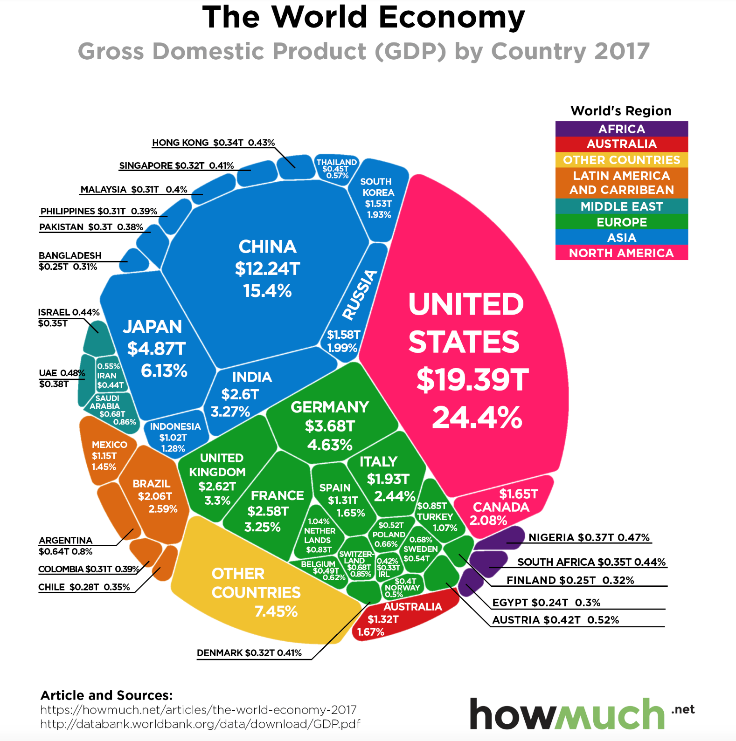
The above chart measures the size of economic activity by gross domestic product (GDP).
Together, the US and China are about 40% of the world’s economic activity (as measured by GDP). When they play well together, world trade is a happy place. When they do not, it can get complicated. America, obviously, remains the number one economic powerhouse in the world, although China is increasingly dominant. The American economy is dominated by consumption and services, which make up over 60% of economic activity in the US. China, on the other hand, has been an export driven economy, although the change is underway for China to transition towards a more consumption and services based economy. That said, China is working hard at developing the Belt and Road initiative, which effectively is trading with countries other than the US. This may take some heat out of the situation between China and the US, although that may be a few years down the track.
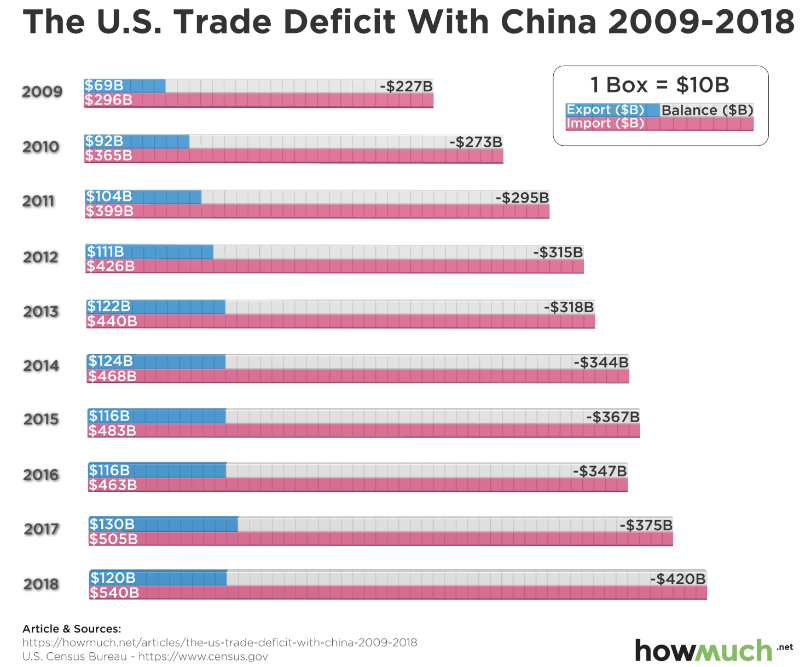
The above chart shows the growing trade deficit between the US and China.
Say what you like about Donald Trump (let’s face it, he is different!), he is right about the growing trade deficit that has been working in China’s favour for over 10 years. Over the last 30 years or so, China has become more and more dependent on America buying their goods in order to grow their economy. The gap was less of an issue many years ago but as that gap has increased, it has become difficult for America to ignore. Donald Trump is all over it.
At the same time, China also happens to be one of the largest consumers of soybeans that the US exports. The short of it is that whilst, sanctions on Chinese goods do impact on the Chinese economy and Chinese manufacturers, retaliatory tariffs on US farmers is starting to hurt US farmers now. Perhaps the point here is that talk and threats of trade tariffs is one thing, the implementation of them and then the impact that they exact on specific sectors of each country’s economy is a very different matter.
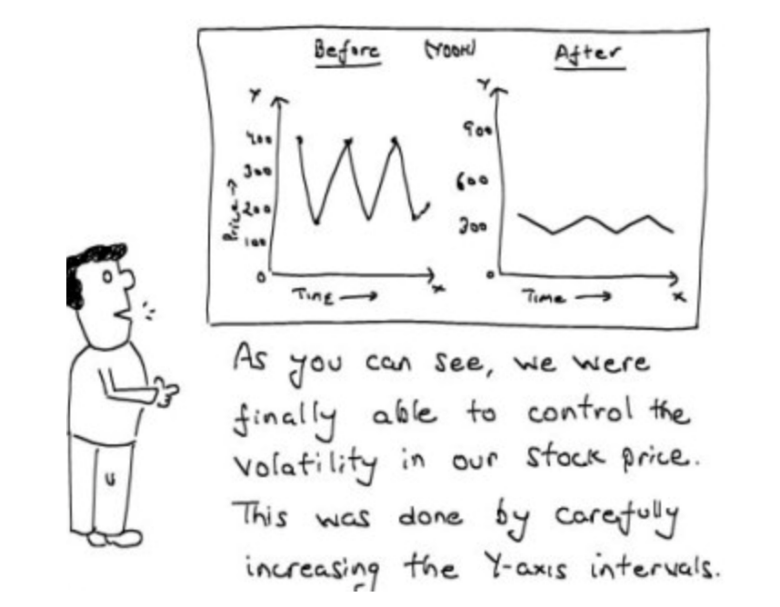
Trade disputes between the US and China may have a long way to go yet. If that proves to be correct, then as investors, we will likely see something we have not seen much of for the last 10 years. That is a certain event that happens across markets, that is known as volatility. Remember … that is when trading prices decline quite sharply and by quite a bit (10% or more), providing us with some opportunity to take advantage of better buy prices. I do not know about you but I would not mind some of that. What do you think?
US Fed Funds Rate
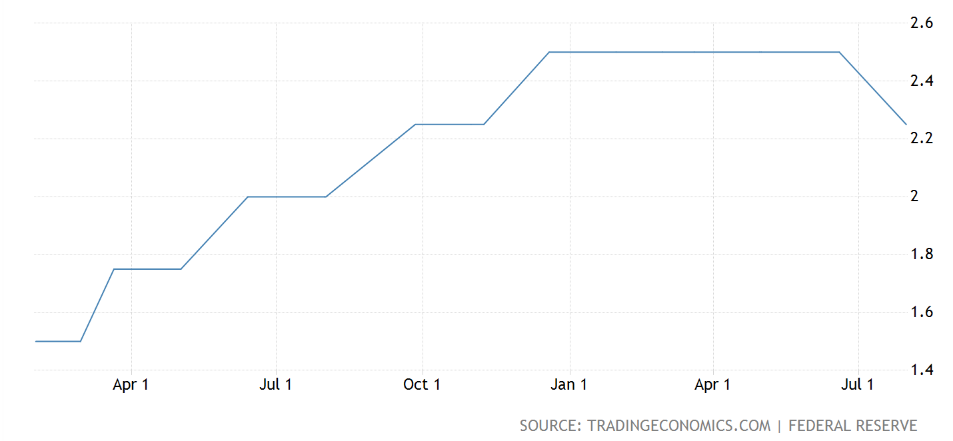
The above chart shows the Federal Reserve funding rate of interest over the last 12 months.
For the first time since the global financial crisis, the US Federal Reserve Governor, Jerome Powell, has cut the Fed funds rate. In lowering the target range for the federal funds rate to 2 – 2.5% during its July meeting, the Fed has also left the door open for further rate cuts. Chairman Jerome Powell said that he did not view this move as the start of a lengthy series of rate cuts, which means that he must feel reasonably confident about the sustainability of economic growth in the US; however, he also said that the Fed will act as appropriate to sustain growth. Jerome Powell is watching trading conditions in the US and what is happening with regards to the trade dispute with China and other countries. On the other hand, we can see that the labour market is strong in America, with low unemployment remaining consistent. Also, growth in household spending has improved from earlier in the year. Inflation remains low but steady.
The Euro Area
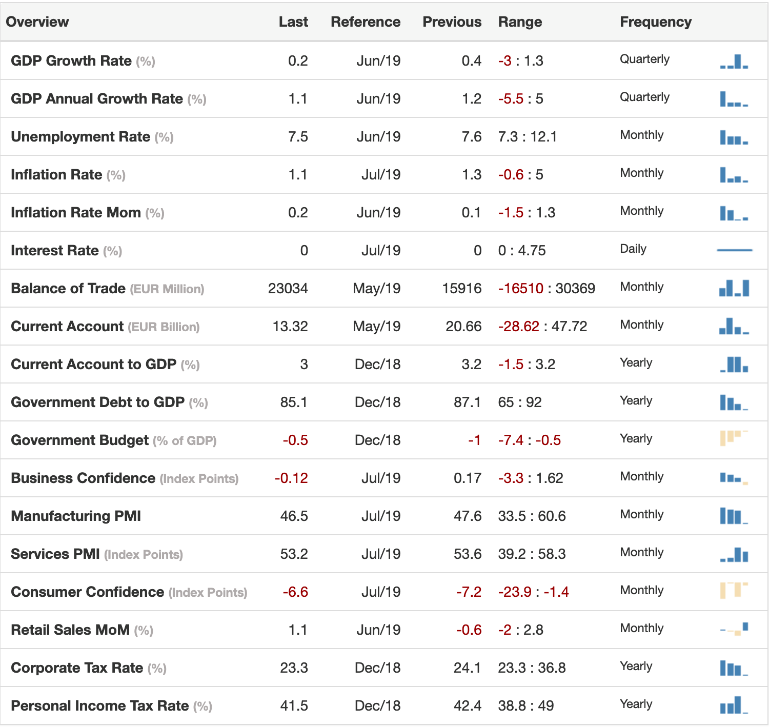
The above table shows a variety of economic data on the Euro area economy.
Glancing down the above table, you can see that economic growth (GDP annual growth rate) remains sluggish but still positive, unemployment remains high and inflation low but not necessarily perilously close to deflation just yet. In short, the European economy continues to battle along, supported by the central bank, low oil prices and low interest rates. I notice that the manufacturing PMI is in contraction, sitting at 47.6, whereas the services PMI is growing, sitting at 53.6. Consumer confidence, however, remains negative. This is worth mentioning because consumers will not spend money if they feel negative, which of course for a consumption based economy like the Euro area, means slow economic activity and low growth. No immediate drama for the European economy. It continues to struggle along.
New Zealand
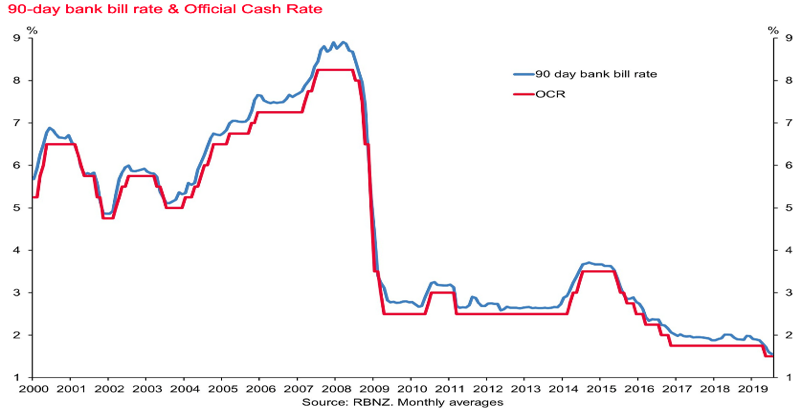
The above chart shows the Official Cash Rate and the 90 day bank bill rate since 2000.
The big news here in New Zealand is the surprise 0.5% cut to the Official Cash Rate. This was unexpected by most (including me). Although I imagine most Kiwis do not think much about it, New Zealand treads a fine line because we have such a narrow economic base. It was only recently that logs were our third biggest export for a while. To be clear, that is high risk stuff for any economy to be relying on a commodity like logs as a major source of trade revenue. That is because logs are a commodity and the prices are subject to supply and demand.
What I find more interesting is the Reserve Bank Governor, Adrian Orr, is talking about negative interest rates and the possibility of quantitative easing (this is where the government creates money by buying bonds or other assets, commonly known as “printing money” or “helicopter money”). We used to think that kind of thing only applied to other countries in far off lands, in other places around the world – not us here in NZ. Looking back with hindsight, it does seem a little naïve that we would ever think with our small, narrow, vulnerable economy, that we would somehow be immune to it. By, “It,” I am referring, of course, to ongoing global deflationary funk. It is right here in New Zealand, right now.
What does it mean? For retirees, relying on term deposits to generate cashflow, the news is likely to get worse. The Reserve Bank of New Zealand wants retirees with money in the bank to get it out of the bank and invest it into productive assets. Kiwis, particularly those who were involved in the 1987 share market crash, are “damaged goods” so to speak and they believe that playing the share market is risky / stupid. I tend to agree. Of course, once we understand how to invest as value investors, in businesses that are listed on the market, we then have some reliability and certainty around what we are doing. Indeed, we can actually enjoy dividends at twice or three times bank rates that are sustainable long term, along with capital growth as well.
Perhaps the next time you hear someone you know who is retired and frustrated with low interest rates from term deposits, you ask them whether or not they feel it is character building to persist with term deposits?! It must be frustrating for them …
Interest rates for those relying on income from term deposits will go lower and so too will their income. Unfortunately, though, whilst interest rates may decline somewhat for borrowers, there may be upward pressure on interest rates for borrowers due to tighter lending conditions, along with Adrian Orr’s proposal to have banks restructure their balance sheets. If they have to build their balance sheets, that means less money to lend out and less profit for them. One way to counteract that, of course, is to charge borrowers a higher rate of interest. Right now, we may see interest rates for borrowers decline somewhat.
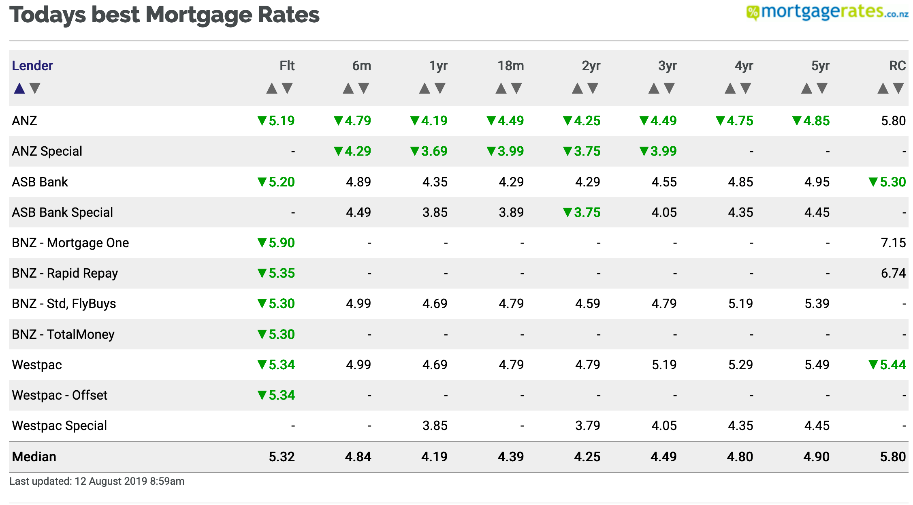
The above table shows a variety of mortgage interest rates across the New Zealand market.
Although this may change, notice how most of the action with regard to reducing interest rates is on the floating rate as distinct from longer term rates (apart from ANZ) in this chart. The banks are holding onto those longer term rates, I suspect, because they know that if the restructuring of balance sheets goes ahead at the level that Adrian Orr has proposed, they will be under pressure to recover lost income by maintaining interest rates at the current level or raising them further potentially. Time will tell.
It is pretty clear now that New Zealand is caught up in the global environment (that was always the case anyway) now that we have the Governor of the New Zealand Reserve Bank espousing the same narrative that we have heard from other central bankers around the world for the last 10 years. Some are calling it, “The new normal.”
If you think about how residential property has behaved as an investment over the last 30 years, is it any wonder that everyday Kiwis, who have embraced this asset class, sometimes treat it as a religion rather than an investment. It is almost because the set of circumstances (easy money conditions, ever reducing interest rates, etc) that helped drive property prices up, along with demand pressure, makes it normal. In other words, (they believe) residential prices will keep rising, like they have over the last 30 years, over the next 30 years, just because that is what happened over the last 30 years.
The market determines the price, therefore it is difficult to predict where prices will go; however, we know, for example that some teachers have struggled to pay their mortgage and have been awarded pay rises. One of the driving factors (not the only one) is that the cost of their mortgage as a percentage of their total take home pay has increased significantly over the last 25 years and effectively is squeezing them where it hurts.
It is not normal for property prices to rise like they have done over the last 30 years. It is an unusual situation based on a specific set of variables that have changed. How can property prices rise by 10% per annum guaranteed into the future forever when inflation, interest rates and economic growth are closing in on zero? Whilst Japan might look like an extreme case (protracted deflation), nonetheless, when you look closely at those variables that also apply here in New Zealand, the similarities, whilst not identical, are closer than what some might be willing to accept.
The question is, are the residential property price rises over the last 30 years normal because of an unusual set of circumstances and conditions?
Are low interest rates, even negative interest rates, normal because a specific set of circumstances and economic conditions prevail, forcing central bankers to reduce interest rates and stimulate their economies in order to hopefully keep their economies away from Japanese style deflation?
How much income do Japanese retirees receive from their term deposits in Japan?