Stocks Suffer Worst Loss in 10 Years…
Market and Economic Update – Week Ended 8th February 2019

Peter Flannery CFP AFA
“If you have one economist on your team,
it’s likely that you have one more than you’ll need.”
Warren Buffett
The Markets
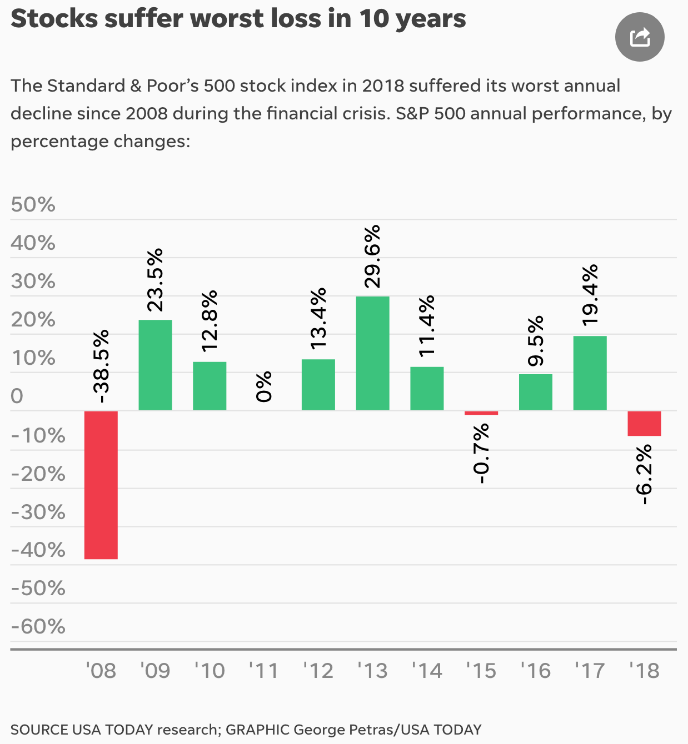
2008 was a so-called black swan event, whereas 2018, by comparison, did not come to much.
Stocks suffer worst loss in 10 years! This is the type of headline that is usually attached to the graph above, as the media attempt to create attention, in order to draw people closer to the advertising, which is their real agenda. It is not to inform you. It is to sell advertising. Of course, they know that many people are easily distracted by those dramatic sensational headlines. You and I know that this is because they ‘tune in’ to our ‘fight or flight’ wiring, deep in our genetic code.
Anyway, a 6.2% decline across the Standard and Poor’s 500 stock index in America is a notable and worthy decline but far less than other larger declines that we have seen in the past. As I have said, prices generally declined and were less expensive rather than cheap.
Looking ahead over the next 12 months or so, whilst predicting the future is always very difficult, with the US Federal Reserve Governor, Jerome Powell, hitting the pause button on interest rate hikes in the US, potentially, we could just see the current rebound that is underway continue on for some months. Do not trust it though. Remember, prices are driven by market sentiment (not logical thinking or proven structures that are known to work over time). For example, should signs of inflation suddenly emerge in the US economy, Jerome Powell might be forced to take his finger off the pause button and recommence interest rate hikes at a faster pace. This could upset the market and see prices decline once again.
Indeed, what interests me is the fact that at the end of last year, Jerome Powell appeared to change tack, by suggesting that interest rates were getting close to normalisation, which seems odd to me. Regardless, I see no need for panic anytime soon and unsettled markets will hopefully be scared enough, that prices will decline enough for us to achieve sensible buy prices.
Right now though, we have what many would regard as good conditions. Inflation is under control, interest rates are low, forward looking 2019 price earnings ratios are sitting at around 15.5 and earnings growth across the US market is estimated to be around 12% to 15% over the next 12 months. Actually, that is a surprisingly positive environment (for “stocks”). Let’s be aware of the markets but let’s not get distracted by them.
ECONOMIC UPDATE
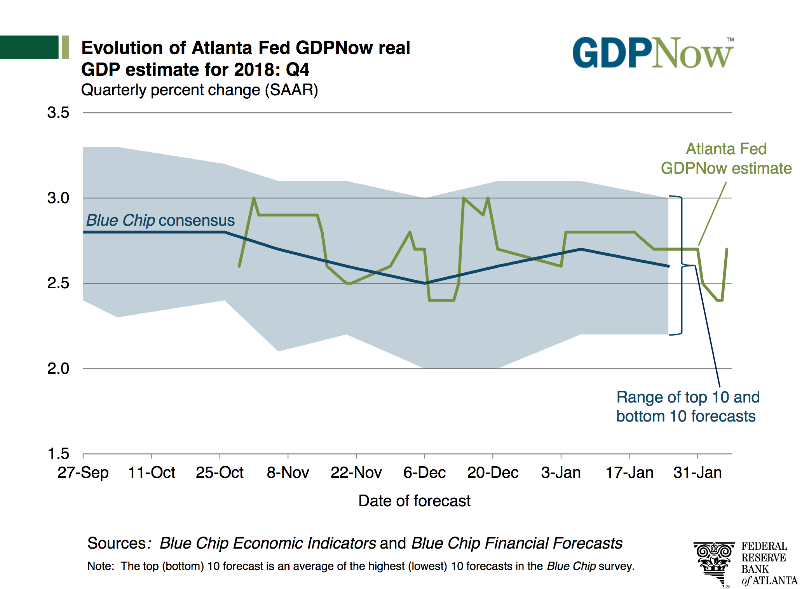
Economic growth in America continues.
The solid blue line in the chart above is the consensus (approximately 2.6%).
The solid green line is the Atlanta Federal Reserve estimate, slightly higher at approximately 2.75%.
The United States of America continues to grow. That growth may slow a bit over the next 12 months. There are some signs of new housing starts slowing, along with business investment on capital expenditure also slowing. They look like nothing to be concerned about but may impact somewhat on US economic expansion over the next 12 months.
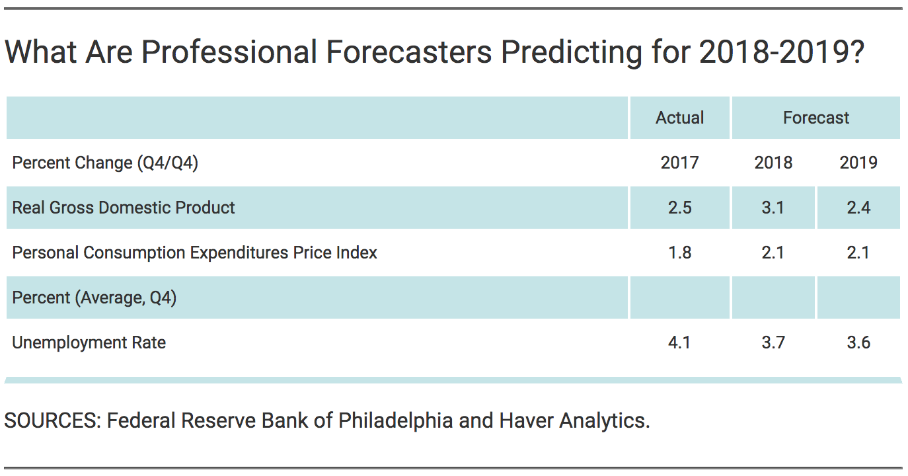
Personal consumption is a key indicator, as it represents around two thirds of GDP. It looks stable.
Generally, conditions in the US remain favourable and stable, whilst not booming. Economic expansion continues to be supported in the US by low oil prices, low interest rates and a generally buoyant market. I am watching interest rates which tend to be a key indicator of short-term market direction (not that I am interested in trying to predict market direction – just looking for opportunities to buy at favourable prices).
US Interest Rates
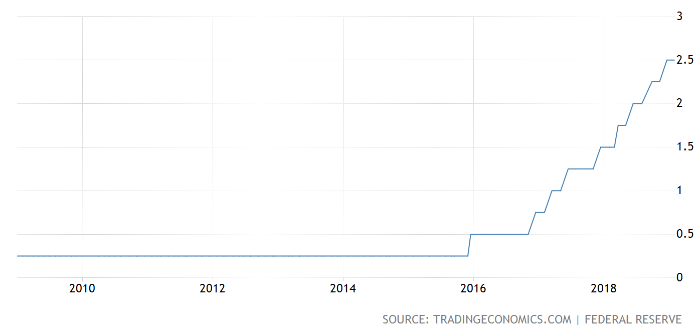
Interest rates in the US have left all-time lows behind.
As the chart above shows, interest rates have steadily increased in the US. At its first policy meeting of 2019, the US Federal Reserve reaffirmed its position of being patient about further interest rate hikes, mainly due to recent global economic developments and minimal inflation pressure in the US. The current federal funds rate remains on hold, at 2.25% to 2.5%. Donald Trump has been highly critical of the US Fed and ongoing interest rate hikes. It should not be having any impact on the Fed Governor, Jerome Powell, who says that his decisions are based on a vast array of data, which in December included an outlook of slowing global economic growth.
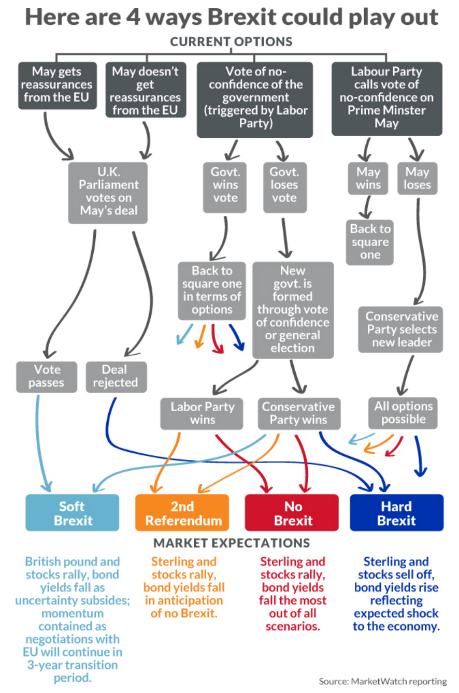
The above chart outlines the four main options – time will tell.
Theresa May’s deal, which she negotiated with the European Union in November last year, was initially supposed to be voted on in December. However, Theresa May postponed the vote at the last minute, in order to avoid defeat. She has survived politically but only just. Meanwhile, Theresa May has continued to lobby European Union leaders, in order to offer some assurances, particularly about the controversial ‘backstop’ arrangement that dictates the treatment of the Irish border.
The backstop relates to the border between Ireland and England. The European Union and England want Customs to allow a reasonable flow of trade rather than being a hard wall, so to speak. Theresa May’s critics argue that the current trade arrangement offers no “get out” clause at all. The Europeans say that England should not worry about it because they do not like the arrangement much either and it was only meant to be temporary. Anyway, the Europeans say there is no negotiation. That is where we are. The deadline is looming … 29 March 2019.
China’s Economic Expansion

Economic growth in China slows down.
China intends setting a lower economic growth target of 6% to 6.5% in 2019. This compares with last year’s target of around 6.5%. Interestingly, growth of around 6.2% is needed over the next two years, in order to meet the ruling communist party’s longstanding goal of doubling GDP and incomes in the decade to 2020.
At this stage, the Chinese Government appears to be planning to maintain a 3% consumer inflation target for 2019, even though there has been some recent softening in price rises. Recent data also showed that China’s consumer inflation eased to 1.9% in December, from 2.2% in November, which is below the government’s full year target. The Chinese Government may well step up fiscal stimulus over the next 12 months, perhaps with larger tax cuts to help Chinese businesses, along with a possible increase in spending on infrastructure projects. This may cause their budget deficit to rise from last year’s 2.6% of GDP, however I suspect the Chinese Government will be keen to keep it below 3%.
The bottom line is that the Chinese Government has been vigorously managing the economy in China for many years. They continue to have and use when needed, a vast array of macro prudential tools, in order to steer the economy down a path of its choosing as much as possible.
In my view, it is difficult to see economic collapse in China like many have predicted over the last 10 years or so. For example, there were many commentators, seven or eight years ago, claiming that a significant property bust was imminent and that this would destabilise the Chinese economy with ramifications flowing out around the global economy, inflicting pain on us all. It never happened. Although China’s property market has been hot over the last eight to 10 years, it remains more conservatively financed in some ways (e.g. higher level of deposit required) than other economies around the world, including New Zealand. An ongoing controlled slowing of the Chinese economy looks likely in my view.
I also believe China will continue to play the long game with regards to trade tariffs but those tariffs will still impact in the near term.
New Zealand Residential Property

The above chart shows the lending mix between investors and owner/occupiers over
January 2016, January 2017 and January 2018, leading up to January 2019.
The new loan to value restriction levels (LVR) kicked in from the 1st of January this year, after being announced at the end of November last year. The chart above shows that there has not been much impact as a result of the easing of this so-called ‘speed bump’ – at least not yet. Total lending in 2018 was $64.3 billion, an increase of 8.9% from the $59.1 billion in 2017. Interest only lending appears to be declining as a percentage of total lending as well. This is the case not only with investors but also owner/occupiers.
Interest rates – floating vs fixed
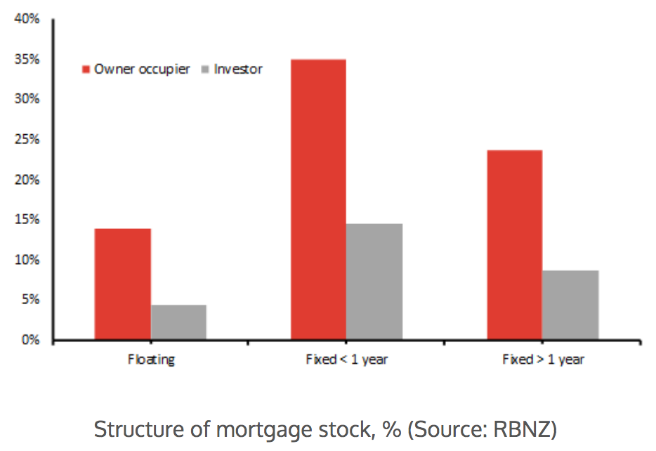
The above chart shows the mix of floating versus fixed interest rates between home owners and investors.
It is interesting to note that more than 80% of New Zealand’s mortgage debt is fixed with 33% fixed for at least one year. This gives New Zealand households and investors time to adjust before any interest rate shock impacts. In Australia, on the other hand, most lending is on floating rates, which leaves them exposed to interest rate rises pretty much immediately.
It is fair to say that New Zealand’s property market remains stable and so far, has avoided the slump like conditions that some Australians are enduring right now. Sydney and Melbourne property prices are a good example of how expensive prices can fall sharply when they are simply too stretched for the fundamentals to support them. It just takes one adjustment to the set of circumstances that previously supported those stretched prices. Then, we should not be surprised to see prices decline sharply.
The trick though is that those prices can remain expensive for a long time. Long enough that those less experienced in financial markets start to believe that they are normal.
The fundamentals always matter – eventually.
