In 2008 it was NINJA loans in the US…
Market and Economic Update – Week Ended 1st March 2019

Peter Flannery CFP AFA
“If you have one economist on your team,
it’s likely that you have one more than you’ll need.”
Warren Buffett
The Markets
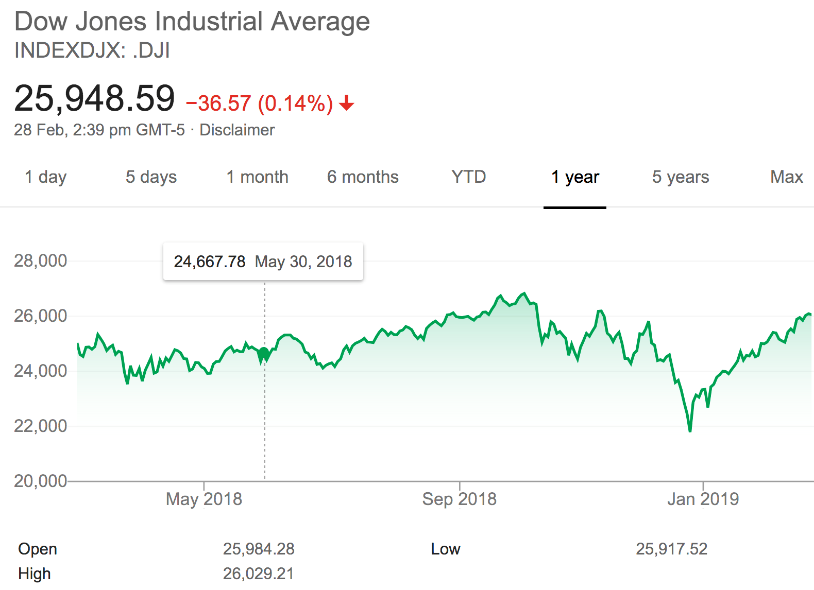
The green line shows profit or gain, as opposed to a red line showing loss. Markets continue to feel happy, hence the green line.
The media has tried to strum up interest in a couple of events, such as the meeting between Kim Jong-Un and Donald Trump and the skirmish between India and Pakistan. The markets, however, appear ambivalent about both these events at the moment. It was not that long ago that the media were suggesting there was a real possibility of a nuclear bomb going off. This did worry investors and everyday citizens of the world for some time. Just over the last week, there has been a serious skirmish between India and Pakistan and once again, we have the media suggesting that because these countries are nuclear capable, that this could possibly lead to a nuclear war. We do not need to predict the future to know that whilst there is a possibility of a nuclear war between Pakistan and India, that the probability of it, at this stage certainly, is minimal to nil. Still, we will keep an eye on developments between India and Pakistan. Their disagreement is nothing new.
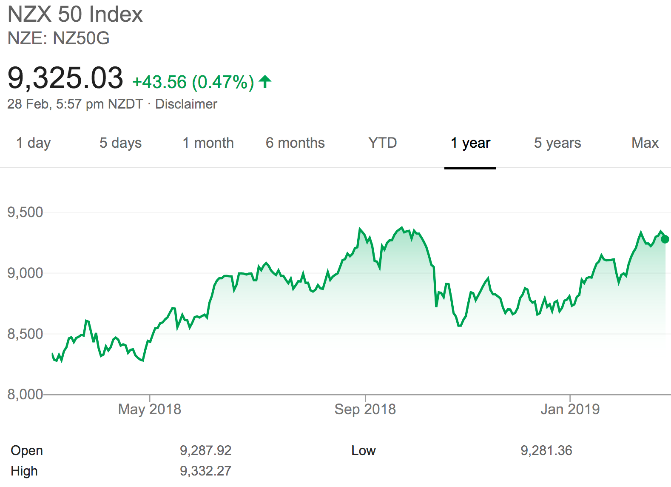
The above chart shows the New Zealand share market and its movement over the last 12 months.
Why does WISEplanning continually show the American share market and not show the New Zealand share market? The short of it is that the New Zealand market takes it lead from the American market. Global markets inevitably determine the pricing for the New Zealand market in many respects. This is less so in the short term and more so long term. Although a bit simplistic, if we invest long term in the New Zealand market, we can do OK. Chances are, we will do better investing in businesses that have much more room for growth in larger economies like America. As investors, if we are looking to make the best gains possible (I am not against being parochial and investing locally), small businesses in big markets can offer better opportunity for New Zealanders to invest more successfully. As you know, we refer to those small businesses as ‘small caps.’
ECONOMIC UPDATE
US household and consumer debt
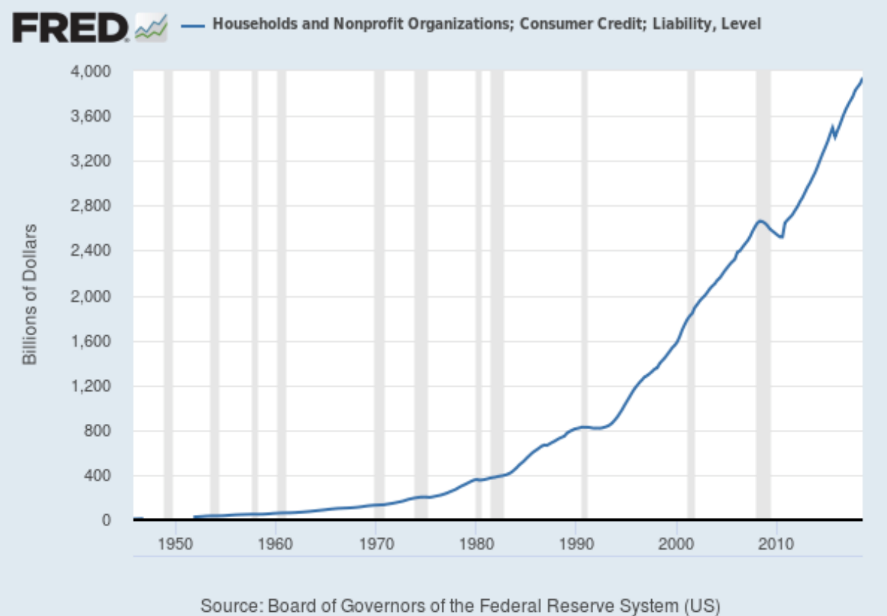
The above chart shows the increase in household and consumer debt since the 1950s.
Increasing consumer debt levels are not ideal in many economies, including the US. Is there such a thing as good debt? The short answer is yes. Debt against assets the grow. For example, homeowners can secure their first home with the help of some debt, which they inevitably pay down. Along the way, they enjoy the increase in the price of the house they live in, which increases their equity. This is pushed along faster by the tailwind of debt, which of course is leverage.
The same holds true for investment in business. This is not to say that excessive debt is an excellent idea, however debt applied to productive assets can speed up the wealth building process to everyone’s advantage.
Anyway, there has been quite a bit of noise made across the internet of late around the chart above, highlighting what those internet jockeys claim is the dire position of US families and therefore the US economy.
Household debt servicing payments
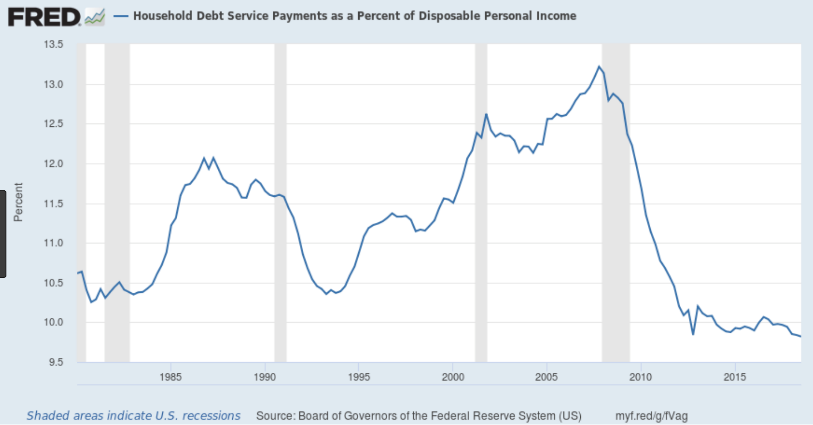
The above chart shows the debt servicing levels for families and consumers across the US – a better looking chart.
The above chart (let’s call it exhibit two) shows what appears to be a different story. Debt servicing levels for families across the US is close to, if not reaching, all time lows. So, what gives? The chart above shows household debt servicing as a percentage of disposable income. Again, I am oversimplifying things, however we have low interest rates, which of course helps with regards to the level of debt servicing. I would agree that low interest rates are a double-edged sword and there is any amount of material across the internet shouting about how dangerous high levels if debt are, particularly if interest rates start to rise.
That is valid, however there is another side to this as well. Economic growth has also been underway and if you look at the growth that the US economy and the global economy has enjoyed over the last, say, 50 years or so, we can start to see why those increased debt levels are not as bad as they are sometimes made out to be. The capacity for the American economy and the global economy to cope with larger amounts of debt has increased. In the chart above, you can clearly see that the debt servicing on a larger amount of debt is not a major issue.
Not only that, I believe, because of 2008 and the global financial crisis, everyday Americans and other citizens of the world, think a little bit more carefully about debt. Just think for a moment about the lifestyle that you enjoy now. Go back 25 years. Yes, life was great then too, however the technology that existed then, whilst unbelievable compared to the 25 years prior, when we look back today, was very basic. The US economy and the global economy is better placed than it’s ever been. Sure, it is not without its challenges. Risks and dangers are always present, they just look different as time passes by.
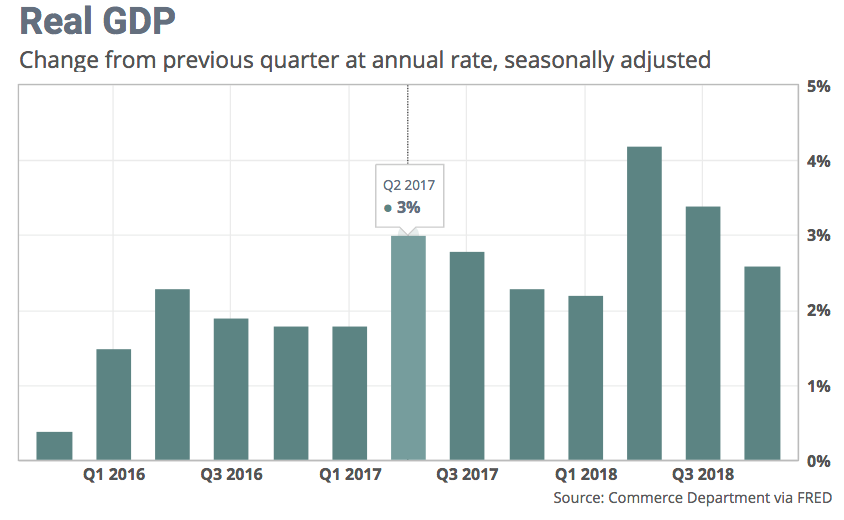
Growth in the American economy continues.
Although it depends which chart you look at, from which economist, and how the numbers are interpreted, economic growth in America continues to roll along, with the fourth quarter in 2018 coming up with growth of around 2.7%. That is real economic growth. Consumer spending continues to drive economic expansion, which of course you would expect because over 65% of the US economy is based on consumption. The outlook is for a possible easing in economic growth. Providing this occurs in a slow, loping fashion, markets will not be too bothered by it. That said, I reckon markets are a bit fragile nonetheless and a surprise in this area would see some volatility emerge – bring it on!
Britain
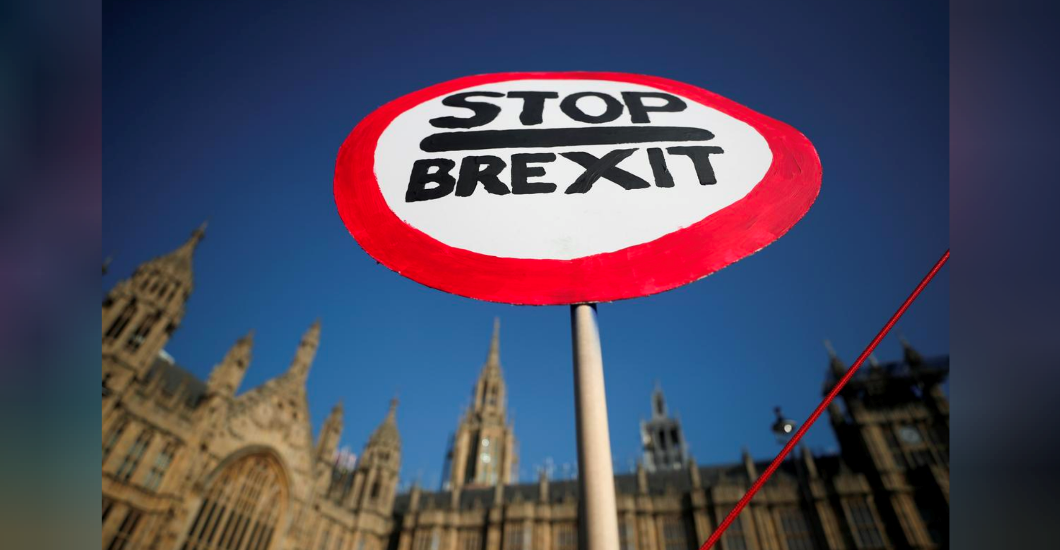
A sign recently spotted outside the Houses of Parliament in London in February.
The United Kingdom is due to leave the European Union in less than a month. Still, there is no deal. The three main options now appear to be to go with Prime Minister Theresa May’s deal, go back to the people for another vote or leave without a deal in late June. Interestingly, Theresa May has repeatedly refused to take the no-deal option off the table. The French President, Emmanuel Macron, recently stated that the European Union might agree to extend the Brexit deadline but only if Britain justified this type of request with specific and clear objectives. The no-deal option does not look like an ideal approach because the divorce would be abrupt and very messy. Politically, this would seem to be not in the best interests of Theresa May or her party. Anyway, we all watch with interest and as there is a bit more ‘water to flow under the bridge’ so to speak, I thought it best to wait until the 11th hour before providing too much depth here, right now. I will keep you posted.
New Zealand
New Zealand businesses increased their spending on research and development by $548mln in the last two years to $2.15 billion over 2018, according to Stats NZ. This sounds like a boring statistic, however research and development helps underpin future growth and is good. That is because research and development is about innovation and improving products and services. This can help make businesses more profitable, so they can grow and expand, hiring more staff who pay more tax and so on …
The official cash rate in New Zealand remains at 1.75%. Adrian Orr, the Reserve Bank Governor, expects to maintain this level through 2019 and 2020. His prediction for the official cash rate is that it could either move up or move down (!). Anyway, employment in New Zealand appears to be at a sustainable level, although Adrian Orr would prefer consumer price inflation to be closer to the 2% midpoint target. Generally, there is an expectation that the global economy will slow over the next year and a half or so, which would impact on New Zealand. This will be weighing on the Reserve Bank Governor’s mind. It will be one of the factors influencing his decision to keep interest rates on hold.
Still, with interest rates in New Zealand, the Reserve Bank has stated it is looking to potentially double the minimum equity requirements for banks. The impact of this effectively may mean higher interest rates for borrowers a banks and lower rates for term deposits in New Zealand.
UBS put out some thoughts on the subject recently and suggested that the impact would be an additional $2,000 a year in debt servicing on a $500,000 mortgage here in New Zealand. The Reserve Bank does not agree with their analysis, however let’s wait and see how this unfolds. The idea of increasing bank’s equity is to shore up the balance sheets of banks, so that when troubling times emerge, New Zealand banks are better placed to withstand what can sometimes be severe conditions, making capital difficult to obtain and putting banks at risk of default.
As we have seen with finance companies here in New Zealand that were not properly funded, default can suddenly emerge from what seems like nowhere, without a proper capital base supporting the lending organisation. Do you think the New Zealand Reserve Bank Governor, Adrian Orr, is on the right track here?
NZ household debt and servicing
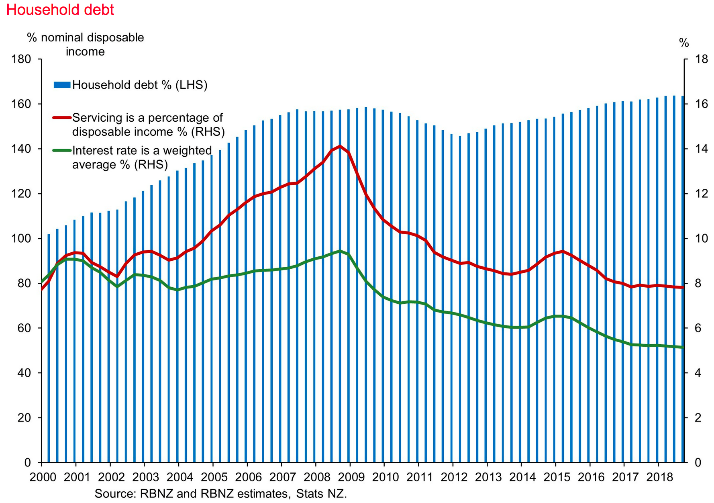
The above chart shows total household debt, along with servicing as a percentage of disposable income. The green line shows interest rates.
We looked previously at the US situation with regards to servicing of household / consumer debt. The above chart looks at New Zealand and as you can see, debt levels have increased since 2000 and yet debt servicing as a percentage of disposable income has actually declined. An increase in interest rates would certainly change debt servicing costs and this may in due course emerge, however for now, particularly with the consensus view being a slowing global economy, interest rates in New Zealand and many other countries, including the US, are either on hold or in the case of the US, those rate hikes have slowed down. It looks like a case of: ‘steady as we go for now.’