Is The Global Economy Moving Closer to the Edge of the Cliff?
Market and Economic Update – Week Ended 26th April 2019

Peter Flannery CFP AFA
“If you have one economist on your team,
it’s likely that you have one more than you’ll need.”
Warren Buffett
The Markets
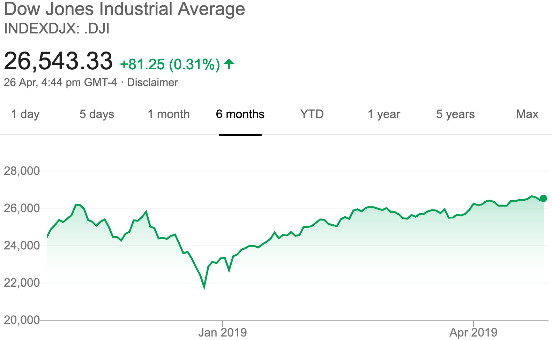
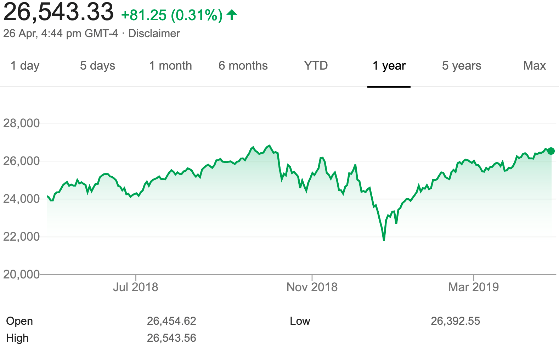
The above charts show the movement in the Dow Jones (the US share market) over the last six months and the last 12 months. Note the absence of that stubborn, six month, red looking chart, that is now in positive territory.
Earnings season in the US mixed but positive on balance. Earnings season, as you know, is about company profit announcements across the US. In simple terms, when earnings meet expectations, the market is happy; however, when actual earnings come in below expectations, the market does not like it. A serious earnings miss can see the trading price of any business plummet sharply.
Basically, what we are seeing at the moment in the markets is lots of momentum buying. In general, share brokers and momentum based asset managers are chasing rising prices. For fund managers, it is in the hope that the next time they report their monthly gains or losses, they can show a positive gain that is hopefully more than the overall market. That is when you will hear from fund managers loud and clear. For share brokers, apart from the fact that it is another opportunity for them to “clip the ticket” so to speak, they hope that the rise up in market prices continues so that their customers can feel good about the gains they have made, based purely on the trading price from when they bought to the time they look at it next. This approach to making money in the markets works, until it does not.
What we are seeing is a recovery in prices since the 2018 fourth quarter sell off, due in part, to the US Federal Reserve signalling a slowdown in interest rate hikes. Indeed, those rate hikes have been put on hold for now. There has also been less negative dialogue around US/China trade differences, which helps the market to feel a bit better about things.
We are also seeing a stable GDP number coming out of the US, which provides support to confidence levels and therefore trading activity across the markets. As someone recently quite rightly said, “The US economy is not falling off a cliff anytime soon”.
The recent boost to share markets in the US is also as the result of a buoyant consumer discretionary sector which, in simple terms, suggests that Americans are happy to spend money on concessionary items. Interestingly we are also seeing a boost to the markets from Amazon.com, which actually saw its trading price rise 2.5% after their quarterly profit recently doubled to beat Wall Street estimates. However, its second quarter profit guidance looks lower than the market was expecting.
Ford Motor Company saw its share price also rise 10.7% as it announced better than expected quarterly earnings due to a pick up in truck sales. So, happy times at the moment. Prices are at all time highs in the US, which does not suggest automatically that markets will crash. It does, though, make it much more difficult to find good businesses at the right price. The price earnings ratio (the P/E ratio) across the US market sits at approximately 23, which is not excessive in my opinion, but nonetheless, as I said, makes it difficult to find those bargains.
ECONOMIC UPDATE
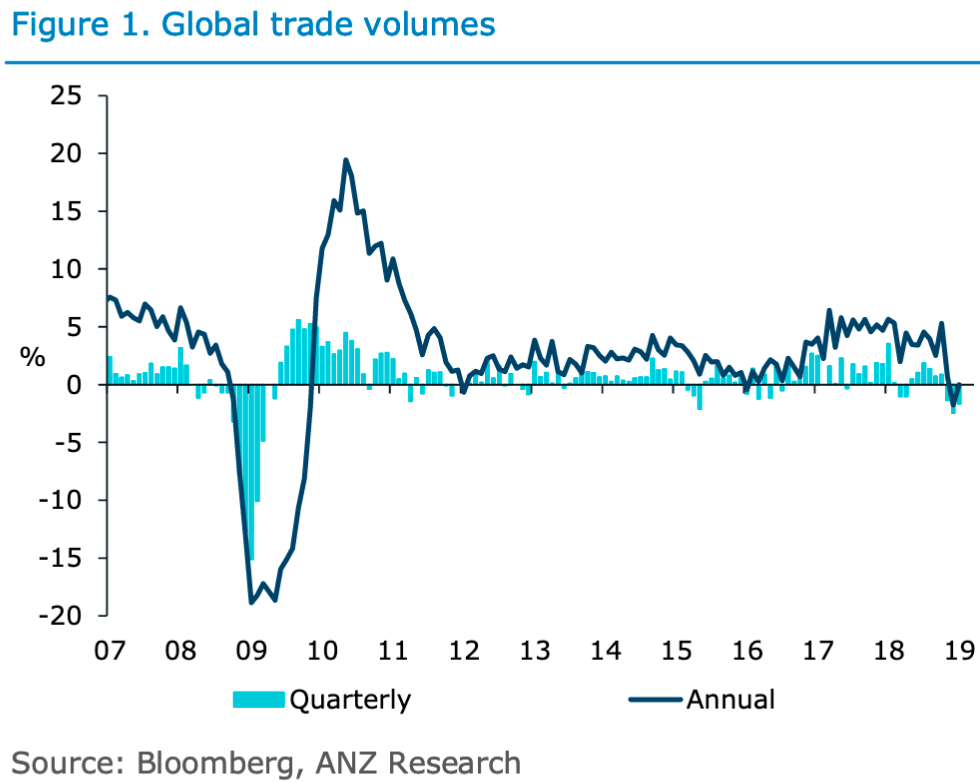
The above chart measures global trade activity.
Note the dip in trade activity toward the right side of the chart. The uncertainty around the China/US trade negotiations, the uncertainty of Brexit and, at that time, the effects of some tightening Chinese credit growth all impacted to slowdown global trade.
Trade volumes typically vary, which is not unusual and what is interesting to note is that they tend to compensate or revert to the mean, if you like, when things become too slow or excessive global trade takes place too quickly. Against this, we have since seen a softening by central banks who have adopted a more cautious approach.
In particular, the European Central Bank was talking about slowing down its quantitative easing programme and, indeed, initiating a removal of some of the stimulus that had helped to support the economy previously. They also were talking last year about interest rate rises over 2019. Both of those items have been put on the back burner.
Also, the US Federal Reserve, surprisingly, toward the end of last year in my opinion, changed direction quite suddenly by signally the end of quantitative tightening and a slowing down of interest rate rises. Indeed, interest rate rises are now on hold in the US.
If I was to take a negative view, I would point to the fact that the global economy continues to struggle and is moving ever closer to the edge of the cliff! Taking a more pragmatic view, and realising that the global economy does not work on the basis of simple absolutes and is more complex than that, I take the view that central banks will do what they have been doing and will continue to do, which is to support their respective economy, and therefore the global economy in the future. Why stop now?!
China Caixin Manufacturing PMI
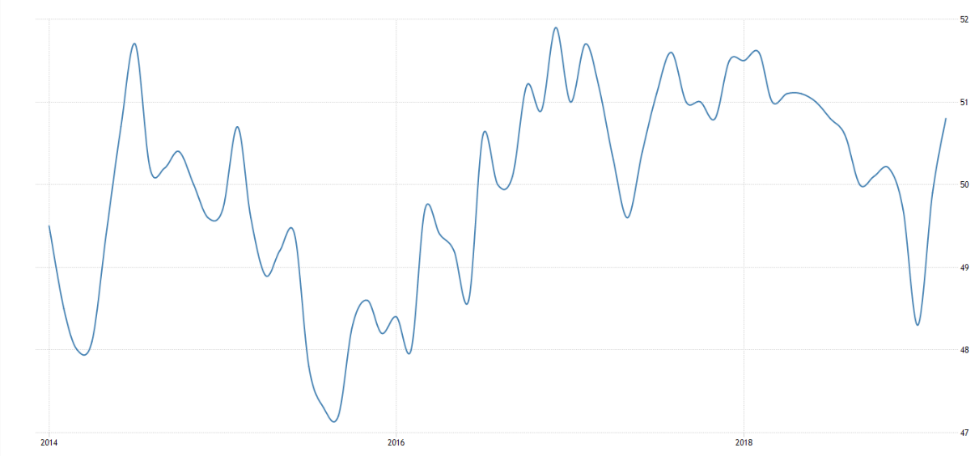
The above chart measures the performance of the manufacturing sector in China. It is based on a survey of 430 private industrial companies.
The Purchasing Manufacturing Index recovered strongly in March. Apparently, whilst the Chinese economy looks as though it is slowing down, it nonetheless is not falling off a cliff either. When the index is over 50 this indicates expansion and below 50 indicates contraction. Notice how, in the chart above, this index has been quite varied which, of course, is very normal. Markets and economies do not run to any straight line, logical, rational approach to progress. Indeed, it is a random walk.
The Belt and Road initiative, driven by China, involves infrastructure development and investments in over 150 countries. It involves international organisations not only around Asia but also the Middle East, Europe, Latin America and Africa. “Belt” refers to overland routes for road and rail transportation, whereas “road” refers to sea routes or the 21st century maritime silk road. Some observers are concerned that this is a push by the Chinese for dominance in global affairs. This initiative was driven by Xi Jinping during a speech to the Indonesian parliament in October 2013. In my opinion, China will continue to drive this regardless of any negative publicity. It will help support Chinese economic growth and also growth in Belt and Road initiative participants in other countries around the world. Notice America is not mentioned.

The US and Europe agree to initiate trade talks. “We are ready when they are” was the comment from Cecila Malmstrom at a recent press conference. Last year, the US and Europe agreed to pursue a limited trade deal, however since then Donald Trump has accused the European Union of dragging its feet and has threatened to impose tariffs on car imports.
A couple of weeks ago, Donald Trump raised the rhetoric saying the US would levy new tariffs worth €11 billion over European Union subsidies for Airbus. The European Union responded that it intends to counter with a tariff hike of €20 billion. Both the US and Europe accuse each other of illegally subsidising their respective aviation giants, Boeing and Airbus, for more than 10 years.
Meanwhile, France is concerned about domestic fallout from the trade negotiations. They are resisting renewed trade discussions with the US and prefer to push them out beyond the European Union parliamentary elections scheduled for May 23 – 26 this year. France is concerned that dealing with Trump may impact on the vote. I can imagine Europe will be keen to tidy up their trade with America because the European economy is limping along and remains fragile. Still, the European economy has not fallen off a cliff either.
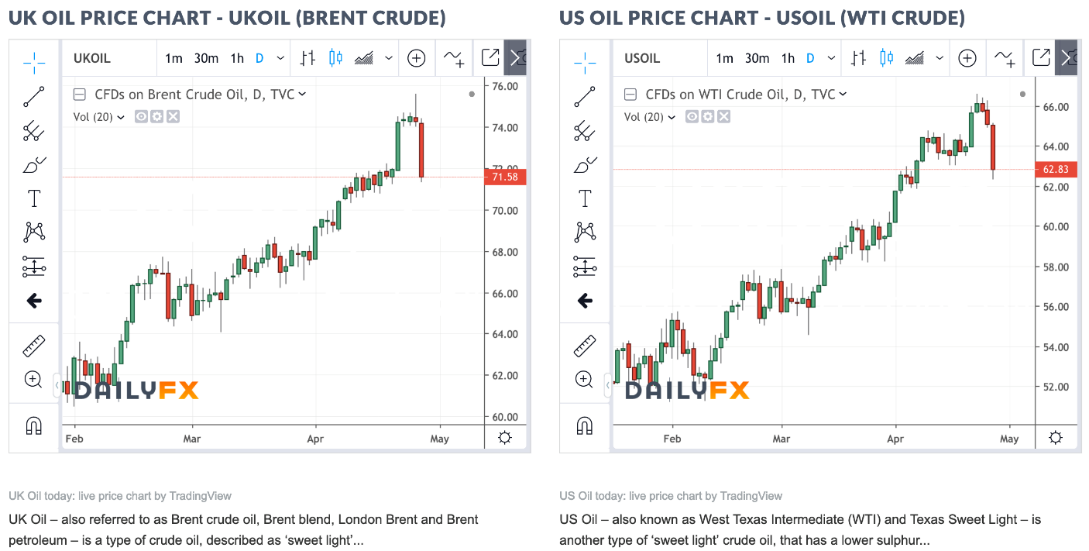
The above charts show a recent rising trend in oil prices.
Oil prices rise – why? OPEC led by Russia and Saudi Arabia appear to be trimming oil production and therefore tightening supply. This has seen crude oil prices move toward six month highs. It is also driven, in part, by US sanctions on Venezuelan exports and Libyan unrest. The US, however, is now the world’s largest oil producer and has been pumping oil at, what appear to be, record levels.
As you may recall, there are currently waivers in place on countries importing Iranian oil and when they expire on 2 May 2019, we may see oil prices continue to rise. After that date, buyers of Iranian crude oil will then face sanctions from the US, which will further strain trade relationships, especially when we take into account that one of those countries affected is China.
Australian Inflation
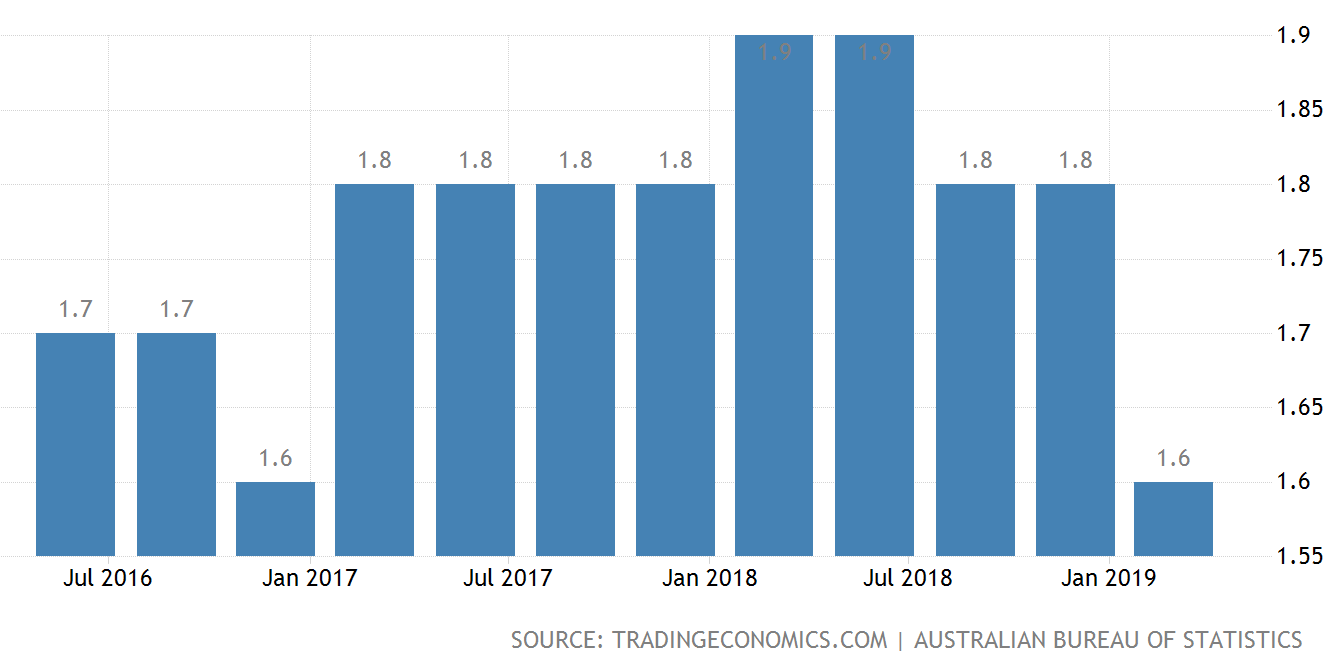
The above chart measures inflation in the Australian economy.
Inflation in Australia remains stubbornly low. Although there are other factors, this could help drive a rate cut in Australia. Recent data shows that the core underlying inflation, a measure that the Reserve Bank of Australia looks at closely when setting monetary policy, rose by 0.2%, quite a bit below the expected 0.4%. This was the weakest quarterly increase on record. The core inflation rate over the last 12 months of 1.4% remains stubbornly low and well below the Reserve Bank of Australia’s medium term target of 2-3%.
The response by the share market, of course, was to feel excited, with the comfort of lower interest rates a real possibility, which saw the equity market spring ahead. The share brokers, momentum fund managers and “clever share market speculators” are having a good time.
New Zealand Economic Growth, History and Forecast
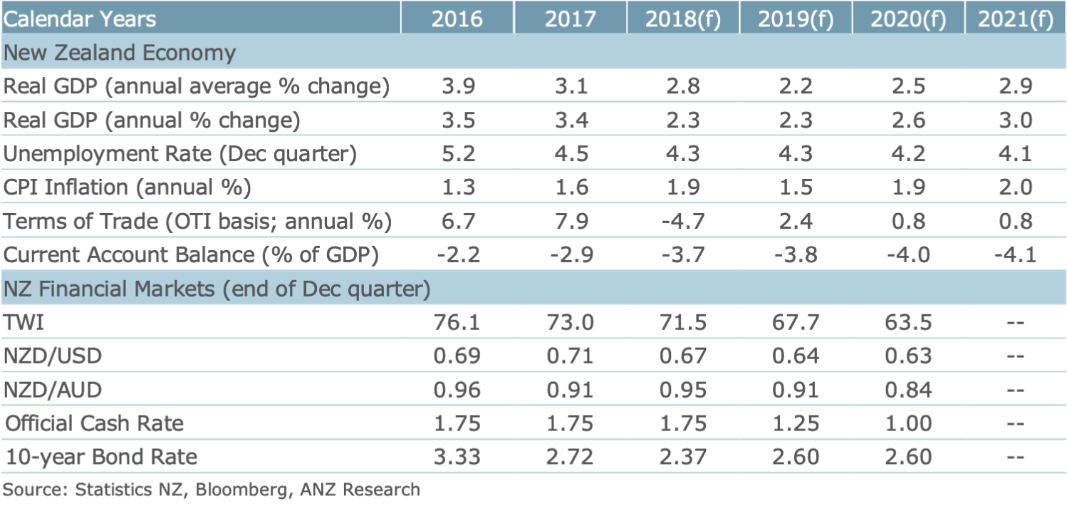
The above chart shows a stable but unspectacular story of economic growth ahead for New Zealand.
The New Zealand economy has been slowing down for a while. Will an interest rate cut be required to slowdown and stop that downward trend in economic growth? Basically, growth is expected to remain subdued for a year or two, but possibly lift to somewhere near back to where we are now by around 2021.
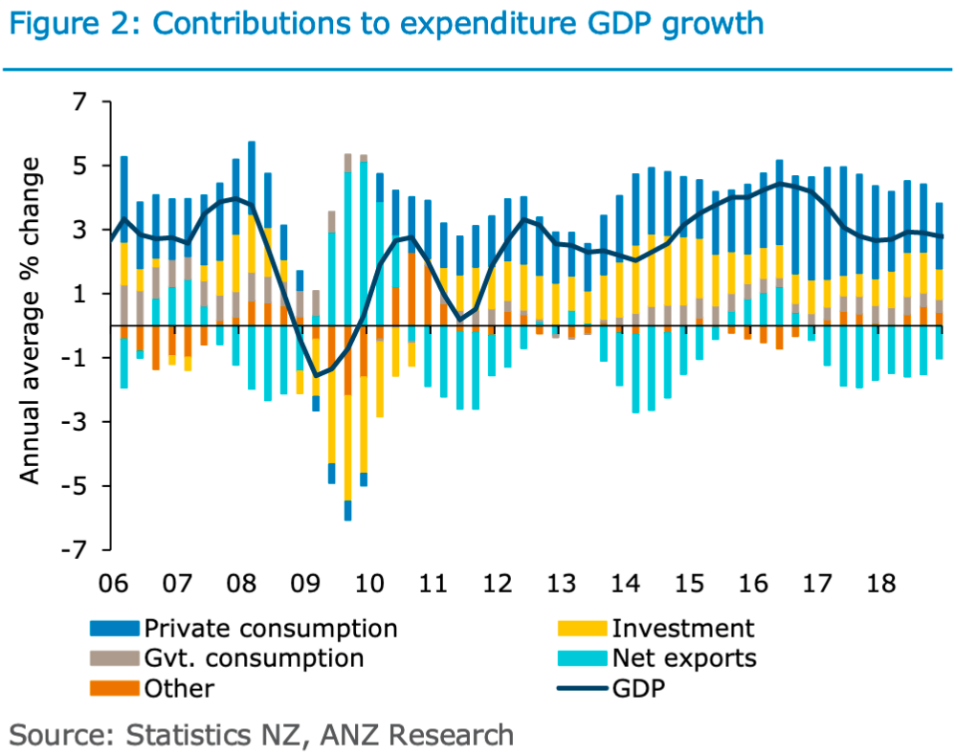
The above chart shows the make-up of economic growth (GDP).
Strong immigration over the last three years or so added approximately 300,000 more people into the New Zealand economy. This has helped to support private consumption growth, which in turn has helped support economic growth in the economy here in New Zealand. Although immigration has slowed down, there has been some confusion around how it is being measured. Regardless, immigration remains strong albeit a bit lower (not sure now much!?) than over the last 12 to 18 months.
The housing market in New Zealand is starting to cool off and remains patchy throughout New Zealand with some main centres, notably Auckland, with prices either slowing down or declining and Christchurch with flat prices over the last four years, and some regions demonstrating a final burst of growth before this too flattens out.
Against this subdued background for property, we still have a platform of low interest rates supporting property prices, although they remain expensive by fundamental measures. Ongoing immigration will also place a solid floor under property prices in some areas and we might even see a rebound in property price growth to some extent if there is an interest rate cut.
Against all that, is the Adrian Orr (Governor of the New Zealand Reserve Bank) with his idea of boosting banking solvency. This effectively means potentially less money available to lend once they are implemented and lower interest rates for retirees relying on income off their term deposits. Interestingly, I note he recently extended the deadline for submissions around banking capital measures.
Last year, Adrian Orr, when asked about interest rate direction responded that interest rates may remain flat, could rise, or could fall. I guess that about covers it!
At the moment though, it weighs on the side of the next official cash rate movement being in a downward direction.