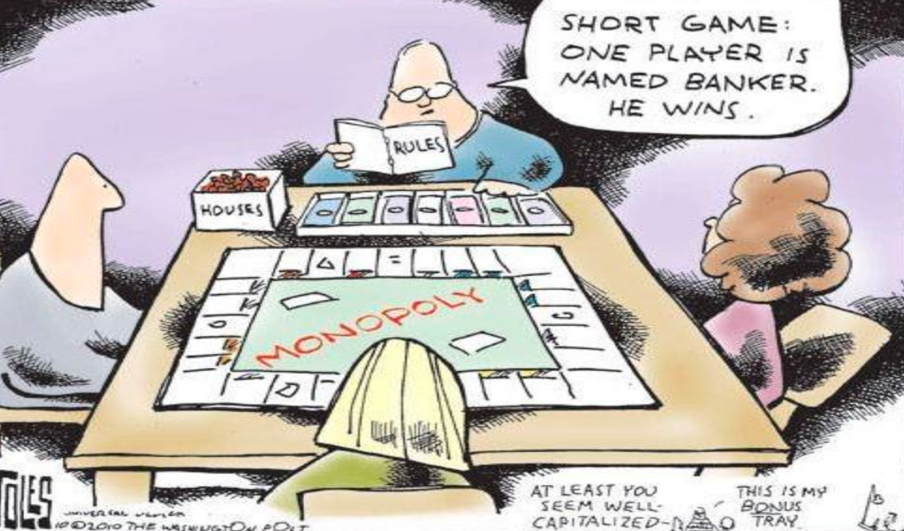
Donald Trump Puts Pressure On China
Market and Economic Update – Week Ended 17th May 2019

Peter Flannery CFP AFA
“If you have one economist on your team,
it’s likely that you have one more than you’ll need.”
Warren Buffett
The Markets
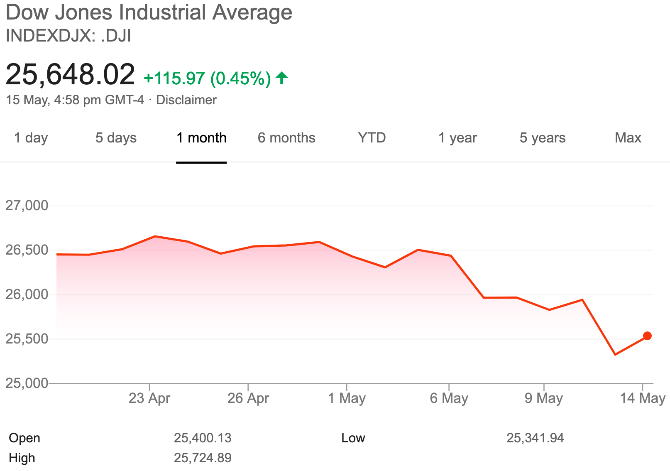
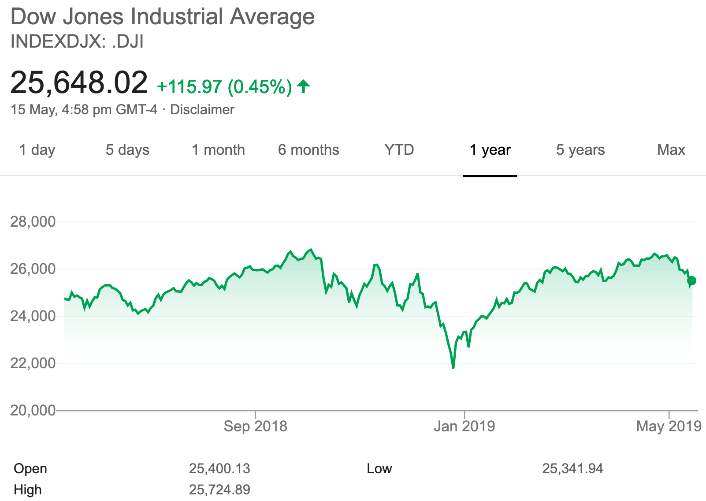
The chart on the left has a red tinge about it, which means trading loss over that one month period. The chart on the right is green, suggesting a trading gain over that 12 month period.
The red chart above highlights the renewed rhetoric between China and America. Although we cannot always know what is going on behind closed doors, in general terms, China and America appeared to be making progress with their trade talks. Then, two or three weeks ago, it all seemed to change for the worse.
Basically, the United States of America has hiked tariffs on $200 billion of Chinese goods from a 10% tariff to a 25% tariff. Understandably, this has escalated tensions between those two countries. Donald Trump has tweeted that there is “no rush” to get a deal done and that indeed, plans are afoot to consider imposing tariffs on all Chinese imports.
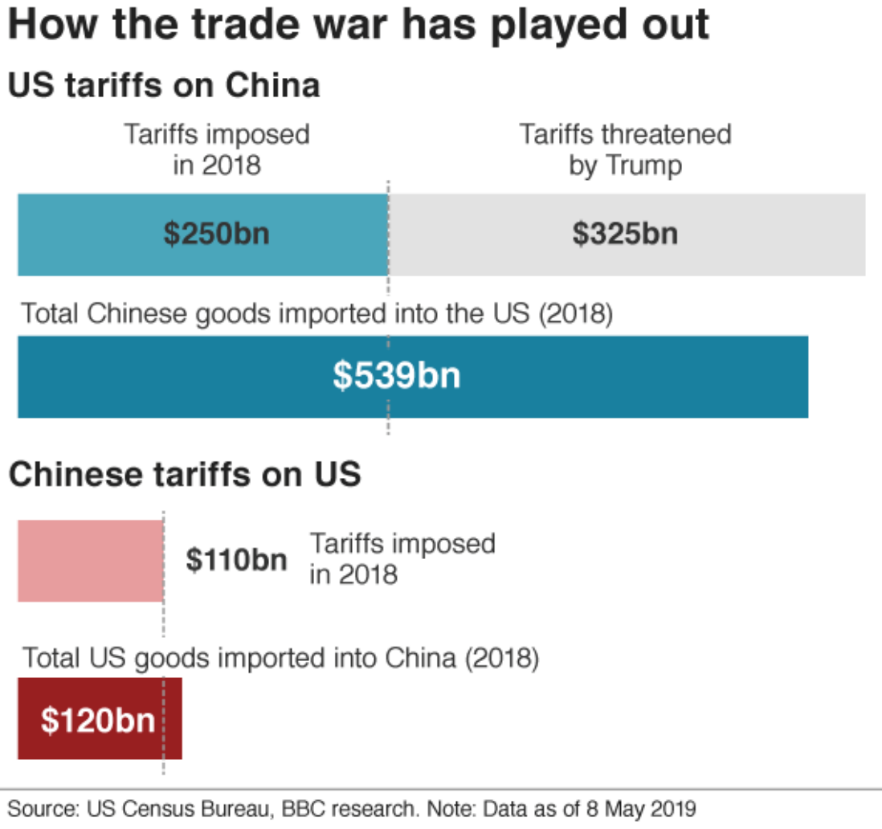
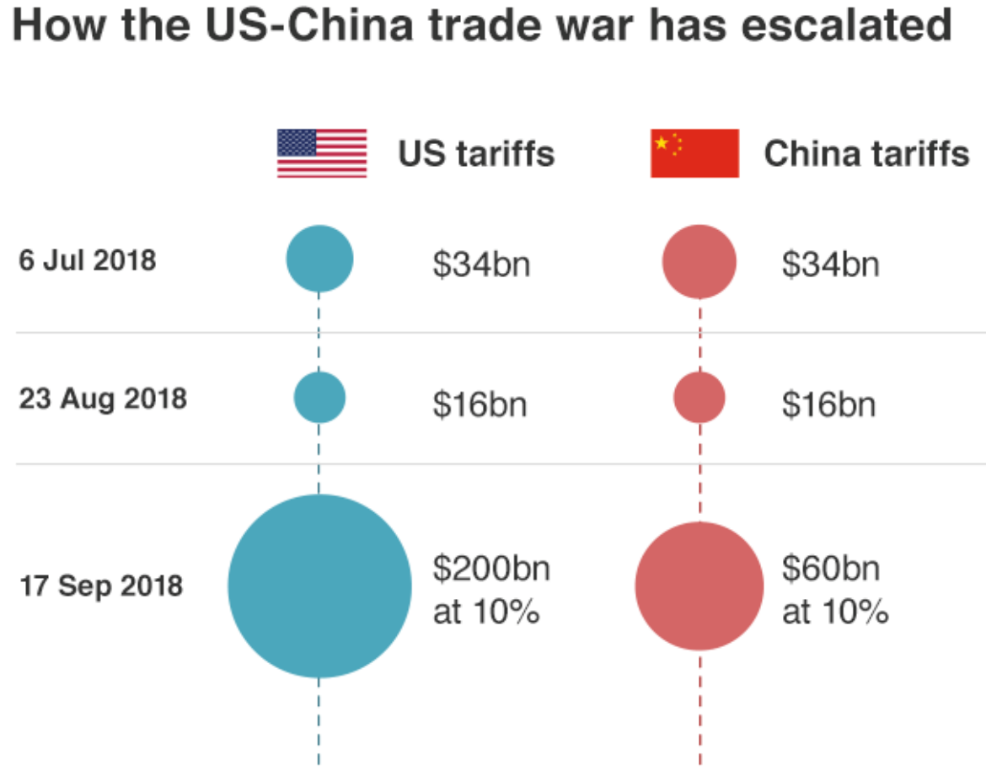
The above charts are reasonably straightforward and show how the US/China trade relationship has been developing over the last 18 months or so.
Interestingly, the recent increased tariff rates only apply to goods leaving China after the recent deadline and will impact only on shipments when they reach America, which could take maybe two or three weeks. In theory, this still leaves some room for negotiation.
Although it is too early to know for sure, the logical conclusion of an extended trade war between America and China is a slowing down of global trade, at least in the short to medium term. Obviously, this has an impact on economic growth and in turn on company profits and certainly on trading prices across markets. You can just about guarantee that the markets will overreact should this situation become entrenched and protracted. As for China, their comment is, “The Chinese side deeply regrets that it will have to take necessary countermeasures.” An editorial published by a government affiliated WeChat account said, “If you are willing to talk, we’ll talk. If you intend to have a war, then we fight.”
Economic Update
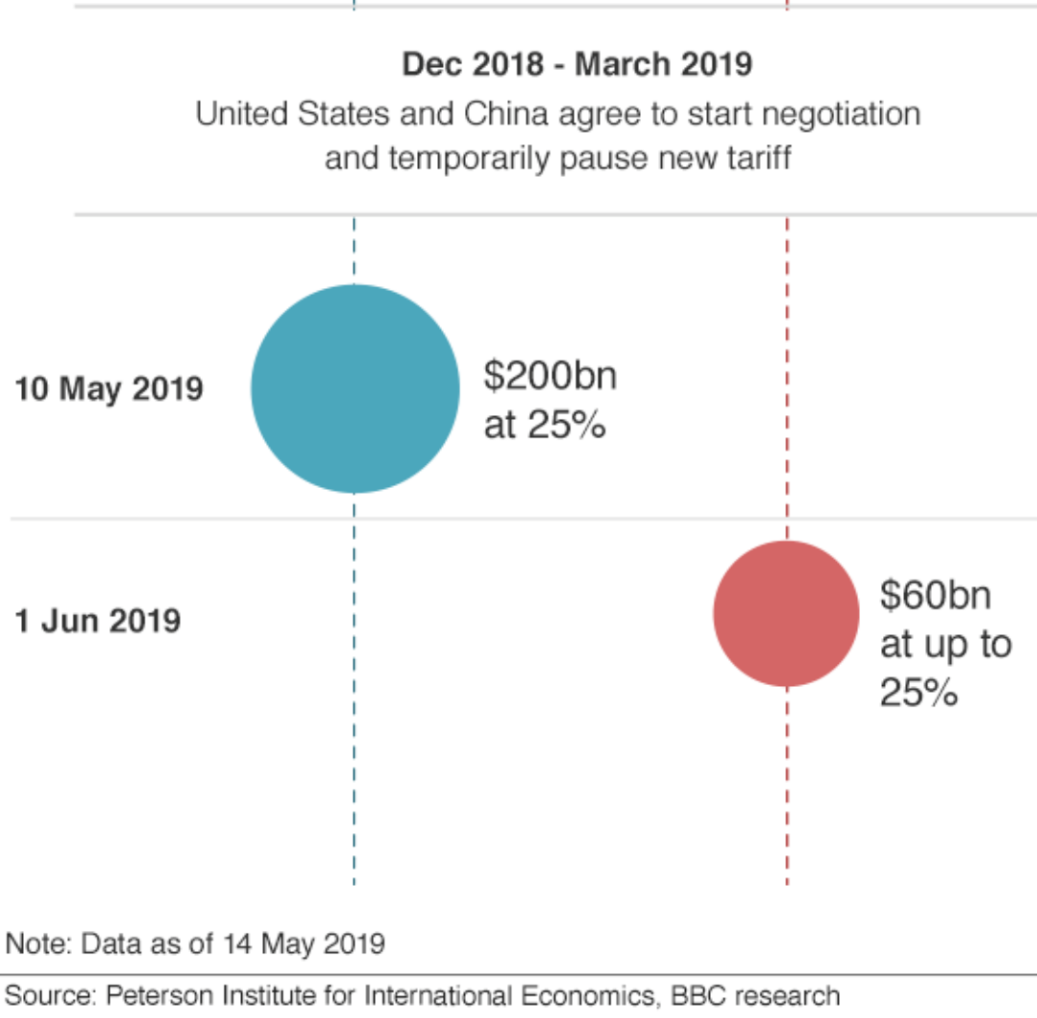
The above chart provides an update on current and proposed trade tariffs.
Can the trade tensions between America and China last? Although time will tell, in my view, it would appear unlikely that the trade tensions between America and China will continue on at length without some negotiation and compromise at some point. That is because the two economies not only co-exist with each other in what is an increasingly shrinking global economy, but also their significant economies are very much intertwined, which makes an ongoing, intensified trade war appear unsustainable if not amusing.
American companies, such as Boeing, Nike, Apple, Starbucks, among others, need China’s critical growing middle-class to support their growth. One would expect China to continue growing in importance as a buyer for US companies. As for America, it has enjoyed a strong appetite for those cheap goods created in Chinese factories, that in turn have employed millions upon millions of Chinese workers. Do you see what I mean?
These two economies are each other’s biggest trading partners by some measures. Although perhaps deviating from the point, China is also America’s largest foreign creditor, with around US$1.1 trillion of treasuries invested. Interestingly, trade tariffs are considered to be a weapon of choice as distinct from negotiation. For example, in my simple mind, it would appear to me that China’s Belt and Road initiative offers China a way out over the more medium term.
In other words, it may not need to be totally reliant on America for trade. Obviously, I am significantly over-simplifying things; however, if Donald Trump and Xi Jinping could sit around a table together, walking in each other’s shoes perhaps for a few kilometres, they might be able to come up with an approach other than trade tariffs. Of course, they would both need to participate.
By the way, the US has just banned Huawei from selling telecom gear and threatens Huawei’s supply chain. President Donald Trump signed the executive order recently, which bars US firms from using telecom gear from companies and countries that the administration believes could be a threat to national security.
This order was not identifying China or Huawei as the intended target of this order. That said, it was not long after the order was issued that the US Commerce Department added Huawei to the list of companies that the US Government considers to be underlying American interests.
Manufacturing Purchasing Managers’ Index (PMI)
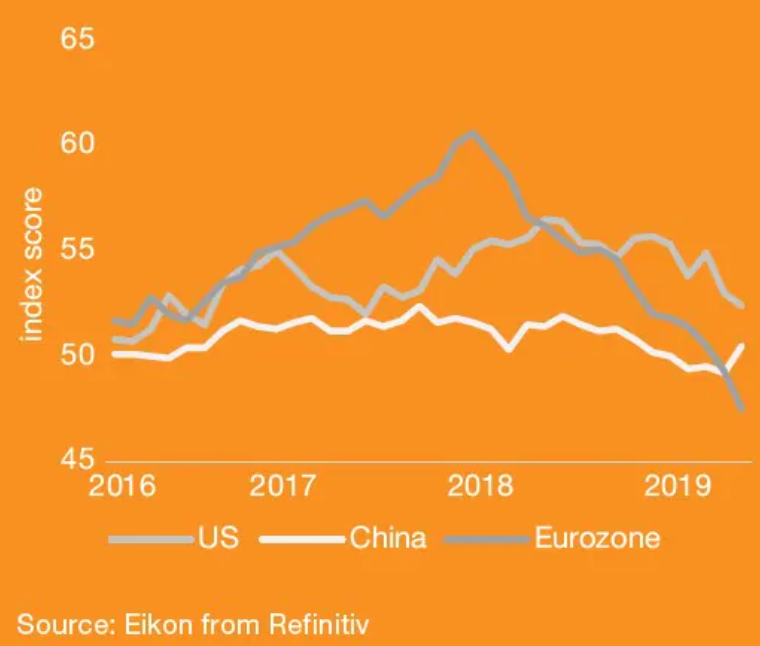
The above chart tracks the recent decline in the manufacturing Purchasing Managers’ Index for the US, China and the Eurozone.
It appears that the weakness in the global economy appears to be concentrated in the manufacturing sector. As the chart above shows, Europe in particular has seen a significant reversal. A score of 50 indicates rising output, whereas a score below 50 suggests contraction. The US-China trade conflict is starting to impact and causing disruption to some supply chains, as well as possibly suppressing the appetite for trade. This, of course, can also have an impact on Europe too. They are a large exporter to both China and the US.
Also, China appears to be attempting to deleverage its highly indebted corporate sector, which in turn is definitely having downward pressure on its own manufacturing levels and those of its main supplier. China, of course, will need to be careful about its economic growth target of around 6% to 6.5%. Too much deleveraging will unfavourably impact on economic growth in China. They will likely take measures if need be, to stabilise economic growth though.
Consumer price inflation has declined and remains stubbornly low
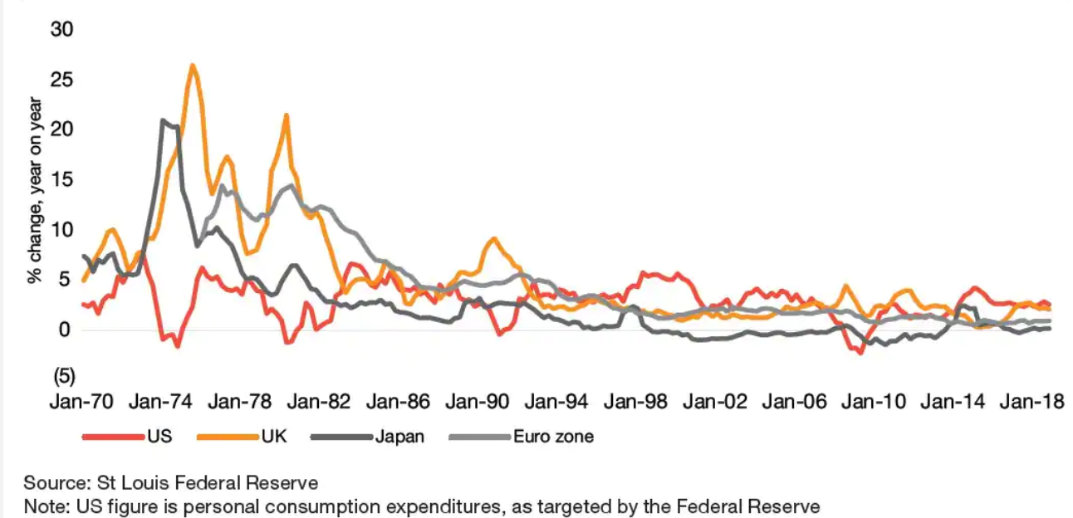
The above chart shows consumer price inflation for the US, UK, Japan and Eurozone from 1970 to 2018.
Inflation has gone from problematically high to puzzlingly low. You may remember the 1970s and 1980s and perhaps the first part of the 1990s, whereby inflation was the enemy of all. Retirees, investing in term deposits, thought interest rates in those days were great. The nominal rates were much higher than today but what some did not realise was that the cost of goods and services was also increasing month over month. The net outcome for many who lived off term deposits in the bank was that they found themselves, after a few short years, basically broke. Without growth on their capital, the income off their lifetime savings was only able to purchase less, less, less and less until such time as it could hardly purchase much at all.
Many central banks around the world targeted low inflation back in the day, often setting a goal of around 2%. Today, however, inflation is arguably too low as economies struggle to free themselves from the grip of deflation. Japan would be the most glaring example of monetary policy stretching the very limits of what anyone thought was possible. The central bank of Japan now owns assets worth more than it’s economic growth (GDP) as it seeks higher prices; however, inflation remains stubbornly flat and almost non-existent.
Another interesting factor is the apparent erosion of trade union membership, which has, to some extent, weakened workers’ bargaining power. For example, in the UK, union membership has fallen from around 40% of the workforce to around 20% over the last 30 years or so. In the US, from around 20% to 10% over that same timeline.
Also, commodity prices, another source of potential inflation for those energy hungry advanced economies, have also been low in recent years too. If you have been around long enough, you will see all manner of things move in cycles. In New Zealand, for example, we have seen centralisation and then decentralisation and then recentralisation as an example. Anyway, as I have maintained for some years, deflationary funk maintains its firm grip across the global economy.
Australia – housing finance approvals by segment – value of housing finance (billions of dollars, left side axis)
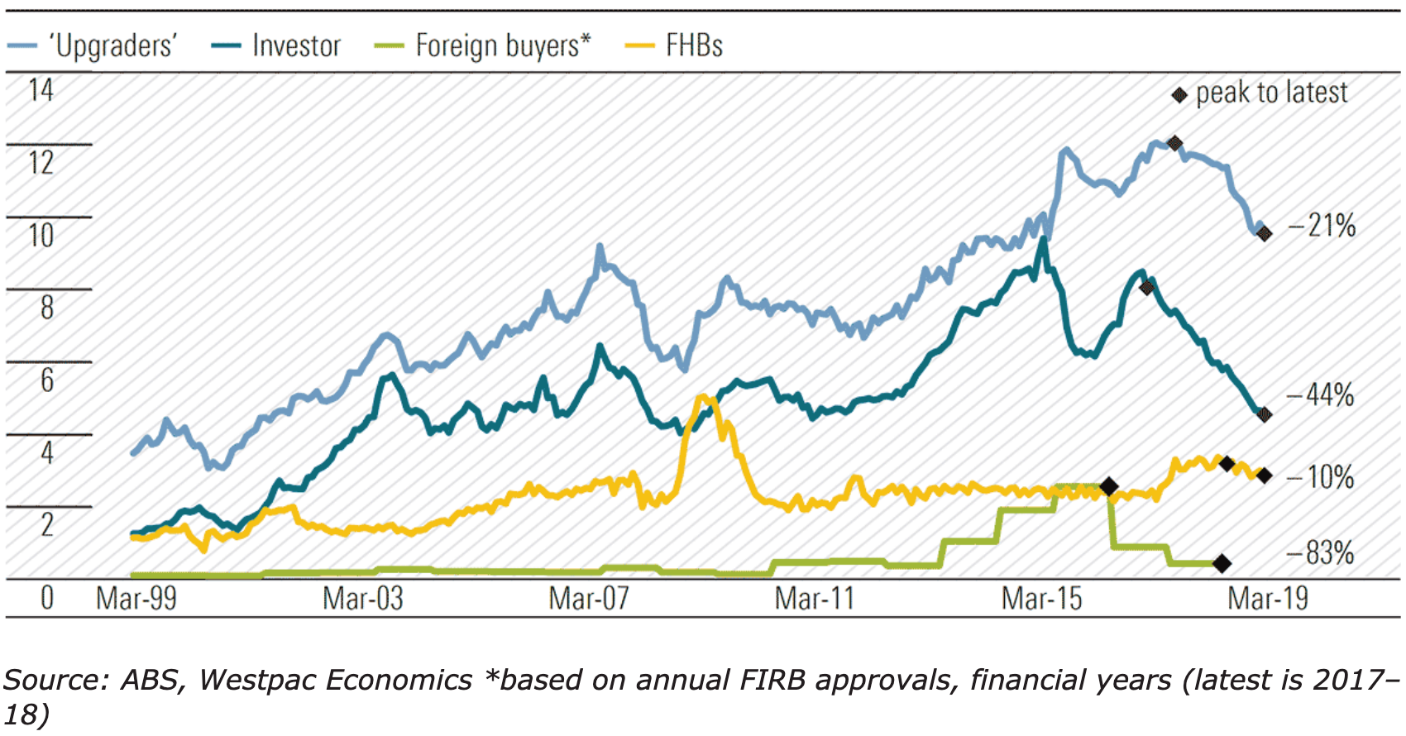
The left side axis measures the value of housing finance approved in billions of dollars. The right side percentages show the decline from the peak to where things are at now.
Residential property prices, along with financing approvals, continue to decline. The total value of new home loans (excluding refinancing) fell 3.2% from February to be down 18.4% over the last 12 months. Also, the value of both owner/occupier and investor loans are down as well, as the chart above shows. The short of it is that right now, there appears to be no respite.
Further, in Australia, business sentiment appears to be on the decline, although this could be attributed partially to the current elections (?). Not only that though, wages growth appears to be flatlining. Australia’s wages growth index increased by 0.5% in the March quarter, unchanged from the December quarter and below the consensus for a 0.6% increase. The annual pace of increase remains at 2.3% – not horrible but definitely range bound, flatlining and not what the economy needs to help stimulate growth.
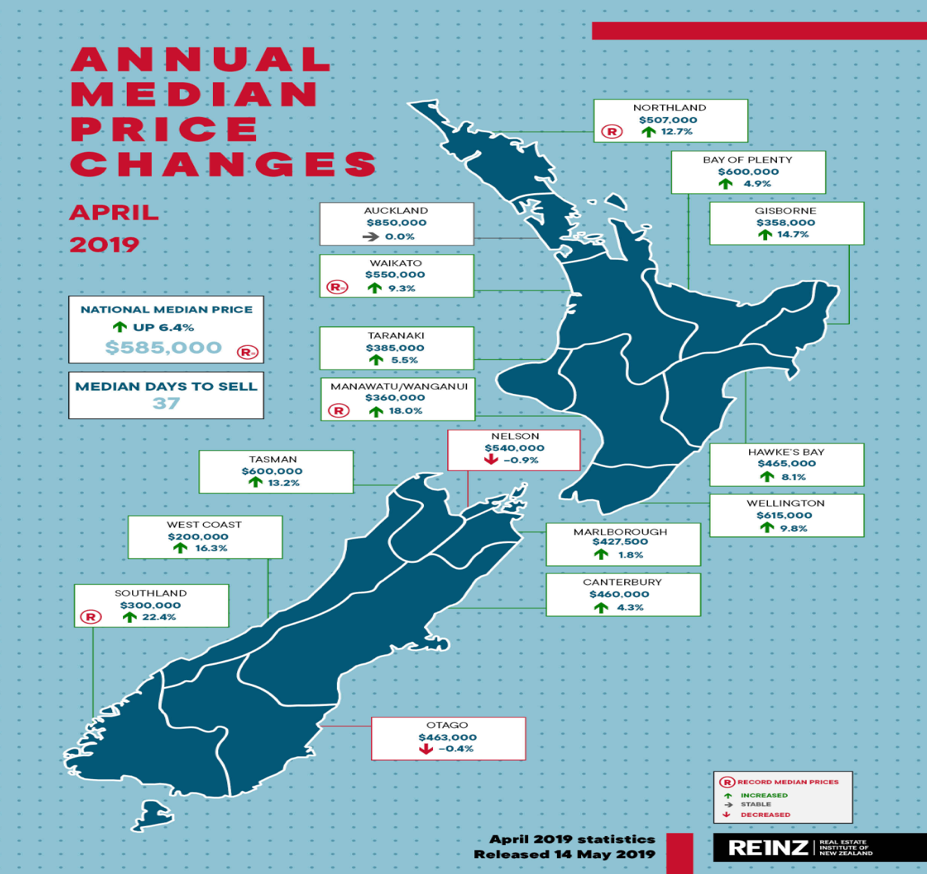
The above chart shows median price changes.
New Zealand’s residential property prices remain mixed. In the short term, I suspect the recent reserve bank official cash rate cut may provide some stimulus to the residential property market near term as many Kiwis gauge the value of residential property by how much surplus cashflow they have to service a loan on a house – I kid you not! As I have often asked, “Is residential property in New Zealand an investment or a religion?”
Last week, I finalised the biannual global economic update. If you have not had a chance already and you would like to know where things stand globally and whether or not we are on the edge of the cliff, just click here to find out more …